Small Relief Rally CRYPTOCAP:TOTAL2 BINANCE:ETHUSDT
Disclaimer: Not financial advice! 🚨 Do your own research. Markets are risky—trade at your own discretion. I’m just sharing ideas, not guarantees. 📉📈
TOTAL2 trade ideas

ALT Market cap - Dip before 3TThe Crypto Total Market Cap Excluding BTC (CRYPTOCAP) is currently testing a critical support zone at the 21-month Simple Moving Average (SMA). Historically, this moving average has acted as a strong dynamic support, marking significant market reversals and uptrends.
✅ Price is bouncing off the 21 SMA, similar to previous bull market cycles.
✅ The recent correction appears to be a healthy retest of support rather than a trend reversal.
✅ The formation of higher lows suggests bullish momentum building up.
✅ If price holds above this level, we could see a strong rally in altcoins, pushing the total market cap higher.
A successful bounce from the 21 SMA could trigger a bullish continuation, leading to a market expansion toward 1.6T - 2.3T levels in the coming months.
🔸 A monthly close below the 21 SMA could invalidate this setup, leading to a deeper correction.
🔸 Key support zone to watch: $900B - $950B
🔸 Breakout confirmation: Monthly close above $1.1T
If history repeats, this could be the perfect accumulation zone before the next major altcoin season! Keep an eye on the monthly close and volume confirmation for the next big move.
Follow our TradingView account for more technical analysis updates. | Like, share, and comment your thoughts.
Cheers
GreenCrypto

LONG $900BMorning fellas,
I have been getting some spite, and about 75% of people who follow me stopped liking or commenting on my posts just because I've been sold since $100k and calling non-stop for this drop.
The drop came, and the moonfellas out there finally gave in.
Now it's time to look for longs and nothing better than a few select alt coins. I'm thinking $888B to $900B should hold and then we fly. Check trajectory line.
You people need to stop only posting that it's going up to the moon, and be realistic about things. Buy blood not green, buy LINK at $7 and not $25. Buy dot at $2 and not $15, and so on.
Trade thirsty, my friends.

Still Doubting Altseason? This Chart Might Change Your Mind..Hello Traders 🐺
Before we begin, let me tell you why I decided to publish this idea:
Over the past few weeks, I’ve received tons of comments and messages from people saying, "This time is different—we’re not going to see an Altcoin Season." So, I decided to lay out the full evidence pointing to a massive upcoming Altcoin Season. 🔥
📊 Breaking It Down
To make this easier to follow, I’ve used a line chart to remove the excess noise. As you can see, there’s a strong inverse correlation between BTC Dominance (BTC.D) and Altcoins' performance. But how does it actually work?
Every time we see a top in BTC.D, we enter a BTC season—meaning most of the capital flows into Bitcoin while altcoins lag behind. But after a while, BTC.D starts weakening, and at the same time, altcoins begin to gain strength and outperform BTC as the market shifts. 📉➡️📈
So far, we’ve had 2 major Altseasons, and right now, we’re seeing the same scenario playing out again:
✅ BTC.D is starting to show weakness
✅ Altcoins are beginning to outperform BTC
✅ If you zoom in on the ALTS/BTC chart, you’ll notice that many altcoins are trading near their all-time lows against BTC — a huge opportunity!
What Else?
I also believe we’re close to entering a Quantitative Easing (QE) phase, which means more liquidity will be available to fuel the next rally. Combine that with current chart setups, and the case for Altseason 2025 becomes even stronger.
I hope you enjoyed this idea! Make sure to like and follow for more updates—and as always:
🐺 Discipline is rarely enjoyable, but almost always profitable 🐺
🐺 KIU_COIN 🐺

TOTAL2 Altcoins #Altcoins mcap TOTAL2 gathers strength above coraltrend and ema20 major support ahead of next major run!

Why A New Quarter Is So Important Why a new quarter is so important and how/why it can change market trends
• Performance Reporting: Institutions evaluate performance each quarter, influencing new investment decisions.
• Portfolio Rebalancing: Hedge funds and institutions reposition holdings, adjusting asset allocations based on new quarterly forecasts.
• Fund Inflows/Outflows: New investor capital often enters or exits funds quarterly, triggering significant buying or selling.
• Sector Rotation: Institutions shift funds to sectors expected to outperform, aligning with updated quarterly outlooks.
• Earnings Season Anticipation: Market positions adjust ahead of quarterly corporate earnings reports, impacting price volatility.
• Regulatory and Risk Management: Institutional investors rebalance to meet regulatory requirements and manage risk exposure quarterly.
Share below in comments other reasons why a new quarter is so important

Crypto Total Market Cap Excluding BTC (TOTAL2) - Daily Timeframe1. Market Overview:
Current market cap: $1.05T (+0.83%)
The market cap has bounced from recent lows (~$827B) and is showing some recovery.
The Fibonacci retracement levels suggest key areas of resistance and support.
2. Fibonacci Levels & Market Structure:
The downtrend retracement from the recent high ($1.64T) to the low ($923B) is mapped with Fibonacci levels.**
23.6% ($1.09T) and 38.2% ($1.2T) retracement levels are key resistances.
Major resistance around $1.28T (61.8% Fib), which aligns with previous consolidation zones.
If the price fails to break above $1.09T convincingly, a potential retest of the $923B- MIL:1T range is possible.
3. RSI & Momentum:
RSI is showing slight bullish divergence, indicating that selling pressure is reducing.
RSI is currently below 50, meaning there is still cautious sentiment, but an upward break could confirm a bullish shift.
4. Key Scenarios:
✅ Bullish Case: If TOTAL2 reclaims $1.09T and holds above, it could target $1.2T and then $1.28T.
❌ Bearish Case: Failure to break $1.09T might result in a pullback towards MIL:1T or lower.
Conclusion:
Short-term: Neutral to slightly bullish (needs confirmation above $1.09T).
Long-term: Needs a break above $1.2T for trend reversal confirmation.
Watching volume and RSI movement is crucial for next moves.
Would you like a detailed trade setup or further insights on potential altcoin impact? 🚀

AltCoin Total 2 Index The divergence of HD+ in the altcoin index (weekly timeframe) indicates a potential pattern. Following the BX movement, we experienced the XY growth. If the previous step repeats, we can expect growth from the current range. Additionally, during the recent correction, we observed an increase in the depth of the range three times, similar to the previous corrective step.

#TOTAL2 1W-TF🚀 #TOTAL2 Analysis
📊 Weekly Timeframe:
📈 Ascending Parallel Channel – Price has tested and rebounded from lower support, keeping the structure intact.
⚡ Key Outlook:
- If momentum strengthens, CRYPTOCAP:ETH and alts could see a bullish move.
- A breakdown below support may invalidate the trend.
👀 Watch for confirmation of strength before positioning!

BULLISH DIVERGENCE Crypto Total Excluding BTC... GOOD FOR CRYPTOLooking for any constructive criticisms, happy thoughts, tips, tricks, or any other cool stuff. Looking at the Crypto total market cap excluding bitcoin, it appears to be showing a bullish divergence with the Mkt Cap Total showing lower lows, as the RSI is now showing higher lows. Looks like a Bullish Divergence to me. What do you think? The RSI is a momentum indicator. Please let me know your thoughts.
Cheers!

The Official Start of Alt Season (Only Up For 217days)I dare to say that it’s the official start of alt season. Over the next 217 days, we are going only up...
ONLY IF WE HOLD THE LINE.
So, throughout this technical analysis (TA), you will see some very important charts that we need to hold the line on. If the line is broken, there is no alt season for me; the line in the sand will be drawn.
The main chart above is currently TOTAL2, which means the total crypto market cap WITHOUT BTC.
What you’re about to see here on these charts is nothing short of amazing. The chart on the left is my new secret weapon for knowing when alts have bottomed. As you can see, every time we hit the top of this resistance on this chart, it marks a major alt bottom. So far, it has been happening once a year since 2022.
As of this week, we have gotten the 4th hit.
The stars are once again aligning. Finally, once I see everything lining up, I know that there’s an extremely high chance that I will be correct. What are the chances that we hit the top of this resistance for the 4th time on the week of the Fibonacci time sequence you see on the main chart, which also happens to be the bottom of this diagonal support? Again, too many things are lining up here for me.
This time, the Fibonacci sequence I’m following failed to give us anything on the first two hits, but the third (2.618) showed a nice pivot, and the fourth (3.618) showed us the August 2024 alt crash, which is a very important date and event because it mirrored the COVID crash of the last cycle in many ways. So far, then, we have a 50% hit rate on this sequence. We shall see if this week’s Fibonacci count is the actual bottom and pivot of the year.
The most important date for me is the one after October 13th, 2025. This has very much piqued my interest because this is exactly when I think the altcoin market will top this year.
Why October? Well, if you take a look at my Bitcoin TAs, I think September 2025 will be the Bitcoin cycle top this year, and what normally happens is the altcoin market rallies 20–30 days after BTC has topped. Let’s take a look:
As you can see, Bitcoin topped in April 2021, and 28 days later, the alt market topped.
In the 2017 bull market, the same thing happened: Bitcoin topped, and 22 days later, the altcoin market topped.
My thesis for Bitcoin is that we are currently starting the final Wave 5 that will top in mid-September. As you can see, my Fibonacci time sequence has a hit on this timeframe, which is also 1,050 days from the cycle low—the exact length the last two cycles have taken from bottom to top. So if Bitcoin tops in Mid September 2025 its very much possible that 20-30days after that alt market will top which line up with Mid October !
The ascending triangle technical target is about a 5 trillion market cap at the 3.618 level, which is the Fibonacci level we topped out at last cycle.
Many of the greatest rallies have started at this RSI level.
The Wyckoff Spring indicator fired off for the third time in ETH history. This is a real-time signal; it has no lag.
Could this be the spring?
Conclusion
I’m 99% sure this is the bottom as long as this diagonal support is not broken. That’s the only condition here. If it holds, a V-shaped recovery is likely, and expect only up for 217 days.
Alts- Will they drop further? (+name your alt)In my early February analysis on altcoins , I noted that while a bounce was likely after the sharp drop triggered by Trump’s initial tax remarks, the $1.3T level would act as strong resistance.
I expected another decline once this resistance was confirmed— which is exactly what happened, as the market reached that level and began to drop again.
After multiple tests of the rising trendline that began in October 2023, last week saw a breakdown, with price finding support just above $900B (an important level as we can see from the posted chart).
But was that the full extent of the drop?
In my view, we are far from being in the clear, and further declines seem likely. Technically, the rising trendline has been broken, and the recent rebound appears to be corrective rather than the start of a sustained recovery.
As long as the price remains below the $1.15T–$1.2T zone, I see a high probability of the market
breaking under 900B zone support and reaching $700B in the coming months.

ALTS MARKET CAP ANALYSIS. Altcoin Market Cap Analysis: Potential Rebound or Breakdown?
The altcoin market cap is currently bouncing off the support trendline of its ascending triangle pattern, which indicates a potential bullish continuation.
Ascending Triangle Support:
The market cap is testing a key support trendline within an ascending triangle, which is typically a bullish formation.
Sustaining above this level strengthens the case for a breakout.
Ichimoku Cloud Indicates Bullish Momentum:
The Ichimoku Cloud is turning supportive, which indicates an improving market sentiment.
A move above the cloud could confirm bullish momentum.
Possible Scenario:
If the price sustains above the trendline, the altcoin could see a strong bounce, leading to further gains.
A breakout above the resistance level of the triangle would confirm a larger uptrend.
A break below the support would invalidate the bullish structure.
This could lead to a deeper correction, which indicates increasing risk.
If you found this analysis helpful, hit the Like button and share your thoughts or questions in the comments below. Your feedback matters!
Thanks for your support!
DYOR. NFA

Resistance at 1.3T: Is a Deeper Crypto Correction Coming?The long-awaited Trump inauguration, which was expected to trigger an altcoin season, had the exact opposite effect. This once again proves that when the majority of market participants expect one outcome, the market often does the opposite.
After several days of testing support, the "tax policy" announcement triggered a breakdown below the 1.3T level, causing Total 3 to drop around 30% to 1T.
The market is now experiencing a normal rebound, but I am not very optimistic in the medium term.
Technically, 1.3T has now turned into strong resistance. In my opinion, after this rebound, a new leg down is likely.
I expect a drop below 1T, potentially reaching around 900B in the near future.

Total 2 Marketcap - Is this cycle repeating the last two cycles?In this analysis, we are discussing the possible repetition of the last two cycles by the total 2 (Crypto Total Market Cap Excluding BTC) on the monthly timeframe. By comparing this cycle in conjunction with the RSI and the Stochastic RSI with the previous two cycles we could make a statement that the market might follow the same bearish signals.
What did we see in the previous two cycles with regard to the price action and RSI
In both bullmarket cycles we saw the total 2 making highers highs and higher lows. In both instances the RSI made a lower high while the price action made a higher how consulting in a bearish divergence on the monthly timeframe.
What did we see in the previous two cycles with regard to the price action and Stochastic RSI
In the last two bullmarkets we saw the Stochastic RSI (momentum indicator) rising to levels above 80 on the indicator, overbought territory. This means that the momentum to the upside in the Crypto market is immense. However, in both instances the Stochastic RSI was in overbought territory during the first top. After the first top the momentum weakened and thus resulting in bearish momentum below level 80.
However, the momentum weakening, both cycles made a new higher high. By making a new higher high the Stochastic RSI made a bullish cross around the 40/50 level. Nevertheless, after making a new higher high and a new Stochastic RSI cross up the price fell, resulting in another bearish Stochastic RSI cross down.
What we can conclude is that in both previous cycles the Stochastic RSI made a cross down below the 80 level at the first top and made a second cross down around the 40/50 level during the final top.
How does the previous cycles relate to this current cycle
In this current bullmarket we see the Total 2 Marketcap rising and making higher highs and higher lows. However, this cycle looks alike the past two cycles in comparison with the price action, RSI and Stochastic RSI.
This Cycle the price action made higher highs and the RSI made a lower high. Thus, resulting in a bearish divergence.
Also, in this cycle the first peak occurred with the Stochastic RSI above the 80 level and breaking down at a later moment, resulting in bearish momentum. However, this cycle did the same as the previous two. With the bearish momentum the Total 2 Marketcap made a new high with a second Stochastic RSI cross down at the 40/50 level.
Conclusion
This cycle looks a lot like the past two cycles in comparison with the RSI and Stochastic and thus suggesting that there is a possibility that we go in to a new bearmarket and repeat the last two cycles. The current evidence shows that the market might follow the similar path again.
What is a bearish divergence
A bearish divergence signify potential downtrends when prices rally to a new high while the indicator (RSI) refuses to reach a new high and thus making a lower high.
Thanks for your support!
Drop a like and leave a comment to have a conversation about this topic. Make sure to follow me so you don’t miss out on the next analysis.

TOTAL2 - Weekly Support Possibility The middle of this indicator was previously seen as a strong support
Right now this is being tested as support right now
Will it act as support as before or break down further?
Weekly timeframe for this indicator which is still in its bullish state

TOTAL2 - Bull IdeaAfter some short term bear movement I expect a strong bull move as we enter the final stage of this bull market
I have shown this bull movement with the green bars pattern with an extension up to 1.272
Don't get shaken out as we are in a large green upward channel
Daily timeframe

TOTAL2 \ #Altcoins Total2 alts mcap 936b major support retest phase is completed and then a new run will begin

TOTAL2 - Daily Uptrend RetestI think price will retest green circle, a point which was seen as a great support point leading to a strong bull move.
This bull move may occur again on this second retest of the upward white line within this broadening structure
still bullish it just may take another test of this downward movement
Daily timeframe

Altcoins Ready to Soar!By forming solid lows, it reaches a good zone where it can target the equal highs at 1.35

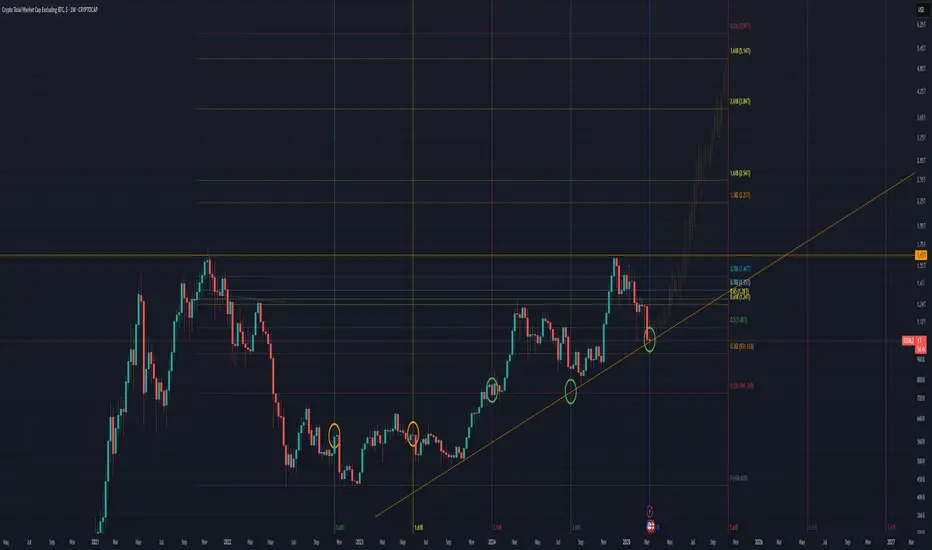
Total2 - threatening cycle top. 3W 21 SMAThe total2 is currently losing the trendline that it has held since 2017 for a second time. We were able to push back up through it last year.
Circled in purple are the times in history that the Total2 has came in contact with the 3W 21 SMA and either battled the 3W 21 SMA only to come back down through it...and close candles below it. Every time that this has happened, it has either been a market cycle top leading into a bear market, or the COVID crash...which was coming off of a market cycle bottom...so it is a tad different.
What are we doing in current time? We are losing the 2017 trendline for a second time this cycle, and we are also battling the 3W 21 SMA for a second time this cycle. If we don't have a very strong rally to push us up and out of trouble, then chances are we have a big crash, and perhaps fall into a bear market.
We are coming off of 3W bearish divergence playing out on the RSI and Stoch RSI, and the stoch RSI momentum is pointing downward. The 1W stoch rsi is oversold right now, though. So, price action on a weekly basis is what can save us, but it is looking pretty grim.
Downside targets would be 841B at the .50 fib, and 688-720B at the .618 pocket area.

We are due a 2017 style ALT season.One for the memory banks!
Now
do we actually get what we are "owed" ?? :)
We don't know
and nothing is owed to us of couurse
But
Selling too soon could be quite disastrous... as many peopleI speak to say to me 5X - 10X I am out..
Which may be prudent
If you are out. Stay out and don't FOMO back in again near the tops
So it's best to scale out in my opinion
last cycle was a quite difficult Alt season ... some bag holders actually did not get to experience any euphoria
Hence why I am leaning to an exsplosive alt season
BTC at $70k doesn't feel euphoric
so what will it take?

TOTAL2,CHART Analysis This is a 1D (Daily) Chart of TOTAL2, which represents the crypto market cap excluding Bitcoin. Here's the technical analysis based on the chart:
Key Observations:
Market Structure:
CHoCH (Change of Character): Multiple CHoCH signals indicate trend shifts.
BOS (Break of Structure): Bearish BOS confirms lower lows and downward momentum.
Support & Resistance:
Current Market Cap: ~$1.07T
Major Resistance (~1.3T - 1.5T): Marked by red zones indicating supply areas.
Strong Support (~900B - 1T): Blue zone suggests potential demand.
Next Major Support (~720B): If price breaks below the current support, the next major demand zone is around 721B.
Moving Averages:
200 EMA (Blue): Currently above the price, acting as resistance.
Short-term EMAs (Orange/Red): Price is below them, confirming a bearish trend.
RSI (Relative Strength Index):
RSI is below 50, indicating bearish momentum.
No clear bullish divergence yet, meaning further downside is possible.
Potential Scenarios:
Bullish Case:
If price holds above the 1T support zone, a bounce towards 1.2T - 1.3T resistance is possible.
RSI reclaiming 50+ could signal a shift in momentum.
Bearish Case:
If the price breaks below 1T, a drop towards 900B or even 720B could happen.
Market remains bearish unless we see a significant break of structure (BOS) to the upside.
Conclusion:
Market structure is currently bearish.
The 1T support zone is crucial—if it holds, a bounce could occur.
A break below it could lead to a deeper correction towards 900B or lower.
Would you like a trade setup suggestion based on these levels? 🚀
