Alts and btcI think it’s ok to long alts now unless it loses 700 billion support . btc should be going up as well for now
TOTAL2 trade ideas

Bear market for the ALTS or there is a way out?Hi there!
You can see the Fib retracement of the previous big order flow is to the 61% level, next fig order flow is retracing to 100% so far. That's the level at 652 B. Nothing wrong unless we drop under the 100% Fib retracement.
This is very important level because if we drop under, we will probably be in a long bear market for the ALT coins. Let's hope to stay over the water and to bounce up. If we do bounce up, then we ultimately will be targeting to reach out the completion of the big ABCD pattern ending with the ellipse (1,85 T). That it would be a nice bull run for the ALTS. GL to us!

Fibonacci Circles Idea TOTAL2 Green and Red are sequenced events
While Aqua and Yellow are related only by the 3.618 Fibonacci Circle of both Bear and Bull Trend lines
Any further interpretation of these events is welcomed

$TOTAL 2 - Alt coins have bounced off this important sup levelFor those who can stomach this crypto volatility, we have seen the market cap chart of the Alt coins bounce off $600mil this morning. Notice how important this support zone was in 2021 touching it multiple times and bouncing. Also importantly, this is where the anchored vwap zones come in using the December 2018 and March 2020 lows. This is no doubt an important support zone and bulls will want to protect it at all costs to keep Alt coins alive.
Note: Used a LOG chart to show more perspective, but same levels apply on the normal chart.

Total 2 Absolute CarnageAlt Coins are in total free fall.
A massive Head & Shoulders pattern has been completed and the measured move down from the break is 49.43%.
That puts the Total 2 Cap around 483 Billion.
Short-term relief is possible, but the general direction seems clear.

#ALTS MARKET CAP UPDATEHi guys, This is CryptoMojo, One of the most active trading view authors and fastest-growing communities.
Consider following me for the latest updates and Long /Short calls on almost every exchange.
I post short mid and long-term trade setups too.
Let’s get to the chart!
I have tried my best to bring the best possible outcome.
TOTAL 2 UPDATES:
total 2 is making this big descending channel pattern, currently, it looks like it is going to retest the lower support.
we can bounce from the lower support of this channel so let's see how it goes.
if it breaks the lower support of this channel then the chart will be invalided
This chart is likely to help you in making better trade decisions if it did consider upvoting this chart.
I would also love to know your charts and views in the comment section.
Thank you

TOTALSHITThis is the total cryptocurrency marketcap with wrapped bitcoin and stablecoins removed.
(MIM and BUSD marketcap were not available so substituted mcap of AVAX and XLM)

Total 2 is in sensitive situationIn the past, we had a fibo 0.618 as a strong support level,
but now, when market is making double high , and the correction is also at fibo 0.618
If there is no pullback from there,
We might see Total 2 market drops to 760B

Total 2 Analysis? more dip is coming!!!📊 Total2 marketcap
🕒 Daily Analysis
🟢 The TOTAL2 broke the important support and dumped hard from breaker block. Most altcoins see double digit loss in last 48 hours. TOTAL2 is now taking support at $780-$800 billion area. IWe might see a test of $925-$970 billion resistance now. If it goes above this resistance then we see some positive movement otherwise the dump will continue. Use proper stop in all your position because of market situation.

ALTCOINS ARE TRASHED Altcoin next stop is 400B.
Then 200B.
We may get back to COVID low like Netflix did.
From the COVID low 20B dollar for Altcoin, It has done 80x to reach ATH of 1.7Trillion dollars for nothing, no real usages, some Jpeg, Metaverse hype, P2E hype, Web3.0, Dao, Memes,... A lot of shits in the Altcoin market.
Now we will pay the price for FOMO in the market after it has done 50x-60x.
The pain is yet to come.
- You have seen irrational of Altcoins Market Cap. Just a hype, merely an idea and a website it has reached billion of dollars market cap.
- I see it as a Dotcom Bubble all over again.
- Like Market Makers said we were in the biggest and longest bulllrun ever since 2008 in stock market and crypto market.
- This bubble will cost so much to the people. The crash will not be in a day or two. It's gonna be a slow bleed and then Capitulation.
- Bitcoin may drop lower than 10k
- And Altcoins will be nothing.
Stack some money to buy the greatest dip in the FINANCIAL MARKET HISTORY.


#TOTAL2 1DAY UPDATE BY CRYPTOSANDERS Welcome to this quick update on the TOTAL2 analysis.
I have tried my best to bring the best possible outcome in this chart.
A very good position for ALTS!!
Total2 still holds support and is testing the previous resistance trendline and the altcoin may pump
If it is broken and closed downside from the support level then the chart will be invalid.
Sorry for my English it is not my native language.
Do hit the like button if you like it and share your charts in the comments section.
Thank you...

total 2 btc dangerThe end of Elliott's fifth wave and the break of the most important uptrend line indicate a heavy correction

TOTAL 2 - Finding support, Trend break on mid-term draw down?Keep an eye on TOTAL2 Chart
strong close sees TOTAL2 attempting to break mid-term down trend
Heavy Bearish sentiment but some positive signs for short to mid-term trades
Resistance and support marked
In the unlikely scenario we break above marked neck line on inv' H&S, obviously things will shift very rapidly
Positive indicators on Daily:
MACD bullish cross
RSI breaking trend
Viewed in context of Macro trend:

Let the ALT season beginsLooks like the bottom has been found and the second wave ended so we can expect 3. an impulse wave upwards that should be the biggest one in the last fifth wave of the current cycle. Some of the ALT coins have reached his fib extensions level and now it's the time for the rest live ones to rise before the end of the cycle.

Non-BTC/ETH Alts approach "bounce or break" moment!!Over the past year, alt coins in the crypto space have been taking quite a hit from the back-and-forth motions of BTC and ETH. Alt-coins are once again at their own recent lows when BTC was between $32-33K back in January despite the price of bitcoin dancing around a significantly higher $37-38K price today.
I typically believe that ETH determines the general direction of the crypto space instead of BTC (albeit BTC can determine the trend for ETH). However, there are quite a few occasions whereby cryptocurrencies can deviate from both BTC and ETH as indicated in these charts.
The first chart is the percentages of all cryptos BUT bitcoin and ethereum . As you can very well see, the percentages have been forming an ascending triangle pattern (bullish pennant?) over the past year, and once again the percentages are nearing the bottom of this triangle.
The second chart is the total market cap of all crypto EXCEPT bitcoin and ethereum , and it appears that an ascending channel has been forming since early 2021 for which the market cap is once again near the bottom of this trend line (for details on how I calculated the total market cap of everything BUT bitcoin and ethereum, see my previous post on how you too can calculate this value and more ).
The key question is: will these resistances hold or will they break over the next few days? Either way, these look to be interesting charts to keep an eye on for the trend of crypto beyond just BTC and ETH over the next few days/weeks.
But as always, this is solely my opinion and should not be taken as financial advice. But please like or comment if you agree or see anything further!

Alt coinsKeep some money on the sidelines because this bs might now hold , for too long . Btc risks 30k we all know what that means for alts so be careful

TOTAL2; CRYPTO TOTAL MARKET CAP EXCLUDE BTCTotal2 is falling to its targets
1: around 475B
2: 230B
NOTICE:
THIS IS NOT A FINANCIAL ADVICE

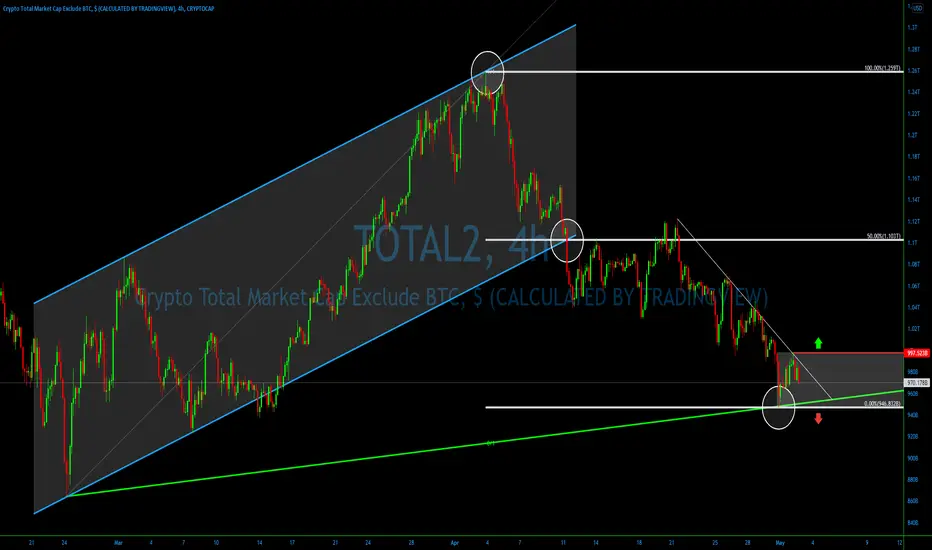
Crypto Market Cap bounced off a double support❗️💎On April 30, TOTAL2 had reached and rejected two technical indicators at 966.832B. The first is an 8/1 Gann Fan trendline and the second is a 0% Fibonacci level. We applied the Fibonacci so that 50% is placed right at the ascending channel breakout point. This way, Fibs show that after the breakout, the price has dropped the same distance as the width of the channel.
💎After the bounce, TOTAL2 retraced up, but failed to break a simple downtrend trendline. For the time being, we are likely to witness a short-term consolidation, between the strong psychological resistance near 1.0T and technical support at 946B.
💎Bears remain in control as long as........
TOTAL 2 What is a Tripple bottom reversal?
There should be an existing downtrend in place before the pattern occurs. The three lows should be roughly equal in price and spaced out from each other. While the price doesn't have to be exactly equal, it should be reasonably close to the same price, such that a trendline is horizontal.
is the market forming a Tripple Bottom Reversal?
if that is So, we may see a sharp 8 to 10% down More in Crypto market to confirm the pattern and a wick would give us more confirmation of a reversal.

ALTS MARKET CAP 12 HOURS UPDATEHi guys, This is CryptoMojo, One of the most active trading view authors and fastest-growing communities.
Do consider following me for the latest updates and Long /Short calls on almost every exchange.
I post short mid and long-term trade setups too.
Let’s get to the chart!
I have tried my best to bring the best possible outcome.
TOTAL 2 UPDATES:
total 2 is making this big EXPENDING channel pattern, currently, it looks like it is going to retest the lower support.
we can bounce from the lower support of this channel so let's see how it goes.
RSI is showing some bearish divergence move.
if it breaks the lower support of this channel then the chart will be invalided
This chart is likely to help you in making better trade decisions if it did consider upvoting this chart.
Would also love to know your charts and views in the comment section.
Thank you

TOTAL2 - Little strength but holding for now. Intraday tradingWhat to do with ALTs? In my recent ROSE analysis I included this TOTAL2 chart, just wanting to show a quick update. Somewhat remarkably, despite a few significant wicks below the trend, this structure of TOTAL2 is still in place, within this descending channel BUT now below many key levels.
Let me be clear - this is structurally very weak, but we can possibly get a small bounce and can speculate on intraday alt trades. If we see TOTAL pierce through the resistance levels (dotted line) and regain support above and test the declining channel obviously we can feel more bullish on alts.
Though to my mind the market is very fragile right now, I am currently ONLY trading ROSE and BTC
But this isn't to say there aren't other opportunities, and I will be speculating on them if I see them

