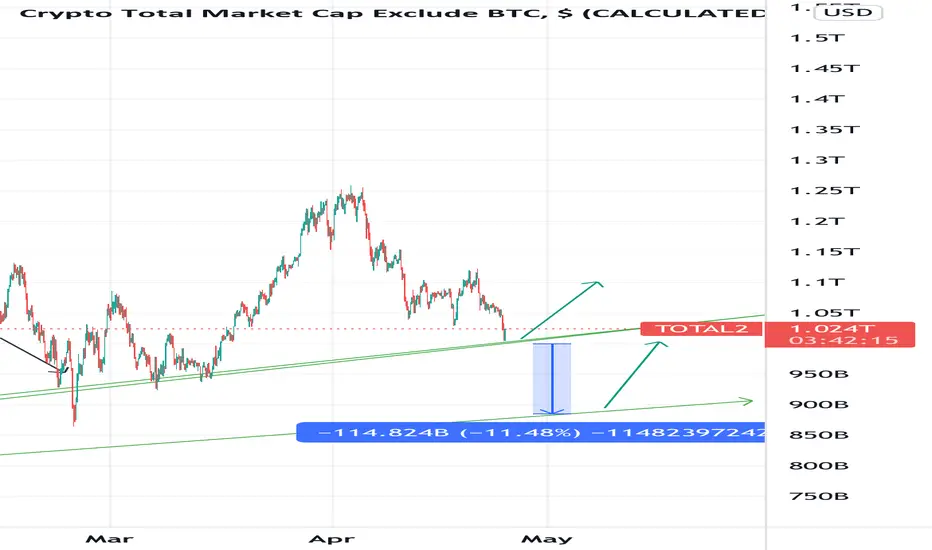
Alt coins marketcapTo me it looks like alts held the 1T support is still unclear what is gonna happen later on but I bought the support some alts coins I bought , unless we lose the support will hold until then , DXY is running very hot so we should expect a decline soon and we could see crypto rally,
TOTAL2 trade ideas


TOTAL 2 has left its channelThe total index exits the channel in the long-term weekly and, on a weekly basis, forms the Rising wedge pattern

TOTAL MARKET CAP 12 HOURS UPDATE Hi guys, This is CryptoMojo, One of the most active trading view authors and fastest-growing communities.
Do consider following me for the latest updates and Long /Short calls on almost every exchange.
I post short mid and long-term trade setups too.
Let’s get to the chart!
I have tried my best to bring the best possible outcome.
TOTAL 2 UPDATES:
total 2 is making this big ascending channel pattern, currently, it is making this falling wedge pattern inside the channel.
we bounced from the lower support of this channel but we need to break out this falling wedge pattern let's see how it goes.
RSI is showing some bullish divergence move.
if it breaks the lower support of this channel then the chart will be invalided
This chart is likely to help you in making better trade decisions if it did consider upvoting this chart.
Would also love to know your charts and views in the comment section.
Thank you

altcoins gonna suffer moreThis is the index of the market cap of all altcoins (ETH included). With BTC going down it appears clear that altcoins will suffer and possibly breakdown this ascending channel.
Going below the 1T dollars market cap means many alts will be rekt and won't survive as most of the alts dumped already in the past months and are close to the point of no return. BE SURE you have the right bags and try to avoid buying alts. In this moment it's better to avoid buying anything if not stablecoins.
I coulnd't offload my bags bought months ago but the last fiat I've put into crypto it's all in stable staking, away from risks. Unfortunately the world's economy is crippled and cryptomarket is now too big not to be affected from this, until stock market goes down we can't see BTC going up and consequently altseason won't start.

Alts supportAlt coins are basically at support now , despite monthly chart looking scary it could bounce off this level for the mean time , should btc fall below 37500 it’s game over for bulls then another 12% down , but as of right now it’s still above trendline
Total2 total alt coins market cap Dam this is the first time in nearly two years the Macd signaling a bearish reversal for the entire alt coin market. What this means usually when the Macd crosses and turns red it’s reversal most of the time. The month has a few days left but it’s Lilkely to close on red . even in such scenario as long as 1T holds ir could move up from support despite the Macd cross . So we gota pay really close attention to the 1T support , should it lose it we go -40% on all the dam market . am bullish on the coins but we can’t ignore this scenario I would say keep some cash on the sidelines just in case

TOTAL ALTCOIN MC- As you can see the total market cap is edging to a breakout of that triangular pattern, we could see a massive breakout coming soon!
- A massive shake out, cyber attack or regulations, could cause the market to break below.
- I love to cover both sides of the story as anything can happen, this is crypto one of the most volatile markets!

alt season?the total market cap (excluding btc) hasn't been able to break the 50 ma for awhile currently we are retesting the 50 ma after the break out. a higher high would be a great confirmation here (breaking above 200ma)


Total2 Potential Double BottomHey guys, its been while to I post here, There is a only choppy reaction in market right now. But I try to keep update here as you see in the chart potential double bottom here total2 is the always key to bull market if we close daily 1.08 (Blue Horizental Line) Double Bottom Confirmed Lets See What Happen. I think great days coming for bitcoin.

ALTSEASON might be right around the corner.This is the Crypto Total Market Cap excluding Bitcoin, which illustrates the Capitalization of the rest of the cryptocurrency market (altcoins essentially).
As you see, this index has been trading around the 1W MA50 (blue trend-line) since late January 2022, basically since the start of the year, with the 1W MA100 (green trend-line) firmly supporting below. Practically the market has been consolidating in a sideways (wide though) trade since May 2021.
The last time we saw the price consolidating around the 1W MA50 was in Q3 - Q4 2019. That was the 1st Accumulation Phase of this Cycle. If it weren't for the Black Swan event of the COVID melt-down in March 2020, the index would have continued rising after breaking above the 1W MA50 for the last time.
This chart shows all Accumulation and Rally phases since 2014. The RSI patterns on all are similar. I speculate that the current Accumulation Phase (which is this Cycle's 2nd) is about to end because the 1W RSI is completing the curve pattern upwards as it has broken above its MA (black line) for the second time.
If it does, then the 2nd Rally of the current Cycle should start, which is essentially what we call an 'Altseason'.
--------------------------------------------------------------------------------------------------------
** Please support this idea with your likes and comments, it is the best way to keep it relevant and support me. **
--------------------------------------------------------------------------------------------------------

IS ALTSEASON OVER ?Hi guys, This is CryptoMojo, One of the most active trading view authors and fastest-growing communities.
Do consider following me for the latest updates and Long /Short calls on almost every exchange.
I post short mid and long-term trade setups too.
Let’s get to the chart!
I have tried my best to bring the best possible outcome in this chart, Do not consider it as an
My previous total 2 charts are going wall currently It is lying on the support of this UPPER SUPPORT LEVEL OF THIS SYMMETRICAL TRIANGLE PATTERN.
MACD crossover is showing BULLISH momentum. RSI has entered the oversold region.
This chart is likely to help you in making better trade decisions if it did consider upvoting this chart.
Would also love to know your charts and views in the comment section.
Thank you

[UPDATE TOTAL2] It's always the same story. 2022 / 2024? Well, history rhymes.
This model suggests we could reach > 10T in total 2 market cap between 2023 and 2024.

Will Altcoins perform a Perfect Bump and Run Pattern or Fail? 1. Leading phase.
2. Bump
3. Retest and Run.
Let's see.

TOTAL2 : shows bullish signshello guys
-Over $31 million in #BTC Long Liquidations in 30 minutes on that recent move down,
And double this amount for the rest of the currencies.
-This game has become known and the price will return and rebound, and what supports this, looking at the TOTAL2 chart:
-There is a positive divergence with both stochastics and RSI
-The price was originally at the previously breached support area, to retest, and the current dive is only to liquidate long contracts. -- Also, the price touched the newly formed rising trend line - also a retest of the previously breached descending trend line.
-All this is useful for the market in the coming period.

Alt coinsI will be buying the dip on top alts it’s clearly still inside an uptrend channel even if btc drops to 40k it will stilll be well inside. for now could retrace to lower supports so keep an eye but overall bullish

TOTAL2 - We are quite safe from BearsThe 50MA is protecting us from Bears
This 50MA on this Weekly timeframe will most likely hodl and lead to a big price hike in price
Simple yet effective Analysis

TOTAL MARKET CAP 12 HOURS UPDATE Hi guys, This is CryptoMojo, One of the most active trading view authors and fastest-growing communities.
Do consider following me for the latest updates and Long /Short calls on almost every exchange.
I post short mid and long-term trade setups too.
Let’s get to the chart!
I have tried my best to bring the best possible outcome in this chart, Do not consider it as an
My previous total 2 charts is going wall currently It is lying on the support of this EMA.MACD crossover is showing bearish momentum. RSI has entered the oversold region. We've to wait for a sustained breakout/breakdown to confirm the next move of ALTS.
This chart is likely to help you in making better trade decisions, if it did do consider upvoting this chart.
Would also love to know your charts and views in the comment section.
Thank you

TOTAL2: ALTS STARTS BOUNCING AGAIN SOON!!Hello everyone, if you like the idea, do not forget to support with a like and follow.
Welcome to this TOTAL2 aka Altcoin market cap update. Total2 is the market cap of the whole market excluding BTC means which measures the market cap of all the Altcoins.
Total2 forming an Adam&Eve pattern 12hr time frame. After the breaking out of the neckline currently it is going for a retest. The retest level is at around $1.14T from where we can expect a good bounce in Alts.
As of now, it's better to wait for a long entry and if you holding any then hold only on spot.
If you like this idea then do support it with like and follow.
Also, share your views in the comment section.
Thank You!

Crypto danger if....If it closes the daily inside the downtrend again....I better unload some cryptos

Crypto correction3 tops...odds are that the uptrend is broken....a possible support in pink rectangle

Total 2 alt coins marketcapDon’t get this wrong , buy the dip rally has started this is a pullback only from recent highs
