About to Sell Your Altcoins? STOP & Read This First!!🚀 Hey Traders! Ready for Altcoins’ Next Big Move? 👋
If you’re finding value in this analysis, smash that 👍 and hit Follow for high-accuracy trade setups! 💹🔥
I know many are frustrated and losing hope in altcoins due to the current market conditions. But selling your spot holdings now—right before a major move—could be the worst decision of your trading journey. Before making any rash decisions, read this update carefully! 👇
📊 What is Total2?
Total2 represents the total market capitalization of all cryptocurrencies except Bitcoin (BTC). It helps us gauge the strength and momentum of the altcoin market.
💡 How to Use Total2 in Trading?
📉 If Total2 is falling → BTC dominance is high, and altcoins are struggling.
📈 If Total2 is rising → Altcoins are gaining strength, signaling a possible altseason.
🔥 Altcoin Market Cap (Total2) Looks Bullish!
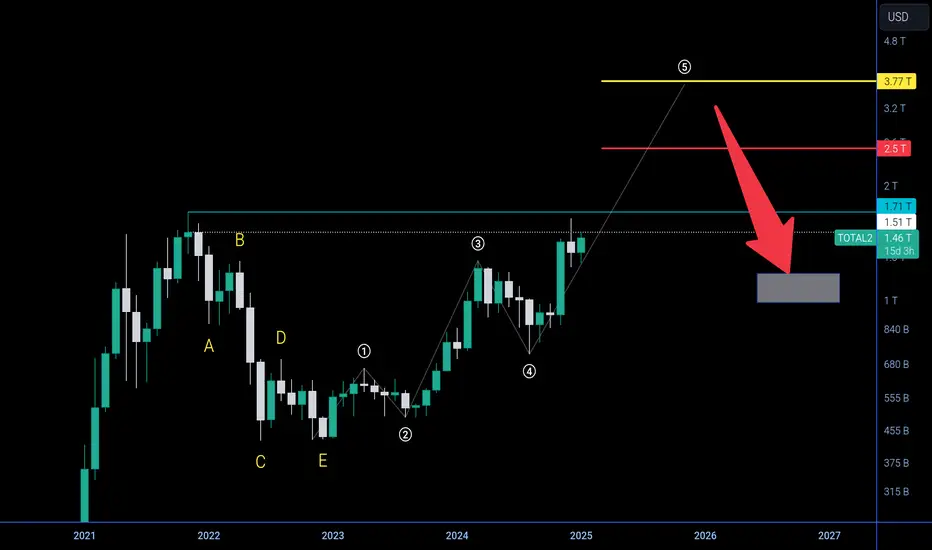
✅ Breakout Alert! Total2 has broken out from a cup and handle pattern on the weekly time frame and successfully retested it. This setup is a classic bullish signal, suggesting a strong rally could be on the horizon.
🚀 If this pattern plays out, altcoins could skyrocket! Be patient—your altcoin holdings may soon reward you in a big way.
⚠️ Invalidation Level
If Total2 closes below $1 Trillion on the weekly timeframe, the bullish outlook weakens. Until then, the upside potential remains strong!
💬 What’s Your Take?
Are we about to witness an altcoin explosion, or will BTC continue to dominate? Drop your thoughts in the comments! Let’s ride this market together and secure those gains! 💰🔥
TOTAL2 trade ideas

The elusive alt season... Is QE coming soon?The magical Alt season never seems to come. Most have thrown in the towel or lost all their money, which is a good sign the bottom is in.
The secret here is paying close attention to the FED's (FRED:WALCL) Quantitative tightening and easing.
Since the start in 2008, we have always either had QE or some sort of pause like you see in the 2016/17 bull run, but as soon as the FED flips to tightening, what happens? BTC pauses.
It is true that Bitcoin has performed very well during tightening cycles, as massive corporations like BlackRock and MicroStrategy are eating through the supply.
As for the altcoin market, it has been a bloodbath. One thing that’s clear to me is that altcoins need the FED to flip to QE in order to get things really going.
Going over the latest FED's Monetary Policy Report that came out yesterday, it hints that they are close to ending their tightening cycle and easing off a bit.
**WHICH IS HUGE NEWS!**
We can now see that this is true indeed because the red line is now starting to flatten out, just like in 2020 before the FED flipped to QE.
As far as the technicals go, the altcoin chart has now formed an ascending triangle and, for now, is still printing higher lows. 20 days left for this monthly candle to close.
If, let's say, this monthly candle breaks ATH and closes above it, it could signal the start of the alt season, and if history repeats, we’re looking at a run-up from March 2025 to September/October 2025.
So the next FOMC meeting from the FED is the most important of the year. Now that this report hints at the end of the tightening cycle, is it possible that at the next FOMC meeting on March 18th, 2025, they will announce the end of tightening and trigger the start of the alt season?
Pretty heavy upper wick for now on the BTC.D. It’s currently on the .702 retracement. Is this the top?
A chart I use a lot. Really want to see this monthly candle close back into this triangle.
**Alts/USDT.D**
This chart is one of the most important ones I’m looking at right now. Currently forming a bump-and-run reversal, and again, very bullish if we hold the neckline.
The USDT.D chart will always lead the way. It’s always one step ahead, never fails me. Until we see a break of this green support line, we won’t see ALT season. The bear flag pattern target is the same target as April 2021, which is interesting.
As I published on my ETH TA, if we close the weekly in this channel, it will be very bullish.
### Conclusion
I'm extremely bullish right now. Leverage has been reset, greed has been reset, and everyone is throwing in the towel. On social media, "it's over" talk is everywhere. This is the kind of depression I'm looking for to tell me it’s the start of ALT season and not the end.
**Invalidation of this thesis would be the following:**
- ETH closes weekly under the channel
- Bump-and-run reversal fails to hold the neckline
- FED does not flip to QE in the FOMC meeting on March 18th
If all these things happen, I will flip bearish. Until then, I'm extremely confident that this is the bottom, and you should go all out, lay all the cards down, take out loans, put all your chips on the table—it’s time to go hard or go home!

TOTAL2 may continue down 20%TOTAL2 broke the trendline and may be down more to its support line
It could be -20%, TOTAL2 include stablecoin, it means ETH may down 20-30%, mid cap 50-60%, small coin 80-90%

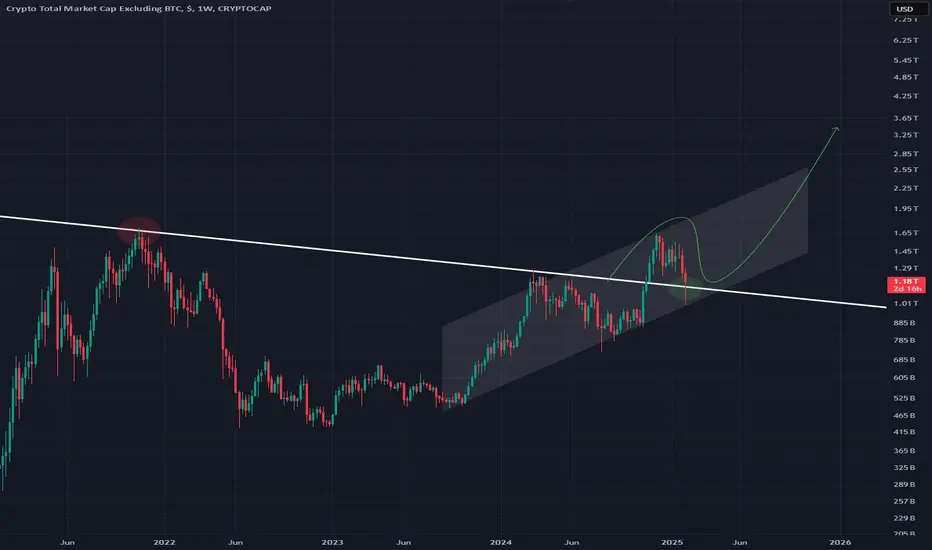
TOTAL2 - Support Found Above Down Trend Down trend in white has become a support level for price on this Weekly timeframe for this altcoin market
This is also within a small up channel forming
I expect further upward movement in the coming weeks
1T has a big support
Total alt coins If this support dont hold alt coins might re test recent lows . to the 1t support . Some alts got totally crused on the dip . I hold some cash and some eth now we will see if this support holds , long term i think the market will recover completly no reason why it will keep dipping if joe biden and gary gansler try to kill crypto and it survided now that trump and crypto czar are incharge there is no reason to be bearish long term. just an opinion

$TOTAL2 vs $USM2 RatioIn the crypto world many analysts watch the Money supply called M2 closely to determine the direction of the market. During the last crypto cycle, the CRYPTOCAP:TOTAL2 index (Crypto Market Cap without CRYPTOCAP:BTC ) hit an ATH when the M2 hit 21.75 Tn $. Since then, the M2 Money Supply has been trending down which resulted in a major bear market in the Alt Coin space.
If we look at the chart of CRYPTOCAP:TOTAL2 vs ECONOMICS:USM2 we see that the chart hit an ATH on Nov 21 with M2 peaking in March 22. The ratio chart hit a low on Jan 23 with M2 hitting the cycle low on Mar 23. Since then, the CRYPTOCAP:TOTAL2 vs ECONOMICS:USM2 has shown a steady recovery with an increased money supply. The current level of M2 is still below the peak of March 22. But with increasing M2 we can expect a bull run in the Alt coin market including $BTC. There have been recently some weaknesses in the chart on a short-term basis. Let’s see how the chart develops on a medium-to-long term. Until then watch out for this space. CRYPTOCAP:BTC CRYPTOCAP:TOTAL2 ECONOMICS:USM2

Beginning of Altseason.We are testing a support. Don't panic
When everyone says "no alt season" is time to buy. Altcoin rally in 3..2..1...

ALTCOIN SEASON called off? This chart is quite concerning Crypto Cap excluding CRYPTOCAP:BTC chart—essentially the total market cap of all altcoins, including CRYPTOCAP:ETH , CRYPTOCAP:XRP , and everything else except Bitcoin.
#
Another 3%-5% down, and our beloved (or most hated) altcoins will hit the Golden Pocket. Will this be the best time this year to load up before the inevitable "altseason"? Maybe.
Probably. Or maybe not—depending on the geopolitical situation, or rather, the geo-economic situation. Mr. President has decided to wage his trade war with most of the world.
I’m not going to pretend to know what’s going to happen tomorrow on that front. Maybe China retaliates with its own tariffs—nobody knows.
In my 12 years in crypto, I have never seen this level of uncertainty. This is madness. All I can do is sit here and analyze the impact off the charts.
The bullish pennant has been invalidated, and that pattern was supposed to give us explosive price action—to the upside. That’s canceled. Based on this chart and many others.
I still believe many cryptos will deliver fantastic returns this year. But a general altseason, where everything pumps?
Forget it. Those days are over. Selection of coins will be critical from now on.
That’s my thesis for the rest of the year. Not rushing into any more buying for now—heading to bed instead. Stay safe, folks, and maybe, just maybe, don’t throw any more of your funds into shitcoins. Most of them will die off, slowly but surely. 👽💙

TOTAL2 / BTC ALTS Should be Close to BottomingWho remembers this chart I posted a month ago on TOTAL2 / BTC ?
This was the one that TradingView shared of mine on 12/31/24
Called the double bottom here. My squiggles are undefeated.
Alts should be close to the end of bleeding.
One last flush I presume (hope) 😂


Total 2 alt season You might want to have a position on the alt coins by now . Las time it broke all time high tesistance it rally for the next three months . I am expecting this resistance to be taken out soon and the alt coins bull run can begin. some alt coins have rallied alot already but there could be more upside still . you might want to check coinmarketcap to see alt coins list and choose from .

Total Crypto Market Cap Excluding BTC The total cryptocurrency market cap, excluding Bitcoin, is poised for a significant surge in altcoins once it breaks out of this triangle pattern. Expect a substantial upward movement in altcoin prices following the breakout.

Total2 vs BTC Excluding Stable CoinsTotal2 vs BTC Excluding Stable Coins. BTC against the market ommitign stable coins

Total2 vs BTC Excluding Stable CoinsTotal2 vs BTC Excluding Stable Coins. BTC against the market ommitign stable coins

New era is going to startWe are going To test the previous ATH At 1.71T if we break the previous ATH Then we Are going to enter in new era My assumption is if we break the previous ATH then we will see The volume of 1 trillion more in it.

Altcoins Market: Poor Or Strong Performance?Really? Is the Altcoins market not doing good?
Is there really no action nor growth in our amazing market?
Do you agree with the people that are of this view?
What is considered good and what is considered bad?
Is it any good when a pair rises by 600%?
Is it good when a pair grows by 2,000%?
Is it bad when a pair corrects and removes all those gains?
Is it bad for the market to produce corrections after strong periods of growth?
Let's be honest and let's be fair.
We know the market and the charts by heart.
Of the standard set of Altcoins, the big and medium sized projects, we saw average growth between 300% to 600%. Many pairs reached 800% and even up to 1,000%. Most of the pairs produced a minimum of 180% to 220%.
Out of the less known projects, widely traded but still less known as the market is young; and this is between 2023 and 2024 for the entire market, standard growth happened between 1,000% to 2,000%. Hundreds of pairs grew between 2,000% and 4,000%. I showed you the proof.
Is this really not good?
This is before bull-market year.
—2021 was the previous bull-market top and peak.
—2022 was the bear-market; we all agree.
—2023 produced the initial bullish breakout and 2024 some growth and consolidation.
—2025, now, is the next bull-market. We can all agree.
How much does a pair need to grow to be considered good?
Is there anything else in the world where you can wait patiently and earn between 500% and 4,000% when the economy is bad.
Even from big projects, we saw 4,000%, 6,000% and even 8,000%. I will not mention them but we all know which pairs are these. I shared thousands of charts in the past few years and we can all agree.
So the market is doing great.
These gains are not sustained and they shouldn't be.
Why should they?
The market is young.
Everything is just starting. Only now we are removing the breaks.
Actually, not breaks, handcuff. The market was in prison, soon it is going free.
If we had such great growth in 2023 and 2024, literally between 5 and 40X per pair, imagine how much more the market can grow when we have the support of the law, financial institutions, giants and governments; this bull-market can be great.
Do not let anybody fool you, we are going up.
The Altcoins are ready to boom. It has been moving, but it is normal that growth is followed by corrections, it is just how a young market works.
As the market continues to grow and evolve, there will be less volatility; more stability, but also less opportunity for big gains. What is great for one group, for traders, this won't be so great.
We are still early.
We are still young.
Prepare for 10, 20, 40, 50X in the coming months.
Yes! We will have an Altcoins bull-market, Altcoins season, explosive growth.
Nothing can stop what is being built behind the scenes.
Nothing can stop innovation and progress.
Nothing can stop the expansion of the human Soul.
This is our life.
This is our market.
This is our game.
This is our playground.
This is our work.
We will make the market great and the market is set to grow. The proof is in the chart.
Patience is all that is needed; patience is the key.
Right before everything turns great, some people tend to give up and leave.
Not you, not me.
We here for the long-term.
We will enjoy the entire market. This one and the next to come.
We will support Crypto, you were made for us.
Thank you for your continued support.
I'll you see at the top.
Nothing can stop us.
We are on the right side of history.
"The cat is out of the bag." There is no going back.
Money is free now.
The money monopoly is over and this is something positive that affects positively the entire human race.
Look at the bright side... Your participation in this market not only helps you as an individual but it also helps all those that were left out in decades past.
Namaste.


Altcoin Supercycle Cheat Sheet.Trading Alt-coins is not easy. Often while waiting for them to reach their targets suddenly the hole market takes a dive before they get there.. or we sell them and they keep going much much higher leaving us behind in the dust.. So i came up with another approach trying to time the point where the hole market dives and sell them all together no matter where they are in their own individual cycles..
When to exit Alt-coins? This is my Crypto market-cap analysis and game-plan excluding Bitcoin.
The only tools i use for this prediction is the Fibonacci Extension tool and Tom Demark's TD sequence Indicator.
before i start i want to say that the big market cycle top is far far away in my opinion and I expect it to be around the 10.618 extension or higher which is at around 4.45 Trillion total market-cap. Basicly a 4x from where we are now.
But of course there will be up and downs like in every market and each time we reach another fib extension target i expect a decent dip worth trading.
Time-wise if we are going to make another TD 9 count on the 3 month chart the 9 would open on 1 July 2022 and close end of September 2022.
This analysis can be used as a roadmap which should help us to play each leg up to our advantage. Selling each leg up for bitcoin and buy back the correction multiplying our alt-coins towards the big top where we will sell it all for stable-coins and wait for the bear-market to do its thing again before buy in and rinse repeat.
That said let's get to it.
The recent 2 small cycle-tops have been made at the 1.618 with 696 Billion and the second one with 1.1 trillion at the 2.618 Fibonacci extension. Meaning we had small cycle tops already and have 8 more to go from here if my 10 cycle theory is going to play out.
Why 10 tops? I can not explain you why but i can teach you a secret i found with the 10.618. I have backtested this on multiple assets and it seems there is something about it that does work. It is basicly free money if you learn to play this. You should try it out yourself by backtesting it on your favourite assets and you might make fantastic finds and possibly life-changing gains in the future ahead just by knowing this secret which is a great help to know when to get out. this 10.618 can also be applied on smaller timeframes and can be of great help for every trader.
If you manage to do well based on my teachings please gimme a shoutout. It would make me very happy knowing i have helped someone reach financial freedom.
lets continue:
I decided to publish the idea in the 3 month time frame in order to cut out most of the noise. You can see that we have reached a green TD 9 count on the 3 month chart in January 2018 which was the 1st ever market-cycle top in alt-coins.
the indicator is not counting 1-9 properly after the top and i could not find one that does it right. So i placed a text-box with the red numbers so you can see that there was basicly 9 chaotic candles after the green 9. you will notice that after the chaotic 9 it started a new green count which currently prints a green 4.
so currently we are on a green TD 4 suggesting we should have over 1 year of upside before we reach the green 9 and possibly the big market cycle top by end of September 2022.
now lets get to the point. what do we do from here?
the next obvious target is the 3.618 at 1.5 Trillion USD
The game-plan is to sell all alt-coins when we reach the next Fibonacci target and move either into bitcoin.
In my opinion the best would trading versus BTC and only move into stable-coins once we have reached the Big cycle top.
So each time we reach one of these Fib lines we must make sure we exit all alt-coins into bitcoin even if they have not reached their own targets.
Once a small cycle top is in and we start to dip we then can draw a Fibonacci retracement on our alt-coins we wish to buy back lower and layer our bids for buy back between the 618 and 786 fibonacci.
then we wait for the next Fib in this case the 4.618 target at 1.91 Trillion and so forth.. etc.. Rinse repeat.
i will update this Idea with more detailed small timeframe charts all the way until the big market-cycle top reminding you when to get out and when to get back in.
To not miss any updates and alt-coin ideas please follow me here on Tradingview.
Then you are all set for the super-cycle alt-coin run and all you need to do is to watch out for the signals and enjoy the ride/gains.
Not financial advice.
please like if you enjoyed this and feel free to ask or comment.
follow to learn more.
ps: if you like reading trading books I do recommend you to read the book about Tom Demark's TD sequential.

#ALTSEASON is coming. Patience !!!If you think your altcoins will never pump and plan to give up, look at this chart! You have to be aligned with the right ones.
We're far from over!
Just a small message, observe the chart, everything is given in the chart.
Do hit that like button and share your views in the comment section.
Thank you
#PEACE

Total2 Market Cap vs BTC Market CapToday we are looking at ratio charts. We plot the ratio of Total 2 Market Cap (Total Crypto Market Cap excluding BTC) to BTC Market CAP. This ratio chart is making new lower highs this BTC Halving cycle. There seems to be no bounce from the lows and Alt coin season seems to be elusive. As we move towards the end of the halving cycle there is very little time left for this Alt season. To reach the previous cycle highs of 1.5 in the chart the Alt Coins have to more than double from here and BTC must remain at this price for the rest of the cycle. For this the total Crypto market cap must reach almost 5 trillion USD, which remains unlikely. A better estimate will be the ratio of Total 2 Market Cap vs BTC Market Cap ratio reaches 1.09 which will be 0.618 Fib retracement level. This 0.618 fib retracement repeats in many instances. The same is true for BTC.D. What do you think?

When ETH season?TOTAL2/TOTAL3
$Altseason will happen only after pumping CRYPTOCAP:ETH against ALTS, BTC season phase is coming to an end, yes CRYPTOCAP:ETH season will start soon.

Total market cap 2 - macro analysis ( expect $BTCUSD ) Hi 👋🏻 it's me your " Raj_crypt0 " is back 🔙 🎩
CRYPTOCAP:TOTAL2 ( TOTALMAKETCAP2 ) crypto long run analysis ⏰ was here ..... ❣️
" It's important to close strong monthly above $1.71T " which makes bullish road clear "
🎯 ¹ - $2.5T ( 2.5 trilion dollars )
( When $2.5T was done before APRIL 2025 then , we aim for target 2 , if not it will turn as TOP 🔝 )
🎯 ² - $3.77T ( expecting potential TOP around 4 trillion dollar 💰 )
•
Note >>
don't think 🤔 all coins will complete " BULL RUN " 🔝 target's at index TOP 🎩
It depends on currency some complete " BULL RUN " at 1st target 🎯 some complete 💯 at 2nd target 🎯 INDEX ☝🏻 always show way to get exit and entry on entire portfolio 💰
( Yes 🙌🏻 i provided even " BEAR RUN " target 🎯 also but we can discuss later based on 🔝 )