Total 2 ChartWe are at the weekly support zone and got a beautiful green hammer candle. Im expecting the market to consolidate here for a while as it is testing the previous resistance which is now our support and continue to push back up.
If market gives us another dip we can comfortably enter the market.
DYOR
Goodluck
TOTAL2 trade ideas

Fate of altcoin maket If you look at CRYPTOCAP:BTC.D you can notice that what we called "start of altcoin market" was merely 3 week BTC dominance retrace and when true altcoin market starts, you will notice it by very fast change of narrative and rapid altcoin market growth.
Anyway, I suppose that movements of Altcoin market capitalization will follow some sort of Elliot waves pattern (something like that).
However this altcoin cycle may happen in a very different nature and mostly will be comprised of memecoins, so your old altcoin bought 4 years ago might stay worthless regardless of the altcoin bullish market

Two Months: Basic Trading Strategy (2025 Bull-Market)Is two months a long time? Just two months and the market will be booming again... This is great.
Good evening my fellow Cryptocurrency trader, the market is preparing itself to show us something great.
The next bullish wave is not already here but it is in the making. It will take two months.
We get the correction low followed by one last shakeout, which can end as a lower low for some pairs or a higher low for some others, and then we see growth.
The drop is already in.
The correction is already in but it takes time for the next bull-market wave to unravel. It can take two months.
This is great because it gives us time to prepare.
We have enough time to make the right choices and prepare a plan.
We have a preview with the previous bullish wave. We can analyze what we did right and what we did wrong so that we can do better in the next phase.
We get a new low and some consolidation, then prices start to grow. At first, this growth seems slow but surely after two months everything speeds up. Some pairs will be breaking up strong while some others will remain at the bottom, when three months are in, after reading this, we can see marketwide bullish action.
The upsurge starts but it can take weeks and sometimes months to reach the last high for those that produced a strong correction. After the last high is hit, a new bullish marketwide bullish phase starts.
Everything will grow but not everything will grow.
Everything is growing but not everything is growing.
The market is growing but choosing wisely is the most important decision we have to make. Both choosing and the right mindset.
You can choose a pair that is going to grow 800% but it does so after 8 months. Imagine holding the pair for 6 months and then giving up. The choice was right but the mindset was wrong. This can happen.
To avoid this type of situation we plan long-term and use diversification. Instead of putting 100% into a single pair we do 5% on 20 different pairs, or 10% on 10 different pairs.
10% of the whole capital can go for high risk trading, while 70% can go for long-term hold spot. The remaining 20% can be "cash" for in-the-moment opportunities... Just some examples, remember, we have to adapt to our lifestyle and goals.
How I approach the market and what works for me might not work for you.
We cannot jump in blank, we have to know what we want to get from the market before-hand.
Even just thinking of how long are you ready to wait can make a difference vs going in blindly because we see strong growth on a pair.
Set it and forget.
Think of the previous bullish wave.
Those that earned the most were those that bought in August and September 2024. Those buying in November and December, some earned just a little and some even ended with a loss.
Patience is key.
Timing is important.
Thanks a lot for your continued support.
Namaste.

Same 'CORRECTION' happened in 2020 Do you all notice how at the exact same time on 21 december 2020 we had a weekly candle of 25 procent correction? yes because we shake the weak hands out with leverage in order to provide room towards the upside.
Leave a like and a follow much appreciated!

The MONSTER of all pendants for 2028This is the most powerful bullish pendant for Alts, as profitable as the golden times in crypto

#Altcoins Q4 2020 x Q4 2024#Alts market cap TOTAL2 After making a major rise after the US elections in November 2020, it made a major correction towards mid-December and started a parabolic run after being rejected from the ($177.8B) Fibonacci 0.5 support.
Altcoins, which made a major rise after the US elections in November 2024, started a major correction phase in mid-December,
It will not be surprising if the correction ($1.19T) continues up to the Fibonacci 0.5 level and starts moving upwards from the current level.

Altcoins season has not even started!As you can see we are in the same spot that last cycle. BTC running avove previous ATH and total2 still bellow previous top. Once btc gets close to the top altcoins are going to explode, see how LMACD of Total 2 is not even close to the top of the descending diagonal. Scoop some alts now, next 12 months should be bright.

This Season is Different....Seriously, no "crypto guru" i've found mentions how BTC.D started high AND DIVED at the start of a btc-then-alt-season run.... NONE... meanwhile this season BTC.D and BTC only keep up with eachother...
What is different about this cycle?
My thoughts: institutions are heavily involved THIS RUN... they bought in during the bear season. They know how to **** most traders out. Thats what we have here...
They are coming for all these previous success story DEGEN's and their money.
Don't be next.
PS: im invested and DONT hope for what I'm seeing... IDK.

ALTS aiming for an explosive rally.The Crypto Total Market Cap (excluding Bitcoin) has a red 1week candle last week after 5 straight green ones.
This is the first consolidation that all Altcoin Cycles had in December-January months of Halving years, following the breakout over the mid Cycle bull flag.
This is the time to buy heavily into altcoins.
The expected cap for this Cycle is 11 Trillion, which is the 5.0 Fibonacci extension (2.0 Fibs lower than the previous Cycle, which in turn was 2.0 Fibs lower than the one before).
Previous chart:
Follow us, like the idea and leave a comment below!!

TOTAL2 This is a personal opinion, in my opinion we should expect altcoins to fall by 40-70%, it depends on the project, so let's act smart, if you invest in altcoins, reduce the risk and save your profits and wait for the fall.Because we have reached a ceiling, the probability of this ceiling breaking is very low.

TOTAL2 - Big VolumeThe volume on the altcoin market is massive
a lot is being bought up
Expect price up to follow
Weekly timeframe

TOTAL2#TOTAL2
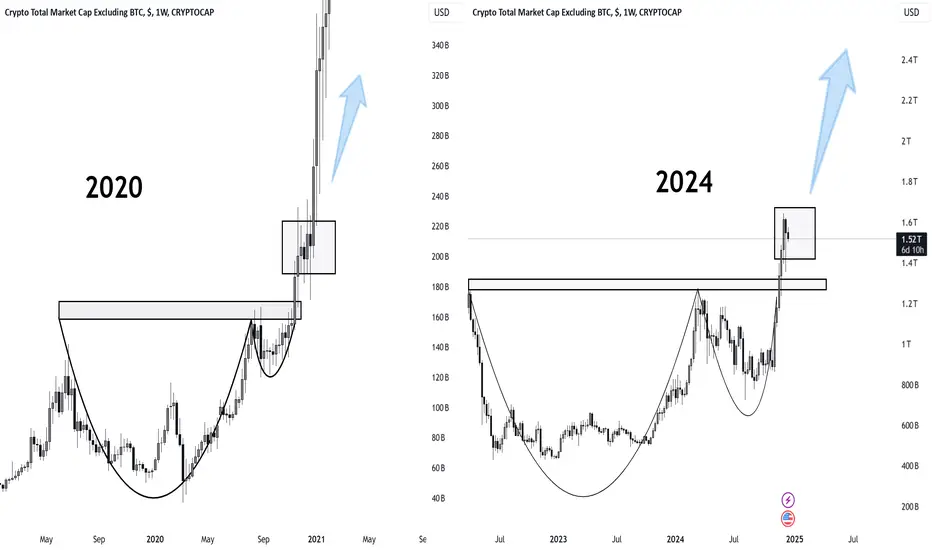
Powerful altseason in 2020 emerged after formed cup & handle pattern and pinbar above the broken neckline🤔
In 2024 we have similar pattern with pinbar formed this week👨💻
Altseason from tomorrow?👀
Total 2 Altcoin Marketcap Total 2 AltCoin ~ 1W
#Altcoin Season Super Cycle will start after this resistance block is successfully penetrated. you will see a super cycle increase in AltCoin.

BIGGEST ALTCOIN RECAP FOR 2024We give glory to God Almighty for the gift of life and good health. As the year 2024 draws to a close, it's the perfect time to prepare our altcoin recap and reflect on the progress we've made.
A big shoutout to TradingView for providing this incredible platform that empowers traders to learn, share, and grow together. Thank you, TradingView, for all you do!
This post is dedicated to reviewing and revisiting all the altcoin requests submitted throughout the year, from January to December. The goal is to ensure clarity and provide updated insights as we wrap up the year and prepare for BIGGEST ALT SEASON 2025.
Links to the analyses can be found here:
December:
November:
October:
September:
August:
July:
June:
May:
April:
March:
February:
January:
Here’s how it works:
Visit any of my previous posts and locate the analysis of the altcoin you’re interested in. Copy the link to that analysis and paste it here in the comments, along with your specific question or request. Your questions can include:
Requesting an update to the existing analysis.
Asking for a fresh analysis from scratch.
Let’s dive in and collaboratively complete our final recap of 2024 altcoin analyses. This is a chance to refine strategies and prepare for the opportunities ahead.
Share your requests, and let’s get to work!

ALTS Market Cap Chart AnalysisThe ALTS market cap has broken out of a descending broadening wedge, triggering a strong bullish rally. However, it is facing resistance at a key horizontal supply zone.
The Ichimoku Cloud shows strong bullish momentum, indicating the possibility of a continued upward move. A decisive breakout above this resistance level could trigger a significant rally, further strengthening the upward trajectory of the ALTS market.
For updates on other coins or personalized insights, feel free to reach out to DM.
@Peter_CSAdmin

Altcoin 2025 bullrun cycleI think it is no secret to everybody that Bitcoin and Altcoins (including ETH) are very much correlated. But they do have a certain lag in impulses.
On the chart you can see altcoin market cap vs Bitcoin market cap (High values). As you can cee, Bitcoin had a new All time high which is ~53% higher than the previous one, while altcoins didn't manage to break the Total market cap ATH. But percentages are not the only thing interesting to us. We are also interested in the dollar delta between them and which one is higher.
We only have two major bullish cycles to analyze, therefore any conclusions made frome them may not guarantee that next bull run will be similar.
First thing I could notice is that capital flows as follows: new money coming into market first boosts bitcoin and when it goes into its parabolic growth state, Bitcoin market cap is higher than that of Altcoins. And as you can see on the chart, when altoin market cap surpasses bitcoin, it means that most likely that capital inflow into crypto slows down. And most likely it signals near beginning of an overall bear market. I think we should closely monitor this and be ready to start selling when the two lines close once again.
Another point of view is the next ATH for both bitcoin and Atlcoins. As I predict in , for bitcoin the next ATH will be around 115-200k and therefore mcap will reach around 3-4 trln.
This means that ATH for altcoin mcap will be around 4-5 trln and be ready when CRYPTOCAP:BTC.D becomes lower than 50%.
Let's see how this turns out.
And by the way total mcap doesn't define each altcoin growth so each coin needs to be analyzed separately.

Alt coins So on the daily the Macd is bearish right at the 0.61% retrace from the recent lows . I don’t know if it will recover completely but if bulls can keep the momentum it can flip to bullish as of now can go either way a retest of lows or recent highs . Keeping some cash on the sidelines just in case

Is a massive correction for alt tokens about to print?This is a short term forecast affecting anything inside the TOTAL2 market cap. That is the entire crypto market excluding Bitcoin.
The crash is forecast to occur over the next 14-20 days.
In four days from now a “life cross” will print on the above daily chart, it is inevitable.
What is a life cross?
It is when the 50 day simple moving average (blue line) crosses up the 200 day simple moving average (red line)
AND
Price action is above the 200 day simple moving average.
The majority of market participants see this as a positive sign. A green light to enter long positions. However for you lucky what is it now wow 14,000 followers (thank you!), you’ll now know it is not what it seems. Like me you're scientific about all this and look left.
But before we look left, I want you memorise how far TOTAL2 market capital is above the 200 day SMA, about 30%
November 12th, 2023 life cross -10% correction
Price action was 20% above the 200 day SMA
February 18th, 2023 life cross -15% correction
Price action was 15% above the 200 day SMA
February 2020 and May 2020, -70% and -17% corrections
Price action was 57% and 20% above the 200 day sma
April 13th, 2019. Life cross -23% correction
Price action was 34% above the 200 day sma
In summary, the further price action was above the 200 day SMA the harder it dropped.
We can infer that a 15-20% correction should be expected across TOTAL2.
Use this low as an opportunity to collect your favourite token from emotional sellers.
Ww

Total2 alt coins So this dip cought me with my pants down . was expecting a small retrace but 15% is a lot . Going long at the 0.61% retrace also rsi is oversold I think its hard to time the bottom for every correction so 50% long here the rest if it dips lower

Total2 simple tools, nice forecast so farUsed simple tool since interception, all levels achieved in time in price the time is approaching to take off

TOTAL2 - Current Rejection and Following BreakoutRejection is occurring at the red dotted horizontal line which is the prior ATH for TOTAL2.
I think this rejection will be short lived and price will recover at the green circle and continue the bull run into mid Feb
The larger triangle structure shows this breakout
Pullback then bulls take control again

TOTAL2 - Fib and Channel Support0.786 fib shows a strong support point with prices continually being rejected to the bullish side
As price has dumped to this level I ask will this bump back up again as it has in the past?
This dump can also be plotted in with a long channel of the bull run we have been having, showing support at the bottom of the channel.
I'm still bullish over this temporary retrace

Total 2 chart updateAfter hitting the resistance we are making a correction and the zone of 1.2T - 1.21T can be our first entry.
DYOR
Goodluck
