$2.69 trillion will be Altcoin Mcap 0_oTRUST ME, BRO! Look how geometrically beautiful my drawings are!
TOTAL2 trade ideas

Total 2 chartAs predicted in the previous analysis we reached the resistance on Total 2 chart and now going for a correction if BTC goes down (which is mkre likely).


TOTAL2 MARKETCAP ALTCOINTOTAL 2 ~ 1W
#Altcoin season it's still very early. Don't say you sold your AltCoins for only a small profit.
AltCoin's MarketCap is around $2T - $3.5T, Currently around $1.61T.

Total 2 alt coins So on the weekly timeframe total 2 alt coins resistance is previous all time high . around the 1.60 trillion . rsi on the daily is 83 most of the alt coins rsi is very overbought still , wont be surprised if a pull back happens this weekend . Will keep watching to see it does pulls back as of now it can go either way but am leaning towards a small retrace

#Altcoins super cycle has just begun!#Bitcoin dominance monthly rising wedge breakout and breakdown completed!
#Alts market capitalization OTHER TOTAL3 AND TOTAL2 The breaking and closing of the handle cup formation that formed on a monthly basis has been completed.
We are moving towards #Altseason in an environment of Denial and Disbelief!

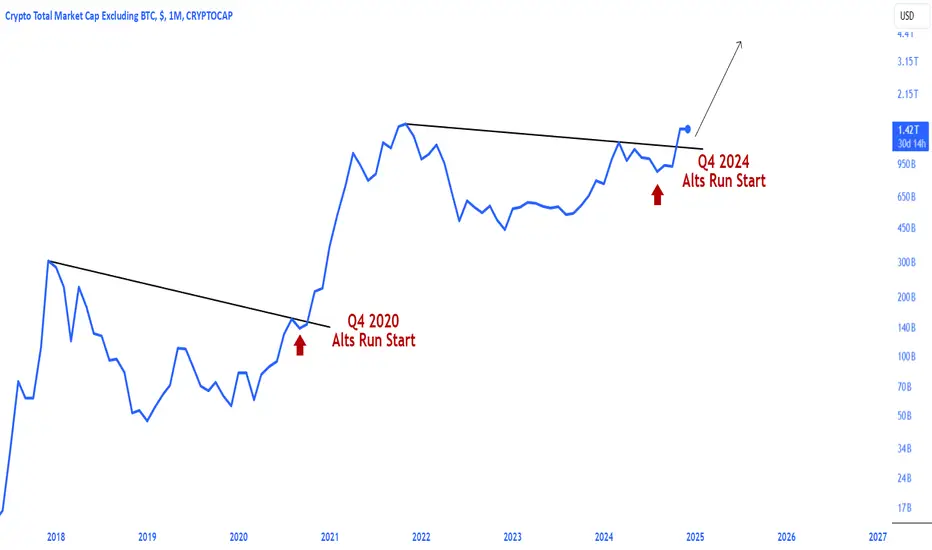
Biggest #Altseason coming!The alts market total of total2 The mega Altseason process, which started in November 2020, has started again as of November 2024.
#Alts parabolic run started in November!

Total 2 With Total 2 chart breaking the cup and handle and its first resistance now we are getting close to the major resistance on this chart. I expect a pullback and then continuing the uptrend.
Also check my ideas in my profile about USDT.D and Total charts for better understanding.
DYOR
Goodluck

ALT SEASON ABOUT TO EXPLODEThis is the point in the last bull cycle when ALTS
market cap passed the prev ATH from the 2017 Top.
triggering an ALT SEASON. YOU CAN SEE THIS IS ABOUT TO HAPPEN.

Total Crypto Market Cap Excluding BTCRIGHT NOW we are approaching ATH in the total Crypto Market Cap excluding BTC. This means, an alt coin season its imminent, as you can see in the charts, It projects the total alts market cap will reach 3.8 trillion. I predict to be even higher, more than 5. Time will tell. Buckle Up, this is now commencing. Congratulations, this is one is for the books.

#Altcoins 2024-2025 to VALHALLA!We are moving from the 2017-2021 Mega bull phase to the bigger 2025 #Altseason phase!
#Alts epic rise will continue!

A Look Again At RSI The RSI is beginning to print very bullish horizontal movement that is the print of a bull market
The left hand side of this pattern is already printed, with the white vertical line being the middle of the pattern, now what is emerging is the right hand side of this larger structural pattern on the RSI, also indicative of a bull market.
Early 2025 is going to be very bullish.
Little white circle is where we are now corresponding to the last pattern if they evolve relatively the same.

(Total2-USDT-USDC)/(USDT+USDC) indicatorLet's chart the
Ratio: (Total 2 - (USDT + USDC)) / (USDT + USDC)
This indicator currently shows an increased liquidity coming to alt market.
Total 2: This is the total market cap of all cryptocurrencies except Bitcoin. This essentially gives you an idea of the market size for altcoins.
USDT + USDC: Represents the combined market cap of Tether and USD Coin, which are used as liquidity providers in exchanges, especially in pairs involving altcoins.
Explanation:
Numerator (Total 2 - (USDT + USDC)): This is the market cap of all altcoins minus the market cap of the two major stablecoins. This figure could represent the liquidity in the altcoin market that isn't tied up in these stablecoins. If this number is higher, it might suggest there's more market cap in altcoins available for liquidity and trading activities outside what's held in these stablecoins.
Denominator (USDT + USDC): This is the total liquidity provided by these stablecoins, which is often used for trading because stablecoins maintain a relatively constant value compared to volatile cryptocurrencies.
The Ratio: What this ratio is attempting to measure is the relationship between the liquidity available for altcoins relative to the liquidity provided by these stablecoins. A higher ratio might imply:
Liquidity Conditions: In a bull market, if this ratio grows, it might indicate that there's sufficient liquidity to support further growth in altcoin prices. Conversely, if this ratio decreases, it might mean that liquidity is tightening, or traders are moving more into stablecoins, possibly out of caution or to prepare for market downturns.

Analysis of TOTAL2 TargetsAs we can see, the overall trend is bullish. After breaking the March high, the only remaining step for the market to truly thrive is to break the most recent peak and form a new high. There is only one direction now: upward.
The potential paths for this upward movement are as follows:
Scenario 1:
A pullback to the 1.27T level followed by a strong continuation to the upside.
Scenario 2:
A direct upward move without any significant correction.
Potential Milestones After Breaking the All-Time High:
2.11T
3.57T
11T (final target)
The market is showing promising signs of strength, and these key levels could be the focus for the next phases of growth.
Let’s keep a close eye on price action and prepare for what’s coming!

Total 2 alt coins The party is about to start for the alt coins . November was bullish ,momentum will be carry on to this month very strong. last time the resistance got taken out alts rally to all time highs . I think this month it will do the same but gradually there is no reason to be bearish in December , under trump there is no reason to be bearish doesn’t mean the markets will keep going up for ever but now is not the time to short the market . Best strategy is buy the dips until the bull run is over . I think total 2 hits 2.5 trillion once the resistance is taken out . Looking forward for alts to keep growing.

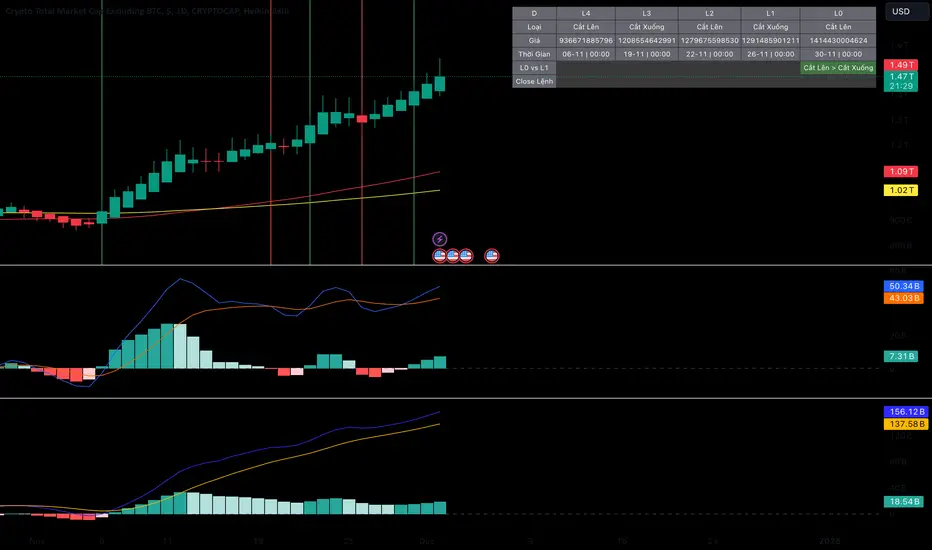
The next 3-4 weeks are expected to be the time for AltcoinsToday, we will analyze the relationship between Total 2 and BTC.D to strategize whether to hold onto altcoins or take profits.
First, BTC.D is undergoing a correction spanning from the daily (D1) to the weekly (W) timeframe and currently stabilizing within the monthly (M) timeframe (December candlestick). This correction is expected to last 4-6 weeks (personal estimate), during which BTC’s market dominance will decrease, leading to slight value declines. The extent of this decrease will depend on TOTAL.
Second, TOTAL 2 is showing a strong bullish cycle across daily (D1), weekly (W), and monthly (M) timeframes (as seen in the chart). This indicates that the coming weeks will be a highly active period for altcoins, especially those exhibiting robust upward structures on the W and M frames.
Feel free to comment if you'd like to receive a curated list of altcoins selected by BOT RAINBOW.
Crypto Total Market Cap (Excluding BTC) Weekly Chart Analysis
The chart reveals a multi-year symmetrical triangle pattern, with a decisive breakout above the resistance trendline. This signals a potential shift toward sustained bullish momentum.
The breakout aligns with increased market activity (volume not visible but inferred), indicating robust participation and validation of the upward move.
The price action is comfortably above the weekly 50 EMA (yellow line), acting as a dynamic support and confirming the strength of the bullish trend.
$1.39T (previous resistance now flipped into support).
Minimal resistance ahead until the psychological $2T zone, with the potential for all-time highs.
If the breakout holds, the measured move from the triangle's base suggests a target range of $2.5T—$3 T, marking substantial upside potential.
Continued consolidation or retest above $1.39T could trigger an extended altcoin rally, propelling the market to new highs.
Bearish Scenario:
Failure to sustain above $1.39T might lead to a retrace within the triangle, stalling bullish momentum.
Disclaimer: This analysis is for informational purposes and is not financial advice. Always stay updated with market movements and adjust your trading strategies as needed.
You can DM us for information on any other coin.
@Peter_CSAdmin


#Alts run begins as of Q4 2024!Altcoins bull started in Q4 2020 is programmed as of Q4 2024
#Altcoins will continue explode to break out hard!
TOTAL 2 - CLOSURE ABOVE $1.42T - CryptoManiac101TOTAL 2 Market Cap
We closed above the prior 2021 resistance level today. Pools upon pools of liquidity are about to be unlocked, sending this market through the stratosphere.
May you be here to witness it all.
This is for entertainment purposes only and not a financial advice.

#Altseason will melt all faces!#Altcoin will leave the 2016-2017 season behind!
#Alts will continue to create new millionaires!

Stop Thinking Backwards: The True Power of Cryptocurrency We’ve got to change how we see crypto. Too many people treat it as just a way to "cash out" into fiat money—like taking a step forward just to go backward! 💸
Cryptocurrency isn’t here to build the old system. It’s here to create a new one. Think about it: every time someone invests in crypto and then exchanges it back for dollars, they’re missing the point. Crypto’s value isn’t just its price in fiat—it’s in its utility and ecosystem. 🛠️
Adoption and Utility are what make crypto thrive:
When businesses start accepting tokens like XRP directly, we’ll no longer need to convert back to dollars. Imagine paying rent, buying groceries, or even getting paid in crypto!
The more we hold and use tokens within the ecosystem, the stronger it becomes. It’s about building a future where crypto isn’t just an investment—it’s a lifestyle.
💡 Crypto’s potential depends on us:
✅ Governments supporting and understanding its role.
✅ Businesses adopting tokens for real-world use.
✅ Education to shift the mindset from "get rich quick" to "build something lasting."
So, next time you think about cashing out, ask yourself: are you helping build the future, or are you holding onto the past? 🌟

Total 2 marketcap Total market cap of alt coins excluding btc is at resistance at 1.38 trillion since the 24th I know that every coin should be looked independently but sometimes if the market falls as a whole the coins all fallow . If we can clear 1.38 alts coins will continue to grow . As of now they could get a small retrace but looking forward for this resistance to be taken out soon
