Total3 – Back Above 1T, but Will It Offer a Second Chance?📈 What happened since April?
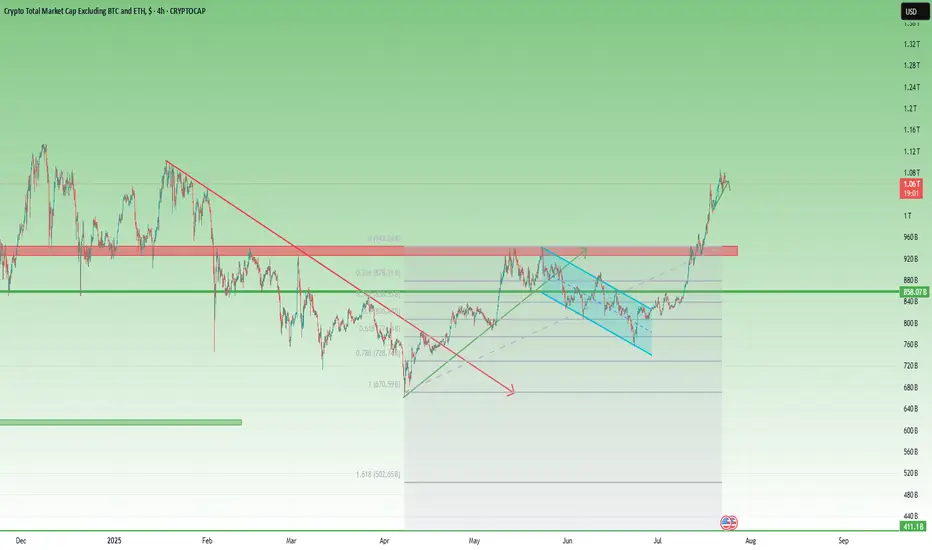
After the sharp low in early April, Total3 began to recover steadily.
Toward the end of the month, it broke above the falling trendline that had been holding since January — a key technical shift.
This triggered a strong recovery rally, pushing total altcoin capitalization (excluding BTC & ETH) to the 930–940B resistance zone.
📉 Then came the pullback…
Price printed a double top near resistance, followed by a drop — but not a bearish one.
Instead, the correction was orderly, forming a bullish flag, with the low landing right on the 61.8% Fibonacci retracement. Classic healthy structure.
🚀 The latest breakout
Earlier this month, Total3 launched a very impulsive leg up, reclaiming the 1 trillion level with strength.
At the time of writing, we’re trading back above 1T, and momentum remains on the bulls’ side.
However, the chart does look a bit overextended in the short term, suggesting a correction could follow soon.
🧭 Trading Plan – Will We Get a Retest?
The textbook play would be to wait for a deep pullback toward previous support levels.
BUT – I don’t believe we’ll get a full retest of the breakout. Altcoins may stay elevated or correct only modestly.
Instead, I’ll be watching the 1T zone and slightly below — that’s where I’ll look to load up on interesting altcoins.
📌 Conclusion:
Total3 has broken structure, reclaimed key levels, and is showing classic bullish continuation behavior.
The market may not offer you the perfect entry — but small dips near 1T could be all we get before another move higher. 🚀
Be prepared. Don’t wait for perfection in a market because rarely gives it.
TOTAL3 trade ideas
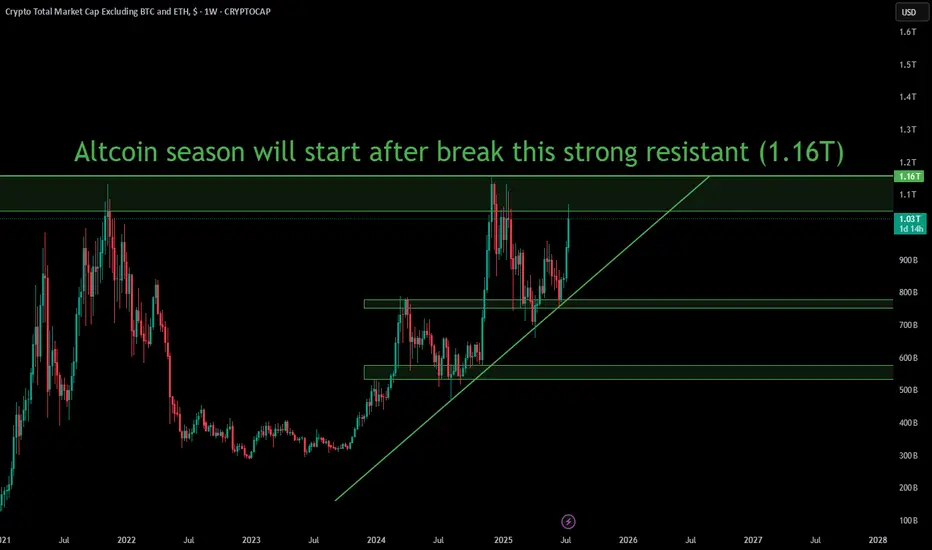
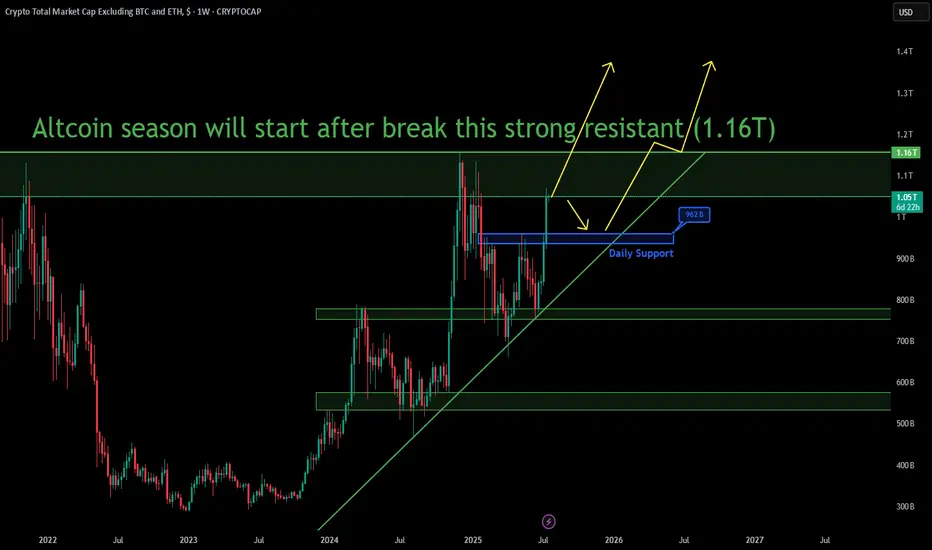
Altseason Bomb Start After $1.16T ? (VERY SOON!)📊 Altcoin Market Cap (TOTAL3) Analysis
Currently, we are approaching a strong resistance zone at $1.16 Trillion. As shown on the chart, this level has acted as a major rejection point in the past, causing significant pullbacks.
✅ If we get a clear weekly candle close above this resistance, we can expect the Altcoin Season to officially begin 🚀.
✅ The market structure is bullish with a clear uptrend line holding since early 2024, adding more confidence to the potential breakout.
📌 Summary: This is a key level to watch closely — breaking above $1.16T could trigger a major rally across the altcoin market, with fresh liquidity entering the space.
💬 What’s your opinion? Will we break this resistance or see another rejection before the breakout?
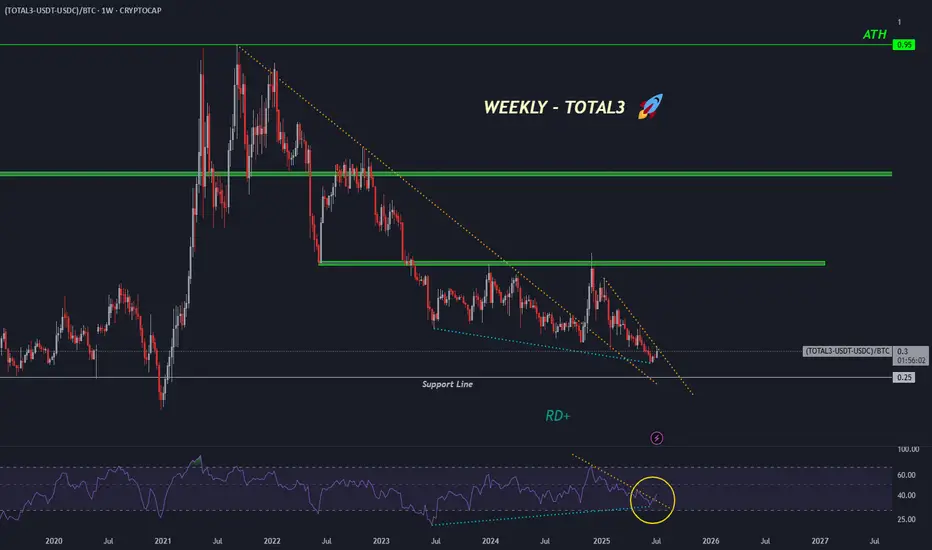
ALtseason-2025: where to exit?I have 2 metrics when I'm going to exit the market (with my profit):
1. When BTC.D falls to 40%;
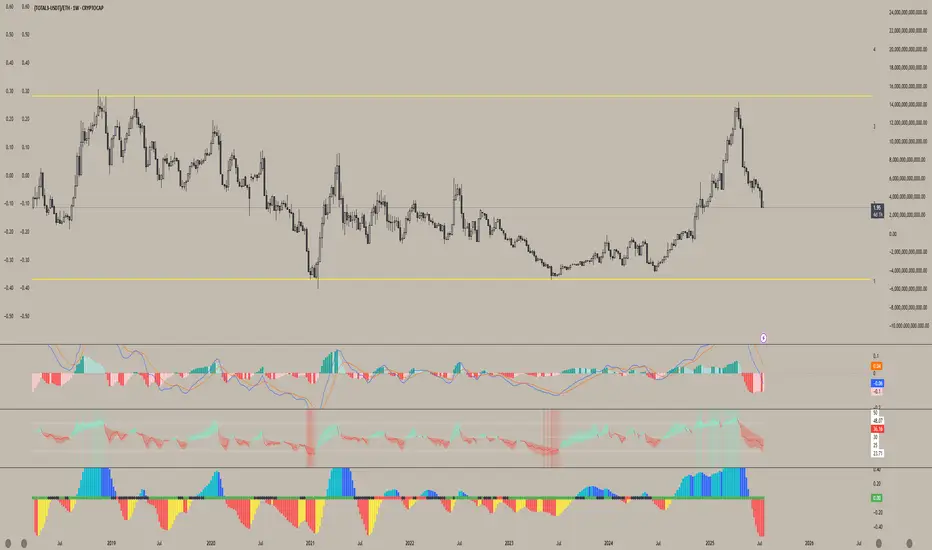
2. When (Total3-USDT)/BTC = 1, in other words, when the amount of money in the altcoins is almost equal to the amount of money in Bitcoin and Ethereum.
When you see it happen, sell everything and exit the crypto market.

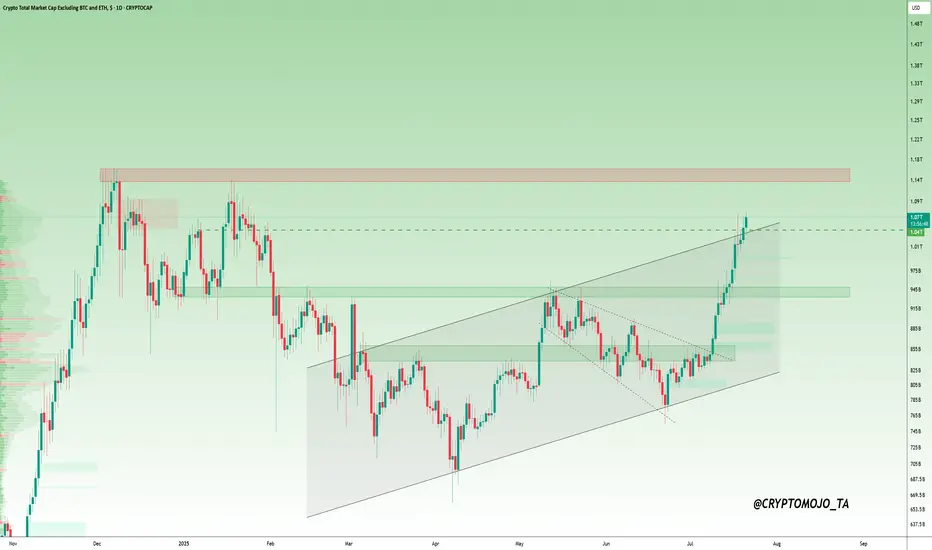
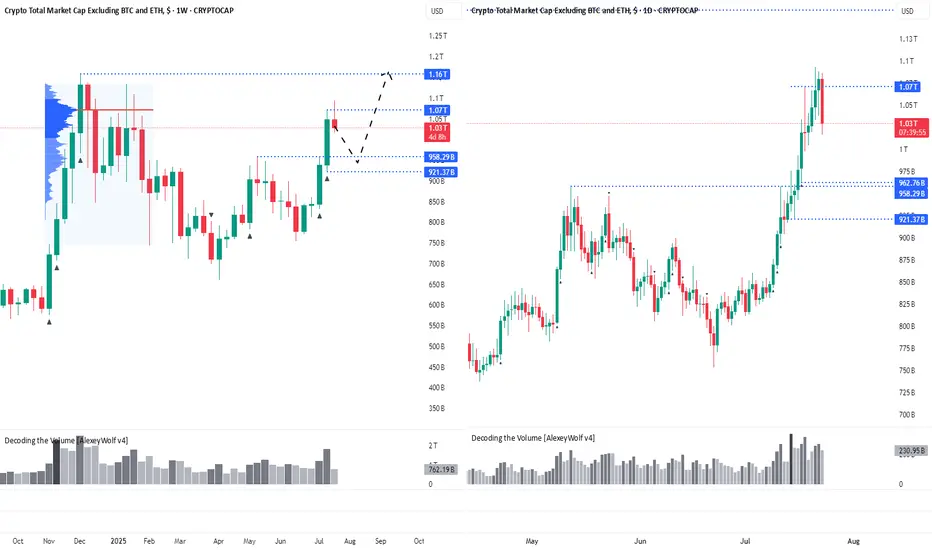
Altcoin Market at a Make-or-Break Moment!TOTAL3 Update (Altcoin Market Cap)
The altcoin market has just moved above the $1.05T mark. If this level holds, we could see momentum push us toward the $1.14T resistance zone.
But if it fails to sustain, a drop back to $964B or even $850B is possible.
This is a key moment for alts.
The next move will decide whether the rally continues or pauses for a reset.
#Altseason2025
Total3 - short term noteslooks like 920 or 970B should be a turning point if it is a correction in the following times.
not financial advices, my notes for myself

Altcoin Correction Scenario: Where to Look for EntriesHi traders and investors!
The market capitalization of Total3 has reached $1.07 trillion, marking the first major target for the altcoin market.
This level corresponds to the Point of Control (POC) from the previous bullish rally and the subsequent correction — a key area of traded volume and market interest.
Several factors now suggest the potential for a continued move higher. On the fundamental side, the recent signing of a pro-crypto bill by Donald Trump has boosted overall sentiment in the digital asset space, especially among altcoins. From a technical perspective, many leading altcoins are showing bullish continuation patterns.
Ideally, if the altcoin market corrects its capitalization (Total3) into the 963B–921B range, it would be a good zone to look for buying opportunities with the target of renewing the capitalization ATH.
Wishing you profitable trades!
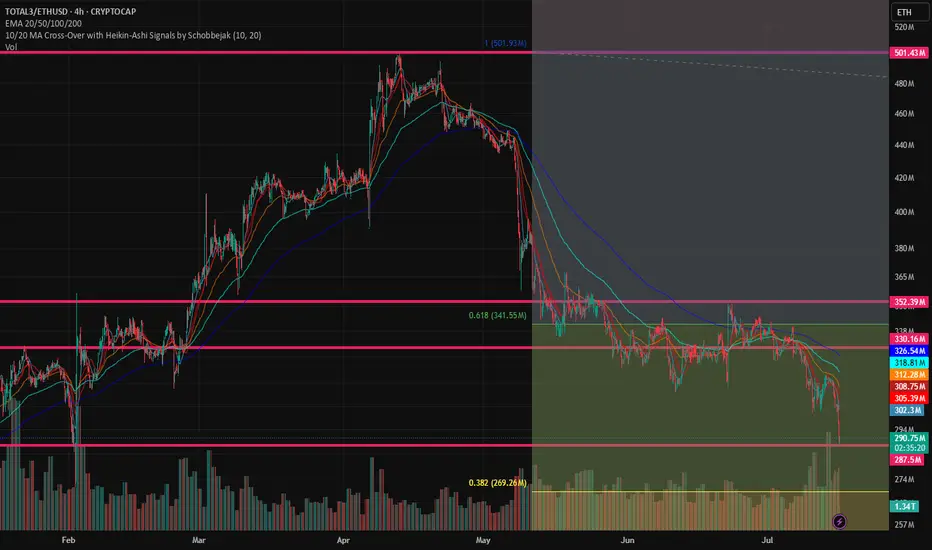
Altcoins are getting absolutely decimated relative to ETHWhile Ethereum has been on a massive run from its lows this year — pulling altcoins up with it — most alts are still lagging far behind.
This chart clearly shows how poorly altcoins are performing against ETH, reinforcing why, at least for now, ETH remains the better hold.
It also fits the classic money flow rotation: BTC → ETH → Large Caps → Small Caps — and right now, we're still in the ETH phase. Until we see strength return in these ETH pairs, chasing altcoins may just lead to more underperformance.
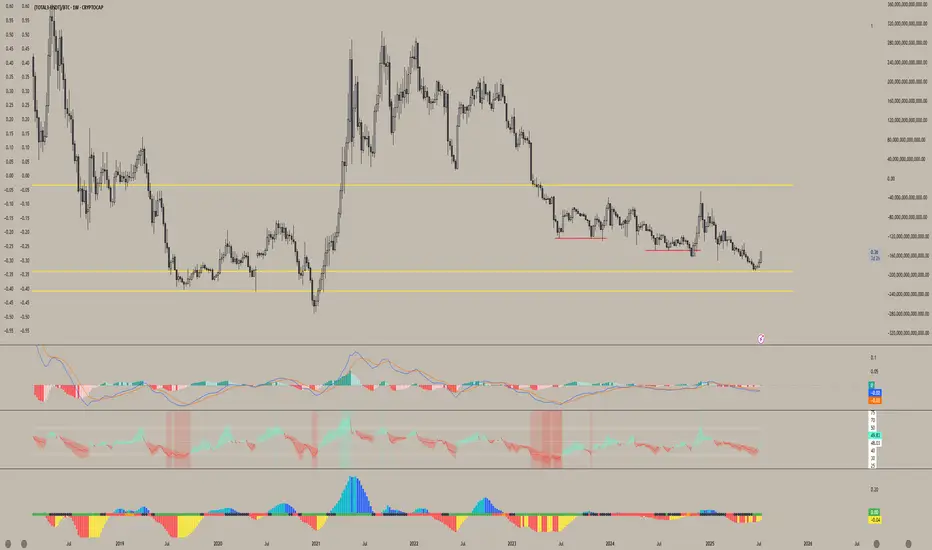
Altcoin Market Structure Outlook | ETH/BTC Rotation AnalysisThis chart outlines a cyclical framework I'm using to anticipate a potential bottom in altcoins heading into Q4. Currently, ETH is outperforming BTC, and altcoins are following its momentum - though many continue to make lower lows relative to ETH.D but as long as eth rallies I see Alts keeping up.
Historically, we've seen altcoin capitulation phases follow a two-stage structure: an initial local bottom in June/July, followed by a final sweep or structural low into October (Q4), as observed in both 2023 and 2024. Given this repeating seasonal pattern, I expect ETH to potentially retrace against BTC in Q4 making a higher low, which could set the stage for altcoins to make a lower low and retest their key range lows — particularly near the 0.25 ETH/BTC level.
Should ETH maintain a higher low and resume trend afterward, it would likely mark a rotation point where capital begins flowing into higher-beta altcoins. Coupled with potential macro tailwinds like rate cuts or dovish policy pivots, this scenario could trigger a strong altcoin rally from Q4 into Q1.
This chart aims to visualize that rotational capital flow and position sizing opportunity across the cycle.
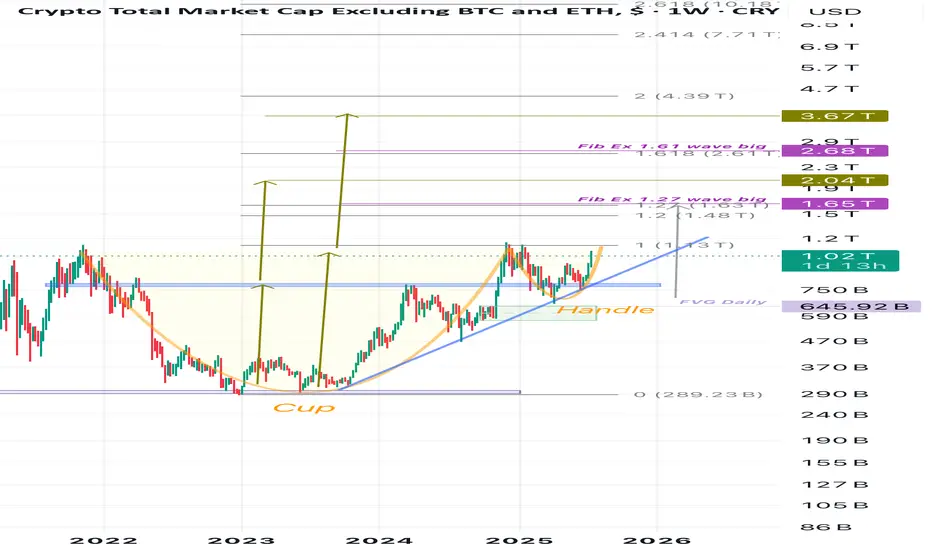
Total3Hello, I think what we see on the chart is a cup pattern and the handle is complete, of course we have two cups and two handles with a small cup inside a large cup, I think a very fast and big rise is coming for altcoins, in a way that few people believe.
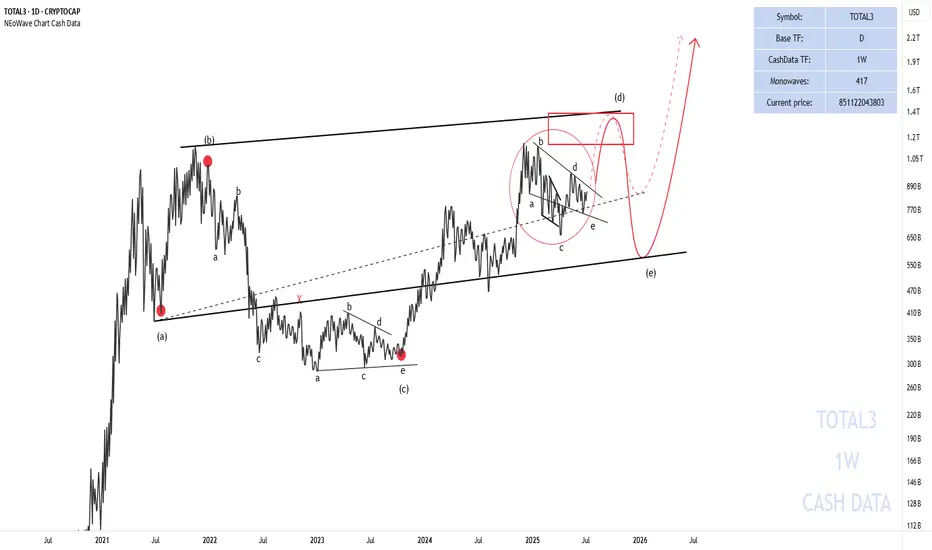
Has the Alt Season Started?Total 3 seems to be forming a neutral triangle (marked with a red circle) and will soon move towards the red box to complete wave-(d) of the higher degree triangle.
The price path is marked for you on the chart.
Good luck
NEoWave Chart
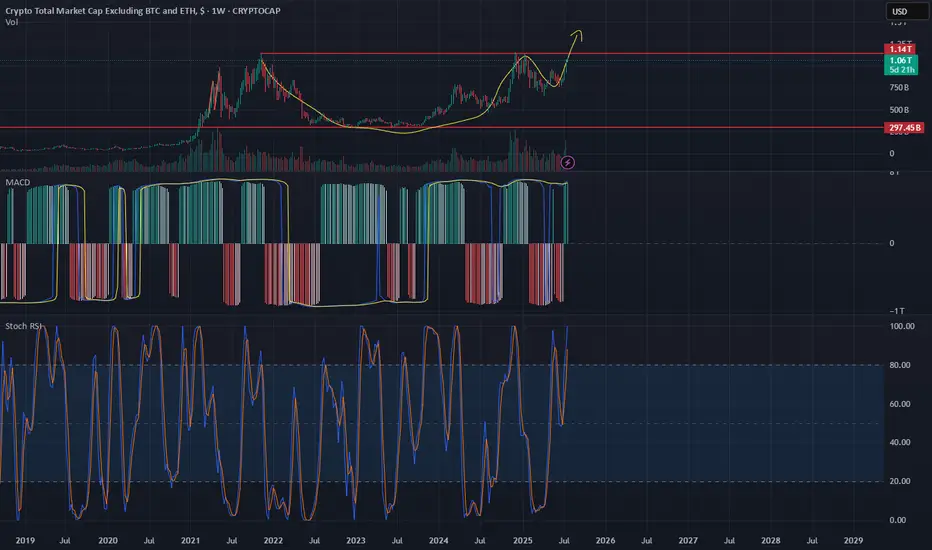
Total3 looks bullishTOTAL3 has been moving within a rising channel since October 2023. Recently, it bounced off the channel's support line—just like it did in previous years (Resulted in mini altseason)—and is now showing similar bullish behavior. It looks like we're in the middle of a mini altseason.
After successfully clearing and retesting the $936B level, the next major resistance to watch is around $1.13T. If the market can break through this zone, we could see a strong altcoin rally, potentially pushing TOTAL3 up toward the resistance area near $1.6T.
Momentum looks solid—weekly Stochastic RSI has made a bullish crossover, and both weekly and monthly trends are pointing up. However, there's one red flag: bearish divergence between price and RSI is forming. The weekly RSI level at 72.5 is a critical zone. If we can push past 81 and 89, that divergence could be invalidated, signaling strong continuation.
For now, let’s keep it simple and watch how TOTAL3 reacts to $1.13T. That level will be key in deciding if the altcoin market has more room to run.

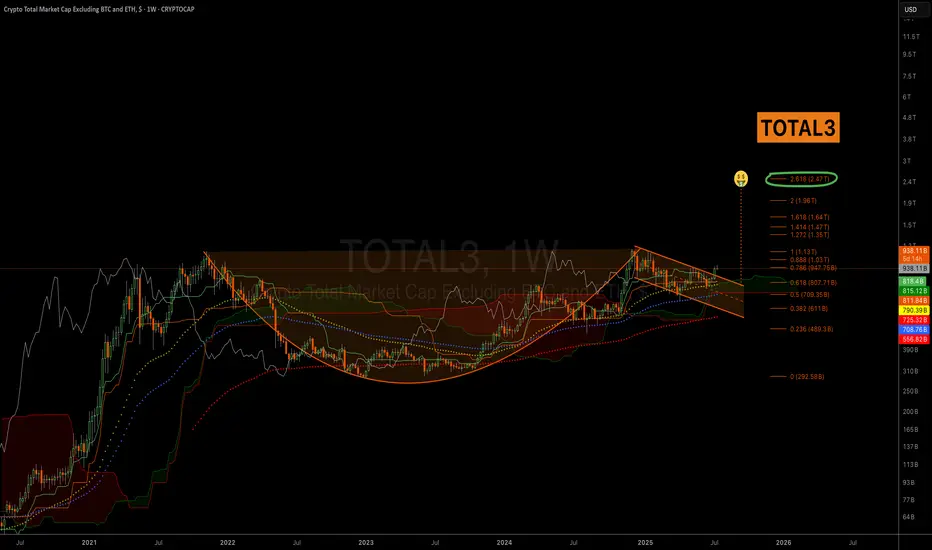
TOTAL3 exc BTCÐTOTAL3 is at the all-time high again and pushing to break that.
according to previous cycles the 1.414% of Fibonacci retracement at $1.98T is the top & timing of before the end of November 2025

TOTAL3 - Massive Cup & Handle AccumulationImagine these coins, the way they are destroyed and at the bottoms. But then they make you not believe the projects anymore, like theyre all trash. People on youtube calling them scam coins, and sure 90% or more are. But there are projects that are good, and those are gonna get massive pumps coming up. Dont give away, because it is not longer selling at these levels, dont give away your coins for rice prices.
TOTAL3 UPDATEOn the TOTAL3 chart (which is an indicator of the market value of all coins other than Bitcoin and Ethereum), a head-and-shoulders pattern has formed and is now active. This means that we will see a rise in altcoins.

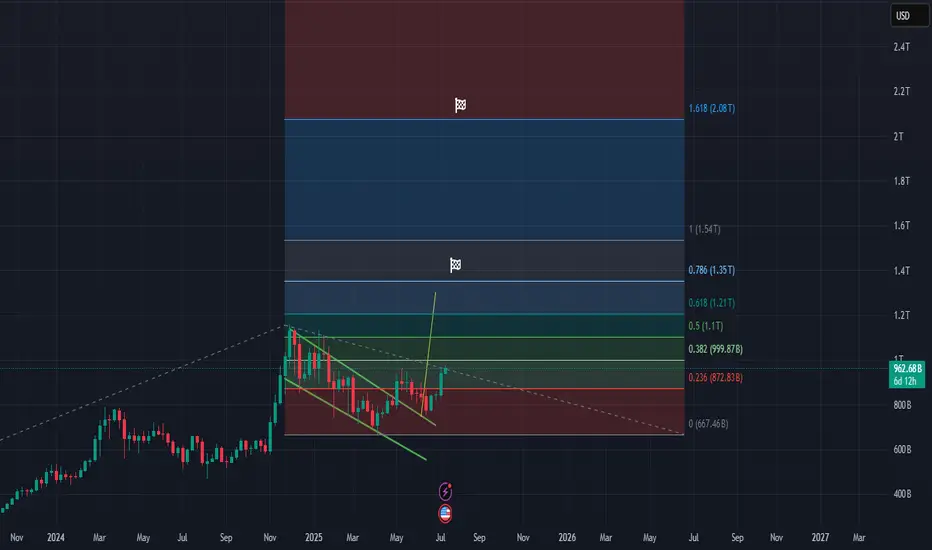
TOTAL3 – Breakout Targethi traders
The TOTAL3 chart shows a strong breakout from a falling wedge pattern, followed by a bullish push that has reclaimed key Fibonacci levels. Currently sitting around the $961B mark, the market has cleared the 0.236 and 0.382 retracement levels and is approaching a significant technical milestone.
In the short term, the next major resistance lies at the 0.786 Fibonacci level, which aligns near $1.35 trillion. This is a reasonable first target if the bullish momentum continues and would represent a solid recovery of altcoin market cap from the recent lows.
However, the mid-term projection is even more ambitious. If this rally continues and mirrors previous cycle expansions, we could see TOTAL3 reaching the 1.618 Fibonacci extension level, targeting a $2 trillion market cap. This would indicate a powerful altcoin cycle is underway, with broad market participation beyond Bitcoin and Ethereum.
The technical structure supports this outlook, especially after a long consolidation phase and a breakout above descending resistance. As long as TOTAL3 holds above $850B–$900B, this bullish thesis remains intact.
OK, you can buy some alts now...So I published an idea a while ago (in May) suggesting that ETH had more upside than most alts. We're now close enough to support that I would consider adding some alts. Among my favorites:
SUI
SUPER
AVAX
TAO
PENGU
And of course the ETH beta plays
ANDY
PEPE
BOBO
BRETT
WOLF
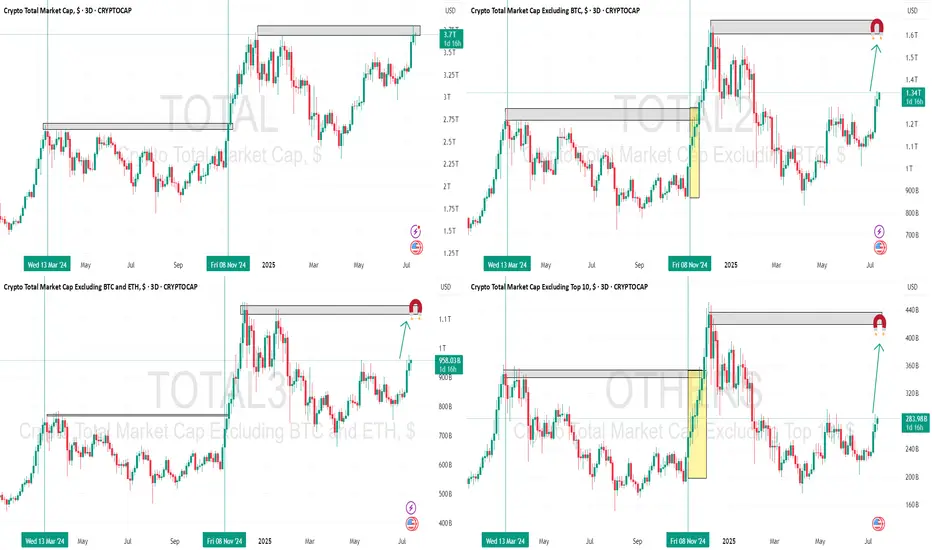
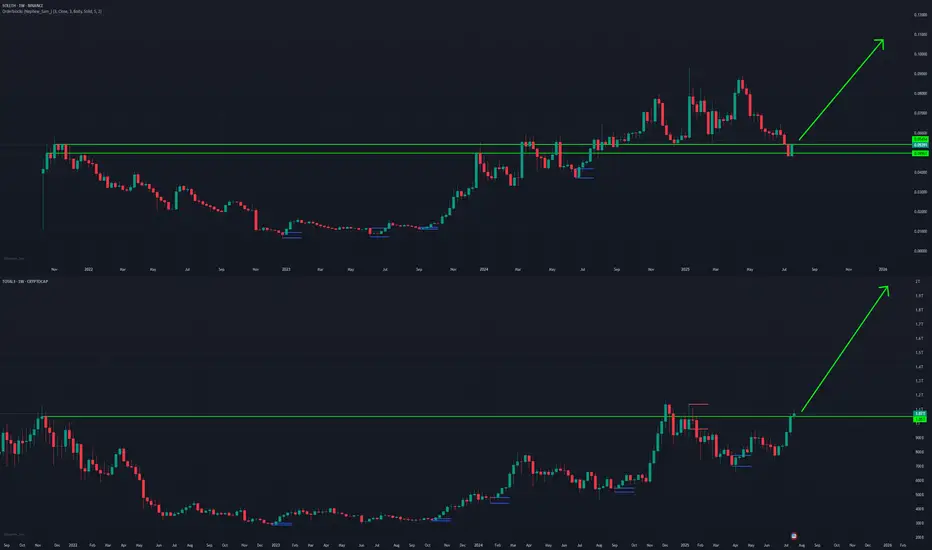
Crypto others may follow Total to Dec 2024 peakLast time in November 2024, when TOTAL returned to the March 2024 peak:
•TOTAL3 followed one week later
•TOTAL2 followed two weeks later
•OTHERS followed three weeks later
If the same pattern is repeating now with TOTAL returning to the December 2024 peak, then the next 20–30 days should be great for altcoins 🔥
We start ALT Season now with 3 targets!Hello guys,
As you can see we have 3 targets🎯 green, blue, red,
which target we will reach?
It depends on the Fractal scenario on the right, So we will wait 2 clear trends,
each one has 3 tops and Clear correction between the up trends,,
Don't lose your positions and don't jump between currencies!
Also Don't burn your wallet with Future!
Spot is Enough!

TOTAL3 - CRYPTO BOOMThe TOTAL3 chart clearly shows that trading volume is increasing, the price structure has entered an upward phase, and many Layer 1 and Layer 2 projects are breaking away from their multi-month lows. This indicates that fresh capital is flowing from Bitcoin into altcoins.
What’s important is that this breakout coincides with the rise of several emerging narratives like AI, RWA, SocialFi, and DePIN.
This suggests a high probability that the upcoming altseason will be broad and multi-narrative.
Simply put:
A major altseason has just begun
And TOTAL3 might just be the bell that rings in this carnival
WOOOOOOOOOW
Multi-year Cup & Handle Formation for ALTS -Exclude ETH and BTCFour years in the making, the Alts are on the verge of forming a Multi-Year Cup and Handle. With ETH leading the charge, followed by significant and then mid-sized alts, the market is on the brink of a massive surge.
Once 1.15T is breached and a retest down to 1.15T is confirmed, the market is going to see some notable 'fireworks'. The charts are lining up with the Sep/Oct 25 time frame for a significant breakout.
Stay safe and enjoy the ride in the next few months !
ALT SEASON Cycle Finale Special | SOL/ETH & TOTAL3Our last analysis of BTC.D ⬇️ and ETH/BTC ⬆️ () is now playing out, and we are entering the final stage of the 4-year crypto cycle -- ESCAPE VELOCITY for the rest of the crypto market.
As money flows up the risk curve, expecting SOL to outperform ETH from here, and the rest of the crypto market to outperform majors.
Welcome to the cycle finale special!
Altseason Bomb Start After $1.16T ? (VERY SOON!)The market structure remains bullish, supported by a strong upward trendline that has held firm since early 2024. Price continues to respect major support levels during pullbacks.
🔸 The key resistance level is at $1.16T, which has acted as a strong barrier in the past. A confirmed breakout above this zone could signal the beginning of a strong Altcoin Season, potentially leading to a large-scale rally in the altcoin market.
🟦 Daily Support Zone (in blue): 962B — a crucial area for potential bounce or retest in case of price cannot break the 1.05 - 1.16T
📈 Expected Scenarios:
A confirmed breakout above $1.16T will be the start of bomb of Altseason
If the price gets rejected at resistance, a retest of the daily support zone is likely before another breakout attempt.
✅ Conclusion: All eyes are on the $1.16T level — a decisive breakout above this resistance would likely mark the official start of Altcoin Season.
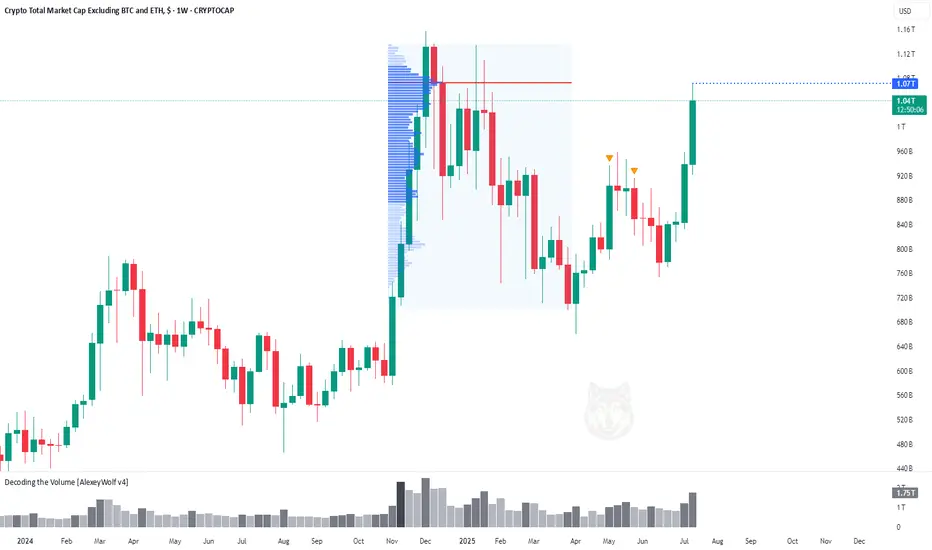
Altcoin Market Hits First Target at $1.07THi traders and investors!
The market capitalization of Total3 has reached $1.07 trillion, marking the first major target for the altcoin market.
This level corresponds to the Point of Control (POC) from the previous bullish rally and the subsequent correction — a key area of traded volume and market interest.
Several factors now suggest the potential for a continued move higher. On the fundamental side, the recent signing of a pro-crypto bill by Donald Trump has boosted overall sentiment in the digital asset space, especially among altcoins. From a technical perspective, many leading altcoins are showing bullish continuation patterns.
Wishing you profitable trades!