Long AltcoinsThis could be a good time to long altcoins. The Altcoin/BTC ratio looks like its bottoming. If not then the lower green boxes are targets. But you can see that altcoins have been pretty much down only since November 2022.
TOTAL3 excludes ETH but I think ETH will do well too. I'm hoping Bitcoin doesn't tumble and take the whole market down. Best case scenario for my trades is BTC going sideways and altcoins running upwards. Otherwise there's a lot more room for alts to fall.
TLDR; I'm long alts
TOTAL3 trade ideas

Alts market cap Total2 and Total3 retest week#Alts market cap TOTAL2 and TOTAL3 retest after successful weekly major breakout!
#Altcoins will send hard after Retest!
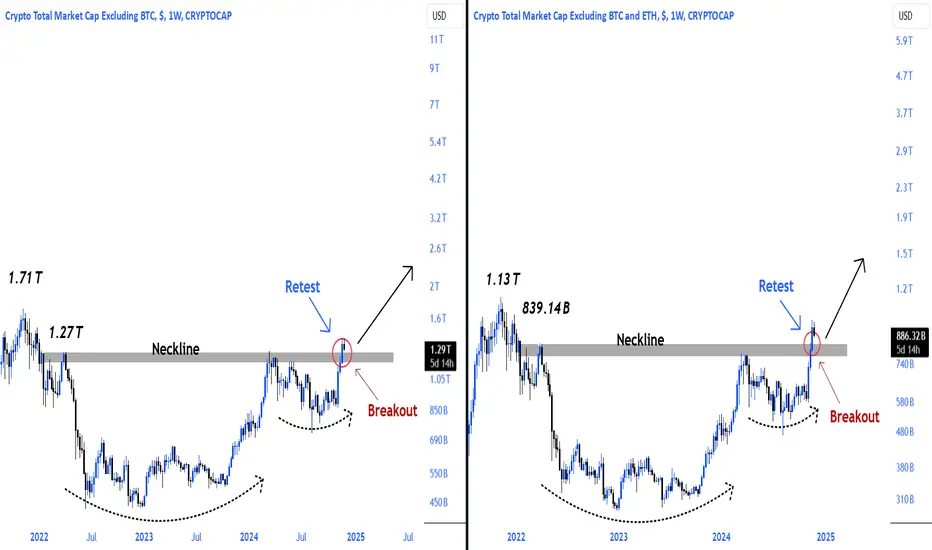
TOTAL3 Update - Nov 24 2024Despite having some bearish signs, TOTAL3 DID NOT follow previous analysis and crossed above the resistance zone and this resulted in an Altcoin Party (many coins having nice pumps in the past few days).
Now that TOTAL3 has had a break-out, it is expected to be followed by a retest. In case the possible retest gets deeper (internal retest), TOTAL3 must not drop below 700B level, otherwise the structure of the recent bullish move will be affected.

When is the best time to buy Altcoins?The short answer is... Now, this year into early next year.
Although I would expect a lot of similarities this market cycle, I would also expect some differences.
So let's start with the yellow diagonal line with the up trend. This line was originally drawn through the BTC price action. Look at how it actually works perfectly with the TOTAL3, PERFECT!! So, according this chart the alt cycle big moves won't come until 2024 around the September time frame.
If we pay attention we will notice a separation From the the BTC market cap to the TOATL3 market cap that opens up during the bear market. We can also see it also mimics the bitcoin market cap until it finally closes the gap in the final stage. Solid yellow line is the BTC market cap & the candles are the TOTAL3.
The bars between moves
88 BARS is from top to top
57 BARS is from top to the start of the final wave (double bottom)
36 Bars is from when it breaks the up trend to
Not market on chart.
62 bars from the breakdown of the trend line to breakthrough back above it would but it in early February of 2025, pretty much right on schedule.
This chart is on the 2 time frame so each bar equals 2 weeks..
The indicators below are TDI and RCI 3LINES.
Here is where some of the differences might come in to play.
we'll look at the TDI first. I want you to keep in mind that I have zoomed in this indicator to show the moves more clearly. In 2019 the RED line (fast moving line) made a fairly big move up and broke through the top of the channel. It then dropped below the middle line (Yellow) and went sideways until it's next move again piercing the top of the channel although not as high into the inevitable
COVID Crash. Comparing to this bear market the TOTAL3 has made a move off the assumed bottom but it wasn't as strong as the move in 2019 as shown by RED line. Also this time the RED line seems to have found support on top of the Yellow line showing more strength in the correction phase. If it does n=hold I would expect the next move to be higher than the initial one which would be different from the last bear market. I also think this will continue all the way up.
RCI 3LINES RED FAST / BLUE 2ND FASTEST / GREEN SLOW
The all important Blue line has crossed up on the green line. Once the red line turns back up, the move will follow.
All in all it is good time to start to accumulating your altcoins of choice. Keep in mind although they do move together for the most part, they all have they own cycles as well.
Thank for looking. Let me know what you think down below.
WeAreSat0shi

Altcoin Market Signaling Potential Bullish Run to $1 TrillionTotal Alt Coins Market Cap analysis update
After a significant upward movement in the market cap, consolidation within a descending channel or flag suggests a period of profit-taking and market indecision, though the overall structure remains bullish. The market is approaching the upper resistance of the flag, signaling the potential for a breakout. Once the breakout is confirmed, a bullish move can be expected. Based on historical price action and technical patterns, the next major target post-breakout could be around $1 trillion before end of 2024.

Total 3 The chart illustrates the total cryptocurrency market cap, excluding Bitcoin and Ethereum, currently consolidating within a descending channel, often recognized as a bullish flag pattern. This pattern emerges after a strong upward movement, suggesting the potential for further gains once the consolidation phase concludes. The market is fluctuating between two red trend lines, which represent the upper and lower boundaries of this flag.
Key levels of support and resistance are highlighted on the chart. The resistance level, around 783 billion USD, has been tested previously but remains unbroken, causing the market to pull back. On the downside, the chart identifies a strong support zone near the 550 billion USD marked in blue. This area has consistently served as a critical support level, making it a pivotal point to monitor for any potential bounce.
The overall sentiment expressed is one of optimism, a massive bull run for altcoins. The ongoing consolidation within the bullish flag is viewed as a temporary phase before a likely breakout to the upside. After a confirmed breakout from the bull flag which could confirm the continuation of the upward trend and potentially signal the beginning of a new altseason. This indicates that the market may be on the verge of a significant move, and traders are advised to monitor these key levels for possible trading opportunities.

The Cup and Handle Pattern: A Trader’s Blueprint for SuccessThe Cup and Handle pattern is one of the most reliable and visually recognizable chart patterns in technical analysis. A favorite among both beginner and seasoned traders, it signals a potential continuation or breakout and offers an opportunity for significant profits when traded correctly.
But what makes this pattern so special? Let’s dive into its structure, Bulkowski’s research, and how you can leverage this powerhouse pattern in your trading.
What is the Cup and Handle Pattern?
The Cup and Handle pattern resembles the shape of a tea or coffee cup—complete with a rounded bottom and a slight dip forming the "handle." It typically forms in bullish markets and is considered a continuation pattern, suggesting that the trend is likely to continue after the breakout.
Key Features:
Cup Formation:
A rounded, U-shaped curve that signifies a gradual correction followed by an equally steady recovery. A V-shaped bottom is less ideal but can still be effective in some cases.
Handle Formation:
A small consolidation phase or pullback, typically sloping downwards, that signifies hesitation before the breakout.
Breakout Point:
When the price moves above the resistance level (the lip of the cup), confirming the pattern and signaling a bullish breakout.
Bulkowski’s Research: The Numbers Behind the Pattern
Thomas Bulkowski, a renowned technical analyst and chart pattern expert, conducted extensive research on the Cup and Handle. His findings provide valuable insights into the pattern’s reliability and performance.
Key Statistics:
Success Rate: The Cup and Handle pattern has an average success rate of 65% for upward breakouts, making it one of the more reliable patterns.
Average Rise Post-Breakout: Bulkowski’s research shows that the price typically rises by 34% after a breakout.
Handle Depth: The handle should retrace no more than 12-15% of the cup’s height. Deeper handles tend to be less reliable.
Volume Analysis: Breakouts with increasing volume tend to perform better. About 50-60% of successful breakouts occur with higher-than-average volume.
How to Trade the Cup and Handle
Step 1: Identify the Pattern
Look for a rounded bottom (the cup) and a smaller pullback or consolidation (the handle) that does not exceed 50% of the cup’s height. Ensure the pattern forms over a reasonable timeframe—weeks to months for higher timeframes, or days for intraday trading.
Step 2: Confirm the Breakout
Wait for the price to break above the resistance level (the lip of the cup). Volume spikes during the breakout provide additional confirmation.
Step 3: Set Targets
Target Price: Measure the height of the cup and add it to the breakout point to estimate the target price.
Stop Loss: Place a stop-loss slightly below the handle or the bottom of the cup to minimize risk.
Step 4: Manage Risk
Use a reward-to-risk ratio of at least 2:1 or 3:1, and avoid over-leveraging. Bulkowski’s research suggests the pattern’s success improves when traders maintain disciplined risk management.
Tips for Spotting High-Quality Patterns
Timeframe Matters: The longer it takes for the cup to form, the stronger the pattern. Bulkowski’s research highlights that patterns forming over 3–6 months tend to yield better results.
Handle Characteristics: A tight, orderly handle is more effective than a volatile, erratic one. This suggests controlled consolidation rather than panic selling.
Volume Trends: Look for declining volume during the cup formation and handle, followed by a sharp increase during the breakout.
The Pitfalls to Avoid
While the Cup and Handle is a high-potential pattern, not all instances are created equal. Here are common mistakes to avoid:
Forcing the Pattern: Sometimes, price movements may appear similar but don’t meet the full criteria. Stick to well-defined patterns.
Ignoring Volume: A breakout without significant volume may lead to a false signal.
Trading in Weak Markets: This pattern works best in bullish environments where upward momentum can sustain breakouts.
The Cup and Handle pattern combines simplicity with effectiveness. Bulkowski’s statistical research underscores its reliability, and its visual nature makes it easy to spot. Whether you’re trading stocks, forex, or cryptocurrencies, this pattern is a powerful addition to your technical analysis toolkit.

Be Warned: The Crypto Crash Is Coming**Be Warned: The Crypto Crash Is Coming**
It won’t happen today, and it won’t happen tomorrow, but it *will* happen probably at the top of this cycle. Be warned, stay aware, and get ready.
Have you lived through the dotcom crash of 2000?
Back then, I was the European Director for one of the top 10 internet companies, poised to go public. Our IPO paperwork, courtesy of Deloitte, was ready to roll in March 2000.
Now, I’m in crypto, and I see history repeating itself. We are in a massive bubble, and it’s going to burst.
In 2000, countless companies—including ours—were making absurd amounts of money through advertising. It defied logic. Many of these companies had little to no real value apart from "eyeballs" or page views. Compared to traditional businesses like manufacturing, their valuations—often in the hundreds of millions—were nonsensical.
At that time, Altavista was the leading search engine, while Yahoo, About.com and Lycos were internet giants.
When the dotcom bubble burst, the internet sector lost 99% of its value, and the NASDAQ plunged by 78%. The biggest names, the safest investments, were wiped out. Everyone—*even the so-called holders*—suffered.
---
### The Current Crypto Market: Déjà Vu
What’s happening now is eerily similar.
- Ridiculous projects are being valued at billions, even though most aren’t being used for anything substantial.
- Worse, crypto hasn’t gone mainstream; most people only use it for speculation or gambling.
**Reality will strike again.**
When? Likely at the peak of this cycle. It’s crucial to sell before the crash because many "big names" like Polkadot and Cardano could completely collapse. Around 99% of all altcoins will go bankrupt or get delisted.
---
### Why This Might Be a Good Thing
After the dotcom crash, legitimate companies like Amazon, Google, and Facebook emerged stronger. The noise of scams and Ponzi schemes was wiped out, allowing real innovation and better investment opportunities.
---
### How the Crypto Crash Will Happen
Do you think giants like BlackRock love crypto? They don’t. Their profits come from gold, USD, and owning over 50% of NASDAQ companies—not to mention their stake in military manufacturers. They’re not here to "save" crypto.
Instead, they’ve launched a Trojan horse strategy. By purchasing BTC and ETH—the most valuable assets—they’ve positioned themselves to control the market. Once they’re ready, they’ll crash the rest of the crypto space.
Bitcoin and Ethereum will survive, and BlackRock will profit enormously, as funds from worthless altcoins flow into their solid holdings.
---
### What This Means for You
I love crypto, but when meme coins hit $20 billion in valuation, you know something is wrong. And guess what? You’re right.
Mark my words. Be prepared.
- When your altcoins have made you money, **sell.**
- Move your USDT to your bank account.
- Wait for the next cycle.
This strategy won’t just help you avoid the next bear market—it could save you from the looming crypto crash entirely.

composite index in the region of 0.8 // the end of the altseasonHello everyone.
This is one of those composite graphs that are designed to help you understand a little more.
First of all, if you look at large timeframes, the whole market situation looks like some sideways movement. While some are seeing growth tomorrow and others are seeing the market fall, I don't see any clear signs of either. My personal opinion.
So, we take the capitalization of all coins without Bitcoin and Ethereum, subtract Tether from it additionally and divide by BTC.

'Close But No Cigar' for Bitcoin – Altcoins Hit Major Resistance🚨 Close But No Cigar for Bitcoin – Altcoins Hit Major Resistance 🚨
🌟 Correction Likely – Or Do We Keep Pumping? 🌟
In today’s market breakdown, we’re at a critical crossroads for Bitcoin and Altcoins (Total3). 🚦 After months of bullish runs, both markets are approaching major resistance zones, and caution is key moving forward.
📌 Total3 (Altcoins Excluding BTC & ETH):
938B Resistance: After breaking out of a long-term descending channel and reaching the 600B–938B targets, Total3 now faces a significant resistance zone.
A pullback could be imminent unless we break and flip this resistance into support. Be careful before jumping into long positions at these levels.
📌 Bitcoin’s Psychological Barrier:
100K Level: Bitcoin came close, but no cigar to hitting this major psychological milestone. This remains an untouched resistance, with 96K acting as interim support.
Key Supports: Watch for levels at 91K and 88K. These areas could provide buying opportunities if Bitcoin retraces.
🎯 What’s Next? While we celebrate the incredible bullish momentum in recent months, this is not the time for FOMO. Both markets are at pivotal levels:
A breakout in Total3 above 938B or Bitcoin above 100K would signal continued bullish momentum.
A rejection might result in pullbacks, offering better entry points.
Strategy Alert: I’ve started to explore selective short positions on altcoins while watching these key zones. Longs will come into play only after confirmed breakouts above resistance.
📊 Check out the charts for deeper insights into these critical levels!
One Love,
The FXPROFESSOR 💙

Altcoins Hit Major Resistance: What’s Next for TOTAL3? 🚨 Altcoins Hit Major Resistance: What’s Next for TOTAL3? 🚨
📊 Altcoin Season 1st Milestone Reached – But Can We Push Higher? Or a correction is first? 🌟
The Total3 Chart (Altcoin Market Cap Excluding BTC & ETH) has finally reached the long-anticipated 600B–938B range, a critical resistance zone that’s been in focus for over a year. 🚀 After breaking out of a descending channel and delivering strong bullish momentum, altcoins are now at a make-or-break level. Let’s dive into the key areas to watch next! 👇
🔑 Key Insights:
938B Major Resistance: Total3 has climbed steadily to this key level, but it must break and flip this resistance into support to sustain the rally.
Channel Breakout: After months of consolidation within a descending channel, altcoins made a clean escape, sparking a rally to the current resistance.
Potential Scenarios:
1️⃣ If the breakout succeeds, the next bullish target is 1.33T, opening the door for explosive altcoin growth.
2️⃣ A rejection could lead to a retracement back to 600B support, providing fresh entry opportunities for the next leg up.
⚠️ Why This Matters: This is not the time to FOMO! 📉 While the altcoin market has shown incredible strength, the risk of correction remains high unless we see a strong breakout. If this resistance holds, short-term pullbacks could offer better buying opportunities.
Strategy Alert:
Bullish above 938B, targeting 1.33T.
Watching for a rejection to add positions closer to support levels.
📈 What’s Your Play? Let me know in the comments if you’re eyeing any altcoins to ride this potential breakout or waiting for the next dip! Stay tuned for further updates.
One Love,
The FXPROFESSOR 💙

When the next altseason might happen?One usually refers to altcoins and mems flying high when talking about big profits and pumps. So, when the next alt season could happen? To answer this question, analysts usually examine ETH and the Crypto Total Market Cap (excluding BTC and ETH) charts to make a prediction. Moreover, I think it is worth analyzing the Dominance of altcoins (excluding BTC and ETH) as well. I already analyzed the ETH before and updating it periodically, so let's look at the Crypto Total Market Cap.
When looking at the Total Market Cap chart, it is evident that there was a downtrend in which lower lows were made one after another. Recently, in March 2023, a higher high and a higher low were made; a sign of a possible reversal. But, two higher highs and two higher lows are needed, at least, for the reversal confirmation. Furthermore, the value/price of the Total Market Cap must not breach the recent higher low. Based on the technical analysis, two possible scenarios can play out that are drawn on the chart.

ALT/BTC reversalI said it before and I'll say it again. We are early for alts with an imminent ALT/BTC reversal coming up. Im expecting BTC to hit 100k and then more people to flock back in going higher up in the risk curve. Dont forget how much money remains sidelined

I bet you are not watching this chart of TOTAL3#ALTSEASON Update🚀
Let’s dive into some detailed alpha!
Take a look at this (Total3-USDT-USDC)/BTC chart. It clearly indicates that #Altcoins could bleed by a maximum of 20% further from current levels in CRYPTOCAP:BTC pairs. However, this doesn’t necessarily mean they’ll lose value in USD terms if #BTC continues to pump, which seems likely in the coming weeks.
Following this, altcoins are expected to start outperforming BTC and will likely peak when this chart reaches around 0.56, with another possible top at 0.91.
PS: The altcoin market is highly fragmented this cycle. Not every altcoin will pump equally or peak at the same time. However, overall, the altcoin market could potentially achieve a top near the 0.91 level, which represents a 3x increase from current levels.

Altcoin Market Price Prediction ChartThis innovative chart provides a comprehensive overview of price predictions for the entire altcoin market. Leveraging advanced analytics and state-of-the-art algorithmic models, it highlights key trends shaping the future of this ever-evolving market.
Whether you’re an experienced investor or simply curious about the potential of cryptocurrencies, this chart is a valuable tool to anticipate market movements and refine your strategies. Stay ahead of fluctuations and make informed decisions with a clear and concise vision of the altcoin market's future.

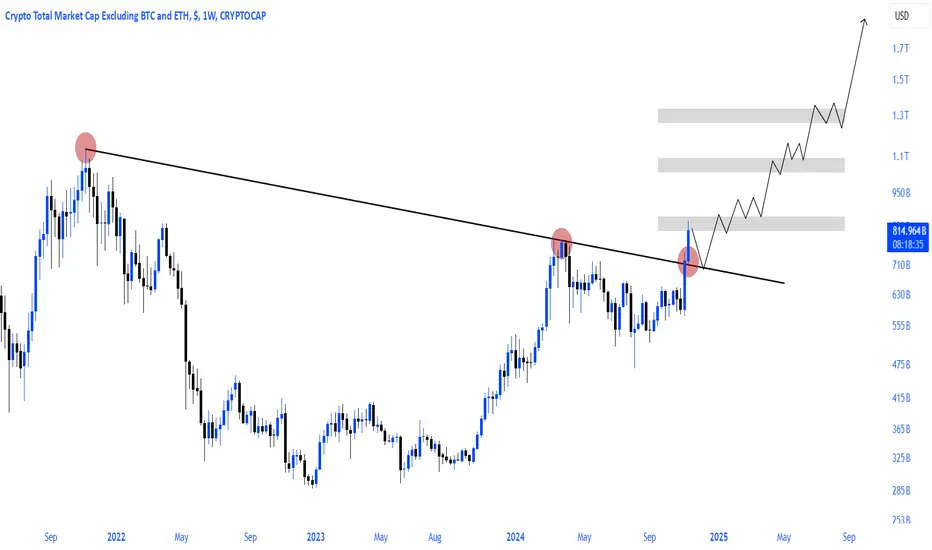
#Altseason parabolic run loading!Alts bullish season is loading with an upward break and retest of the bullish arm cup formation
#Alts market cap #total3 are looking ultra bullish!
#Altcoins are generally still in hibernation!

TOTAL 3 - Crypto Total Market Cap excluding BTC and ETHVery technical. A global trend, followed by a correction to the 0.618 Fibonacci level and the global order block, which is also the PoC (Point of Control) of the entire trend movement. We're clearly moving within a kind of wedge.
We haven't been fans of technical analysis for a while, but part of it will always stay with us. I think this is one of those moments when, after it plays out, people will look back and say: "How obvious it was."
There are two options here: either one more update of the lows on altcoins or a correction upwards. Two scenarios, but globally, it doesn't change anything.

TOTAL3 update - Nov 20 2024Total3 has reached a heavy resistance zone and give the fact that its recent ascending trendline is already broken, it is quite possible to see some dump in the market towards 690B - 727B zone.
If TOTAL3 continues to drop below 665B level, the drop becomes deeper and more time-consuming.

Possible Altcoin Season This SummerThe total market capitalization for altcoins (Total 3) appears to respect the support line, which suggests we might be near the bottom. This technical analysis indicates that we are at the low side of the 0.618 Fibonacci level. This level often acts as a strong support and could potentially lead to a significant push higher, similar to the 60% increase we saw from February to March. This upswing could happen as early as mid-August.
However, it's important to keep in mind the possibility of a slight drop to the 0.786 Fibonacci level, around a $545 billion market cap, before a significant upswing. This lower support level could provide a strong foundation for a robust rally.
Personally, I plan to wait until Bitcoin surpasses $64,500 before making larger investments to ensure lower risk management. This strategy aligns with a cautious approach, considering the potential volatility in the market.
Regardless of which scenario you believe in, there is a strong possibility of a substantial upswing this year, potentially exceeding the highs we witnessed in February. Stay tuned and manage your investments wisely.

very lil TA skills Altcoin 3 optimistic guess from here As of now I still have very little TA skills, and on this optimistic version of my guess/prediction from here, I just used the same few revelations I came across when I did my first ever btc chart (finding a parallel channel that fits previous price action, and then just duplicating the the parallel channel and stacking it, to get a basic blueprint of an overlay of potential resistance and support lines), combined with TA techniques from free Crypto Crew University youtube videos and an aggregate of other youtubers here and there, and I'm probably using some wrong but yea, this is my 'bullish' and optimistic guess/prediction as a first full cycle 'retail' hodler.
If i'm not going on what I want to happen, my bearish feeling and guess/prediction would be, a 25%-35% sell off before or after thanksgiving, and either going back up shortly after and keep running through 2025 or worst and what it feels like, toping out around the 10th-14th of December.
Feel free to tell me what will likely happen if you are an experienced TA chartist.

Parabolic #Altseason loading!#Altcoins matket cap #Total3 is on the verge of a big breakout!
#Alts are on the verge of a big breakout like before the 2021 mega bull season!

#Altcoins are starting to warm up ahead of the major run!The bullish wave we are witnessing is just a trailer The biggest one hasn't even begun yet for #Alts
The $Altcoins MarketcapThe $Altcoins Marketcap chart indicates a strong bullish breakout, with the market aiming for a significant increase. Based on the pattern, the target is $1.533T, supported by a "Cup and Handle" formation. This suggests a continuation of the upward trend as altcoins gain momentum. A breakout above the current resistance confirms a substantial rally in the #Altcoin sector.
