Crypto market primedWide lens view of TOTAL3 crypto market cap. Looks to me as though we've flipped a key HTF level into support. If it holds I believe this will be the platform for a push up to $635b, provided the BTC narrative around ETF approval doesn't falter.
TOTAL3 trade ideas

TOTAL3 ABCD points at 2T and fibo to 3.3T caphey hey
To the point, how to trade Total3, well no-one is offering that option, the best would be to buy all the tokens equally (depending on the market cap) but even that is hard.
I am trying to do just that on 5x and 8X effective cross leverage (to all alts,not by market cap, but more or less by non-objective), so far still in accumulation period. Slowly adding, but on the way up or down you can always deleverage, borrow BTC and buy alts (or vice versa), or to sell some alts that have done 30%+ and switch to others.
Now we are in the turning point with BTC, which can dip below 50K or continue to 56.3-57.6K before a correction.
TOTAL3 shows realist TP with ABCD at 2Trilion cap.
lets see how far alt season can bring us.
de

$TOTAL - Excluding BTC & ETH (update)Looks like we have completed the Sign of strength phase, and the back up.
This is where the real expansion starts after leaving the accumulation range. Looking left we can see we are above critical resistance, and historically, its straight up and down from here to target 3 with likely consolidation under the 2.618
Looking at the entire structure here as a broadening accumulation, the major move comes after the recovery the lower inflection level or range low, and would typically be pretty aggressive from here to the top of the broadening formation.
If we see a partial decline there / high and tight consolidation, it could give some validity to targets beyond my extension levels here, which would be a measured move of the bull top, to bear low.

TOTAL 3 ~ Potential Breakout in April 2024TOTAL 3
Altcoins minus BTC & ETH
✅Price has broken above the 200 DSMA
✅Price has broken out of the pennant
⏳126th week is 1st April 2024
Earlier today I shared TOTAL 2 which includes CRYPTOCAP:ETH and suggested that including ETH altseason could initiate from Feb/Mar 2024.
TOTAL 2 breaking out ahead of TOTAL 3 makes a lot of sense as this is what has happened in prior cycles
FIRSTLY, bitcoin leads the whole market like it has been.
Secondly, liquidity moves into Layer 1 altcoins like CRYPTOCAP:ETH , CRYPTOCAP:ADA & EURONEXT:ALGO = TOTAL 2 in Feb/Mar
Thirdly, liquidity moves into Layer 2 altcoins like CRYPTOCAP:IMX , CRYPTOCAP:MATIC & NASDAQ:OP (TOTAL 3 in Mar/Apr)
After that the Memecoins and shxtcoins have their wild runs, which usually coincides with peak euphoria and the end of the bull market or a sizable correction. This is why you leave the gambling with small small positions until later in the cycle for those memecoin plays.
I hope this helps you frame the timeline of the market in you mind. It may not happen exactly as outlined with the dates but the sequence will likely be the same so we can watch out for Layer 1's and Layer 2's moment next.
PUKA

total 3 viewwe re close to supply area.this is a weekly chart. Even we ll see wick to down keep hodl spots. When we ll reach supply zone have to check btc dom, usdt dom and bitcoin.

#Btc #Eth #Bnb #Sol #Altcoins #Altseason #Altcoinseason #TotalTotal MC
Altcoin Altcoins
Altseason soon ....
Green= Target
Orange= Resistant
Red= St
Disclaimer
This text is just a personal opinion and should not be used as a basis for decision.

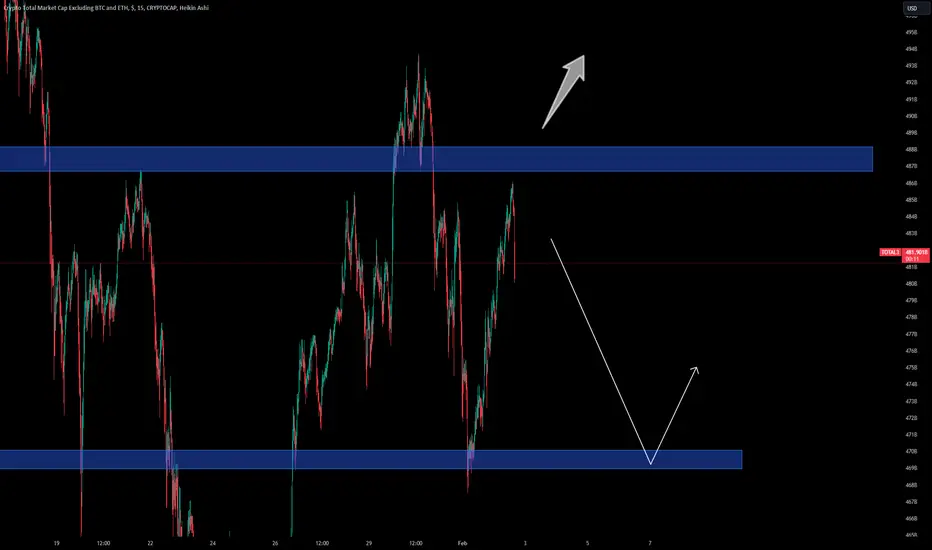
Will total 3 retest the breakout?As bitcoin rallies into the 50k range, Total 3 finds a moment of pause and reflection—looking to the recent highs or retesting the breakout? Time will tell.

TOTAL3we entered in floor place and move to up but this place you can saty with your currency and take stop loss for positions

Short EverythingI'm short on equity, crypto also looks short. We'll see what happens. I have a short on niike, S&P, and nasdaq (tighter risk,)
Crypto also looks short to me.

Altcoins- New strong leg up?Since mid-October, Alts have shown significant upward momentum, experiencing an impressive average gain of approximately 70%.
However, as their combined market cap soared above 500 billion dollars, a predictable correction ensued, with alts retracing around 20% of their gains.
This correction stabilized around the 440 billion mark before initiating a bullish reversal.
As of now, the current price hovers precisely at a short-term resistance level.
A breakthrough above this critical horizontal and psychological threshold at 500 billion could catalyze a fresh upward surge in altcoin prices.
The projected target stands at 620 billion, representing an average increase of 25%.
Notably, certain alts are expected to outperform this average, with some potentially experiencing gains exceeding 100%.


The Altcoin MarketThis chart displays the altcoin market (crypto total marketcap -BTC, ETH, & stablecoins) overlayed with BTC price and halving date information. After the 2020 halving, BTC price hit an upward inflection point roughly 154 days after the May BTC halving. The altcoin market hit its cycle low at the end of December, roughly 231 days after the halving. These same periods past the 2024 halving are indicated in the chart.

If you're not buying?? Then WTF r u doing? :flushed:Like he said lmao Counter trendline break after 0.618 bounce? sounds like buzzwords to me. Dont believe it till i see it. Meanwhile i own 15 coins. I will Solde when the time comes.

Crypto Total3 BreakoutCrypto total3 has started to move,
the breakout retest has already occurred
alts are primed and ready for a heinous pump!!
strap in

TOTAL3 6H#TOTAL3 is trying to break out. Let see what will happen next. A clear breakout would confirm bullish momentum. Hold your coins!

alt mcap total3after months of chopping in the marked zone alts made a great rally , it might come back to the 450b area if it happens then there's a life time opportunity to accumulate the alt coins ,

Long Term Guess :)Just putting this out there to look back in a few years and see how things transpired, no major substance here just a few things i listen to but definitely not financial advice just a musing :)
Have fun and be safe out there.

TOTAL 3 Cycles SynchronizationHere is the Cycles Synchronization of Crypto Total Market Cap Excluding BTC and ETH (TOTAL 3). At some point, between mid november and mid december 2025, I do expect around 2T Market Cap to be the top for the cycle. 1 year later, the Market Cap could be at around 1T or a bit less, I think.
Will follow with interes...

Not a good day for Bulls today.. Feds got a Dual 'delay signal!🚨 Attention Traders: Important Market Update 🚨
Today's job report has delivered a curveball for bulls in the market. The U.S. economy added a staggering 353,000 jobs, far surpassing the expected 187,000. While this is fantastic news for the dollar and reflects a strong economy, the implications for traders are mixed.
🔍 Why the Caution?
The unemployment rate dropped, indicating fewer people without jobs, which ordinarily would be purely good news. However, the average hourly earnings have also risen – signaling potential inflationary pressures ahead. This could mean that the Federal Reserve's next big challenge will be price stability, not employment.
💡 Fed's Dual Mandate:
Remember, the Fed has a dual mandate: maximum employment and price stability. Today's data ticks the box for employment but raises the red flag for inflation, hinting that the Fed might not be as quick to cut rates as we hoped.
📉 Impact on the Markets:
This is a pivotal moment, especially for risky assets. We might need to brace for a stronger dollar, which traditionally doesn't bode well for assets like gold and cryptocurrencies.
📊 What's Next?
Shorting Opportunities: With a bullish dollar, look into shorting opportunities on assets like Bitcoin and other altcoins such as AVAX.
Gold Watch: Keep a close eye on gold. With these figures, gold prices could dip below $2,000, presenting potential entry points for shorts.
🔄 Portfolio Adjustments:
It's time to reassess and readjust portfolios in light of this new data. Today's results are a stark reminder of the importance of staying vigilant and adaptable.
Stay tuned for more updates and strategies as we navigate these market developments together. Trade smart, and let's tackle these challenges head-on.
One Love,
The FXPROFESSOR 💙
Altcoin h & S ?Looking at my previous chart I believe there is a hidden head and shoulders to play out before this bull flag everyone is calling for.

Altcoins updateTotal 3 (alts minus eth and stablecoins) is following the path I drew for the most part, at least overall. I expect a brutal and lengthy washout. This is just the start. I am not in any levered positions. Most of my positions I have locked them in a long time ago except or a few select choices. When and if BTC dead cat bounces we could go much lower than this. Stochastic is reversing and downside is looking real here.
Target 1 :440 Billion mcap
Target 2: 420 Billion mcap
I expect LINK and INJ to continue to perform. And I also expect a gaming run when BTC re-enters the 30,000s.

🔥 Altcoin's In A Huge Bull-Flag: Break Or NotEver since the ETF I've been dominantly bearish on the market. My expectation was that the ETF would be a longer-term top.
However, the short-term looks quite bullish. If TOTAL3 (total altcoin marketcap) can break out of this bull-flag pattern, this could signal a continuation of the bullish trend.
I'm still wary. However, if the market can prove that a reversal is playing out and that the trend will continue, I will naturally switch my bias.
In case of a break out, my target is placed at 585B, which is the first big resistance from back in 2022.

total3 All you need is this two Ema and you will be amazedHi everyone posting after a while as i am watching this chart closely and thought its a good idea to post
Observations revolves around 20 and 200 ema on 3d Timeframe
As you can see two failed attempts on 20 and 200 ema crossovers happened in last cycle and then a successful crossover leads us to 700 days of bullish price action before these emas crosses bearish.
This time we have a successful crossover on the first attempt which is good for markets
Markets are above the 0.618 level support which is positive as well .Notice this .618 level is acting as major support
Key thing to note is that in previous cycle when this 20/200 crossover happened markets never
touched the 200 ema till around 700 days. the support revolves around 20 ema.
More leverage involved in this cycle so prices might come down from 20 ema to 30 or so but it should not come close to 200 ema if we are looking to sync with previous cycle as touching 200 ema was a bad sign in the Total 3 markets.
Also we have 560 days of bearish action after 20/200 crossed bearish on 3d chart.
Going forward we donot want to see this crossover to cross bearish that would not be good for markets
Best of luck Guys
LIke and subscribe for more content
