ALTCAP - ETH (TOTAL3) [2W]ALTCAP - ETH (TOTAL3) is following a clean Head and Shoulders Bottom on the weekly timeframe.
Compare the purple horizontals to see how price now is testing the A-top and what will likely happen next.
TOTAL3 trade ideas

Total3Hi, I announced cancellation in the previous positions, but we got a stop in one position. According to this chart, it seems that we have the old season on the way. I am waiting for the bit to fall and a new rally.In this rally, I think investing in good ALTs can be exciting

TOTO, pull ouva (total3 update 20jan24)Hi all, big and small
folks, hear my talks
'bout Toto thy Dog
and mistriz in fog
are u afraid? I am. BUT ure nothin', if u fearless. And the bigone, if u command ur fear and make unFOMOed disigionz (Im no, just learnin'.)
SOO
az u can see my beautiful chart, a painted all there already: equal Waves 1 and 3, ugly WXY Wave 2 and the stuff.
in MY ALT count we will moved via ZigZags, I will update it later when an enlightenment will be obtained
see ya!

TOTAL3 - Crypto Altcoin Market Cap BULLISH - Signs of StrengthTOTAL3 is consolidating its breakout from the long wyckoff accumulation we have seen the past many months.
This is known as the Signs of Strength phase and immediately precedes the mark up phase
While everyone is bearish selling the news alts are preparing for a massive rally.
Could see 800b within a relatively short time frame!
Keep stacking your favorite high performing alts

Total3 loses supportAltcoins are looking to continue to bleed here as Total3 loses support. Total3 excludes Eth and stablecoins. I think we see my medium term target of the red dashed finally, possibly a dead cat here as well. The only hope of altcoins staying strong would be if ETH pumps which is unlikely in the market. The weekly chart on ETH is losing steam as well.

📈 TOTAL3 -19% Drop, To Start (Market Correction Explained)Recently the Total3 index tested EMA50 as support and after a lower high is now set to close below EMA21 and EMA10 as bearish confirmation. This kind of setup will lead to a strong drop.
Bear volume is the highest since October and the RSI is jumping off a cliff.
These bearish signals can be found all-throughout the financial markets, not only Cryptocurrency.
It is a standard correction what is showing the chart now will happen but it can speed up and change once it starts.
👉 I will continue to share additional information through more charts.
You can visit my profile and find Solana, Ethereum, Chainlink, PolkaDot, Dogecoin, Binance Coin, Polygon and all other major Altcoins looking really weak... The smaller ones are looking better but they will also suffer when the crash takes place.
The initial strong negative reaction can take between 3-6 days and up to 9 to find some stability and then the smaller or the ALTSBTC pairs can recover and grow while the standard market correction develops in a time-window of 1-3 months.
Namaste.

This Simple Chart Tells Us All We Need to Know About Altcoins RNTraders,
Don't really have to say much more here. This is the altcoin total market cap excluding BTC and ETH. Alts continue to face trouble and it looks like more selling will ensue. Stay out of leverage and trade carefully. Ensure those stops!

TOTAL3/TOTALIn the ratio of Total3 to Total chart, we are in a long-term range. We will have an upward movement of altcoins from the specified range (more likely) or the bottom of the channel (less likely).
It should be noted that here is the PRZ range of a butterfly pattern

Altcoins: Sentiment barometerWe are in full 'wall of worry' season based on the data I collect regarding sentiment...
Constant notice from people wanting to sell before the ETF causes a sell the news situation, people hesitant to pay up to buy after missing the start of the rally, and generally reluctant to withdraw funds to non-custodial wallets and engage with DeFi and whatnot.
I experienced the emotions in this chart, but mostly sticked to my technical guns and harnessed the edge offered by Time@Mode to ride trends...although I did get scammed myself during 2018 once, so I can personally attest to the effect of powerful emotions causing a state of vulnerability after large and quick monetary gains for long enough.
We are nowhere near close to that phase of the crypto cycle here, so most traders are not likely to fall victim to greed yet, but it is always wise to stay true to crypto OG principles, and rely on decentralization and trustless-ness to keep us safe.
Best of luck!
Cheers,
Ivan Labrie.

Altcoin Marketcap Finding Resisitance at 500 Billion?Looking at the total 3 it has risen above the 500 billion marketcap briefly and looks like it could be finding resistance at this level. In my opinion this is a great place to take profits and a possible short opportunity. As i write this BTC has just hit a High 0f 47,000 and is showing signs of losing strength. Similarly ETH has risen to a new high above 2300 and may fail to hold this level. Lastly the hype around the BTC ETF has driven prices and volatility to these levels and I want to be cautious in case this is a Buy the rumor Sell the news type of event.

How To Make Money With Crypto Trading BotsWe are at the beginning of a huge crypto bull run when it is possible to make millions of dollars with strong altcoins. So how is it possible to know if an altcoin strong or it is weak?
Look at the community around the altcoin you want to profit with. I prefer to count the traffic which comes to its official website first. Is the traffic rising or it is falling?
Also look at the altcoin's twitter and discord. How people react to the news. Do they write many comments or not?
But the most important thing is which funds have invested into the altcoin.
Lets look at the biggest gainers from the previous bull run. I remember Solana, THETA, Polkadot, Cosmos etc.
I prefer altcoins which were funded by Tier 1 funds. At least one or two (there are only 22 Tier 1 funds in the market now).
After that I look at the chart. I don't want to buy altcoins that are already overpriced.
One of the best examples of altcoins I have found for accumulation for the future bull run is APTos. It is not very expensive, have the great community, valuable traffic to its official website and so on.
We will need to find 10 - 15 altcoins like APTos to make our millions of dollars. And I will help you to find the most profitable ones.
The best way to accumulate an altcoin I have found is starting a position with a grid trading bot. It is the most simple yet very powerful tool you can use to get as much altcoins as possible before it is not too late.
Why I prefer to use grid trading bots? Because these bots can accumulate literally "free" altcoins for me. Here is how I use grid trading bots.
First I need to define the range for trading and second - how many orders will trading bot have.
And with APTos the low price for the trading is $ 3 and the high one is $ 25.
The number of open orders are 100. And the profit is 0.72% ~ 7.16% per grid.
So what is the goal? The trading bot should return to me all the money I invested and also it should give me a certain number of APT coins before I close it.
After that I can start a new trading bot position with the USD the bot have made for me and keep APT coins for the bull market to sell at the best price.
Do you like the strategy I use to accumulate strong alcoins for the crypto bull run?

The altcoin market is about to explodeThe Great Wyckoff Accumulation is over. Now the market is beginning to wobble as the last redistribution takes place before the big bounces

TOTAL3 - H1 - Top of the range#TOTAL3 Eyes on this zone. Could visit the top of the range again if reintegration of the previous support #altcoins
Party is maybe not over ;)
Like If you share
NFA

TOTLA 3 is Bearish For NowA correction to the support range is seen for TOTAL 3.
After its rise, it has reached the monthly SWAP resistance range. This level is strong and can cause TOTAL 3 modification.
I have also identified the support range from which we expect a jump upwards.
Indeed, according to the TOTAL 3 chart, altcoins are not bullish at the moment and will undergo a 15-25% correction.

All crypto will drop in 2024 70 - 80 %The entire marketcap of crypto will drop, we still have not had a bear market yet. We will get a drop of anther 70 - 80 % until the bear market is over.

TOTAL3Crazy to think about but something like this is on the way...
The decentralised financial system is set to consume a massive chunk of traditional finance here as we can see..
The infrastructure built (l1s) is finally reliable enough to move synthetic assets en masse imo.
this along with many other ecosystem components (defitools/ai/gamefi/privacy) will comprise a large portion of the total3 markup.

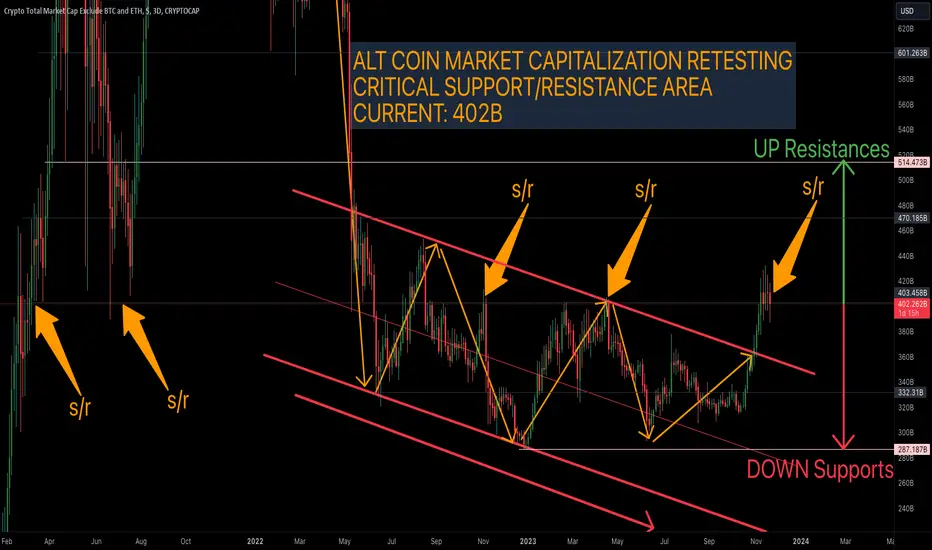
Altcoin Market Capitalization Retesting Critical S/RAltcoin Market Capitalization currently retesting critical support/resistance around 402B.
If current area remains supported then altcoin Market Cap can look to higher resistances around 470.1B and 514.4B. Bitcoin dominance will fall...This will enable altcoins to rally. #altseason 🚀
If this critical support cannot be maintained then look for supports 332B, 287B. Altcoins will perish and Bitcoin dominance will rise higher!
Total 3 next station570B give or take 3-5% is the next station . After that we reassess .
This is not a financial advice.
Thank you

ALTS full analysis short term this is an update and full analysis for alts .
firstly this is a hand made chart , total 2 except eth , and stables .you can make same on using tradingview .
you find eth analysis separated .
-------------------------------------------------------------------------------------------------------------
as you can see in the picture we kissed the top of the accumulation range (line in green)
the 3 arrows represents all the possibilities . in the end of this analysis i will post my opinion .
green arrow represents a small correction of this big move since October , and then continue higher . orange one , represent a deviation above the accumulation range and get back inside , the black arrow represent a breakout of the range . remember , these movements are short term , once , one of them take place , we will update based on the move itself . and we give the possibilities of that particular move .
-------------------------------------------------------------------------------------------------------------
1- green arrow : its a simple correction to continue higher , well known wycoff accumulation range . the correction coincides with 0.25 fib level .10% drop from here .a reversal is probable after the correction , to continue higher , until we break the accumulation range that we are in for 560days now !.
2-orange arrow ,represents a deviation above the range and then come back inside , its very common move to trick buyers and liquidate them , finally get back into the range to stay in for longer .this probable deviation gives 22% up from here .
3-black arrow , is simply a breakout of the range , could give a retest just after the breakout , or could soar and get far away from the upper band of the range to give that retest .
in case of the black arrow , the targets are for short term dec 2023 - feb 2024 :
-------------------------------------------------------------------------------------------------------------
alts depend on various things : bitcoin price, bitcoin dominance ...etc
so its hard to give long term scenario without analyzing the data and make update in weekly/monthly basis .
-------------------------------------------------------------------------------------------------------------
my opinion is :
its optimistic , and coincides with may 2021 alts high . this move could reach only the first or second green box , for me the second is possible , the third possibility is lower, but this is my opinion . as mentioned earlier , it depends on btc dominance and price .even the second or first box are nice targets , they represents : 150% and 300% from bottom .
-------------------------------------------------------------------------------------------------------------
remember , this is not a financial advice
thank you

alts/btc scenarios and levels in the chart you see possible scenarios and most important levels to help you position yourself in alts and what you can expect from them ! as alts/btc is very important metric/index.
thank you

alts/btc alts /btc are making good progress , find acceptance and continue higher will give alts another explosion . refer to the chart . could also fall from here and get back inside the range in green .
this chart is your guide for altcoins agains btc , handmade .
this is not a financial advice
thank you

Alts testing resistance after 9 swing moveFunction: Corrective
Wave Family: Complex Zig Zag
Macro count: Primary B of ABC in Cycle IV
Invalidation points: Above 161.8% of WX
Description: TOTAL3 appears to be completing a 9 swing corrective wave and is in wave Y of WXY. In the WXY pattern W is a simple zig-zag (ABC 5-3-5), X is a triangle and Y is a simple zig-zag. The fib retracement of primary A shows the 38.2% - 50% levels clustered in the same region as the 123.6% - 161.8% trend based fib extension of WX which shows the region for a potential top of TOTAL3. If a top forms, you can expect the market cap to do at least 1:1 of wave A or 100% (measured move) in a C wave.

Alts leg upAlts are warming up for the next leg up imo ,10% up from here are to wait for short term imo . Obv breakout , range breakout . I do think a deviation above the range and come back inside has a low probbaility imo .
This is not a financial advice
Thank you
