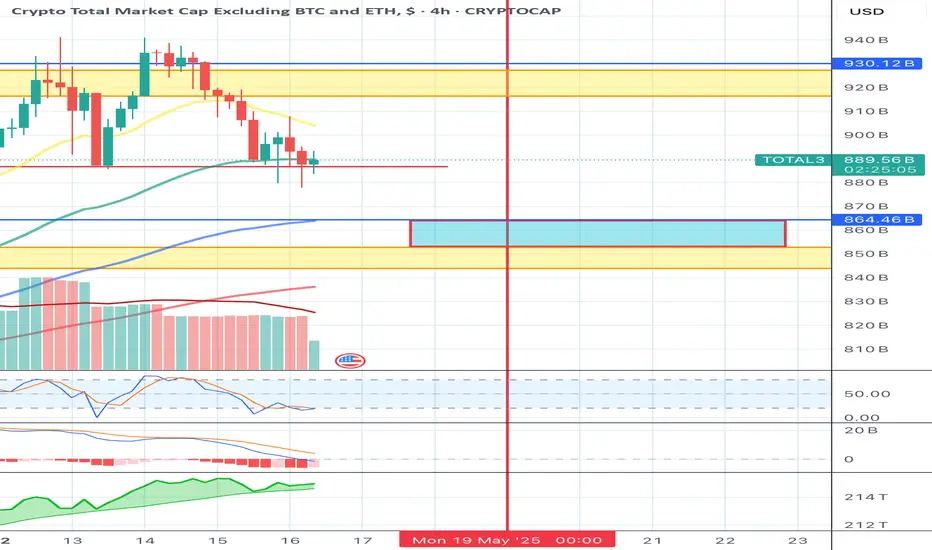
TOTAL 3 ROADMAP (3D)This analysis is an update of the analysis you see in the "Related publications" section
TOTAL3 refers to the total crypto market cap excluding Bitcoin and Ethereum.
If we zoom out and observe what altcoins are doing, we might gain better control over the market.
We know that in the past few days, there have been heavy pump-and-dump moves that have hunted liquidity.
From the point where we placed the red arrow, it appears that a correction in TOTAL3 has begun. This correction seems to be forming a flat pattern, and we are currently in wave B of that flat. Wave B itself appears to be a diagonal (diametric), and we are now in wave F of it.
The triangle from the previous analysis is actually the triangle of wave F, and altcoins have turned red as they are likely in wave e of this triangle.
Wave g of B is expected to start soon (from the green zone), and a bullish rally could follow.
After this rally, price may enter a deeper correction equal in size to wave A, forming a large wave C | a move that could take over 423 days to complete.
This seems to be the roadmap for TOTAL3.
For risk management, please don't forget stop loss and capital management
Comment if you have any questions
Thank You
TOTAL3 trade ideas

Has the Alt Season Started?Cash Data 1W
By analyzing the weekly Cash Data chart of TOTAL3, we observe that after a rapid and significant rise, a correction in TOTAL3 has begun, which appears to be forming a Neutral Triangle pattern.
Wave Analysis:
Wave-(c) is a double pattern with a small X-wave, making it the most complex wave. However, there is a possibility that wave-(d) could become more complex than wave-(c). We are currently in wave-(d). Given that wave-(b) has surpassed the start of wave-(a) and wave-(c) has been fully retraced by wave-(d), there is a likelihood that a Running Neutral Triangle is forming. For confirmation, wave-(d) must exceed the starting point of wave-(c).
Conclusion:
Based on the analysis, wave-(d) could rise to the range of 1.14–1.38 trillion USD. Subsequently, wave-(e) will begin and may conclude within the retracement zones identified on the chart. To accurately determine the target for wave-(e), we need wave-(d) to complete, allowing us to predict the end of the Running Neutral Triangle with greater precision.
After the completion of the Running Neutral Triangle, we expect a significant rally in altcoins.
Good luck
NEoWave Chart

Market Pump, real or fake news?The pump is likely to begin again around the blue zone on May 19th. You might witness an unexpected surge in the #Altcoins market.
I hold(From Large to Small): CRYPTOCAP:SOL CRYPTOCAP:SUI CRYPTOCAP:ETH CRYPTOCAP:ADA CRYPTOCAP:XRP
Memecoins: $NAIIVE CA:0xB21b24F12c6125487a33fCF96aB06a5c74114444
Altcoin Market Holding Strong – Breakout on the Horizon!📈🚀 Altcoin Market Holding Strong – Breakout on the Horizon! 🌈📊
Hey Traders!
The altcoin market is gearing up for a powerful breakout! TOTAL3 (the altcoin market cap excluding BTC and ETH) is holding perfectly above the critical $893B support zone. This is exactly the kind of price action we expect before major upside explosions!
📊 Key Levels to Watch:
📍 Support Holding Strong: $893B – Bulls are defending this level with conviction.
🚀 Breakout Zone: A clear move above $900B sets the stage for a rapid surge toward $1.13 Trillion, a potential +25% rally!
✅ The structure is bullish, momentum is building, and the charts don’t lie—this market wants higher!
📚 Why This Time Feels Different:
BTC dominance is struggling at resistance—this is the perfect environment for altcoins to shine! 🌟
Real crypto projects are finally starting to show strength amid all the meme coin noise.
We’ve seen this setup before… and it led to explosive alt rallies. History may not repeat perfectly, but it sure loves to rhyme! 🎯
💬 Your Next Move:
Are you already positioned for this altseason breakout, or planning your entries now?
Which altcoins are you most bullish on for this run to $1.13T and beyond?
This is the moment serious traders wait for—don’t let it slip by! The market is loading the rocket… will you be on it when it takes off? 🚀
One Love,
The FXPROFESSOR 💙

Altcoins Market Consolidation until 19th May 2025Total3 (Altcoins market cap) is currently consolidating between $900b-$930b expected until 19th May 2025 before the market continue to climb, just as I pointed out in last week’s analysis. No need to worry, #Altcoinseason is already here. A healthy correction is better than none.

Time to take some profit in alts (if you didn't already - I did)Alts vs ETH got quite overextended but we rejected that deviation and are now holding at the same resistance that marked the prior two cycle tops.
I sense a pullback is coming soon and we will likely revisit the 280M level.
Be careful out there!

others altcoins MAKE ALTCOINS GREAT AGAIN 🧲💹
Others monthly handle cup neck part tested and on the rise

Waiting for Altseason?Hey traders and investors!
🚀 Overview of the Altcoin Market without BTC & ETH (TOTAL3)
📊 Volume Analysis of TOTAL3:
Previous POC: $1.7 trillion — the level where volumes accumulated after the last rally and correction.
Current POC: $820 billion — the level where major volumes have concentrated over the past 5 weeks. This is 10% below the current market cap.
To the Previous POC: There's still 19% potential upside to reach the previous POC.
📈 What Does It Mean?
The shift in POC downwards suggests buyers are active at $820 billion, potentially forming a new support zone and a point for continued growth.
💬 What do you think — a signal for growth or just calm before another drop? Share your thoughts in the comments!
Wishing you profitable trades!

ALTSEASON: Market to skyrocket to a 1.6 Trillion cap.The Cycle's Channel Up on the Crypto Total Market Cap (exc BTC and ETH) technically started its new bullish wave, which is translated to what is known as an altseason. Based on this chart, it is expected to rise by at least +139%, bringing the market to a $1.6 Trillion cap. Time to invest heavily in altcoins.
## If you like our free content follow our profile to get more daily ideas. ##
## Comments and likes are greatly appreciated. ##

From Disbelief to Opportunity: Altcoin Market Flashes a Classic The altcoin market is currently holding above a critical support level—previously a strong resistance zone from March–April 2024—now sitting around $790 billion. This level once marked a ceiling before the market surged to its $1.16 trillion peak in December 2025.
What’s particularly compelling is the breakout from a wedge pattern that had been forming since that December top. With a solid horizontal base and this technical breakout in place, the structure hints at a potential move back toward the previous highs—signaling a promising opportunity in quality altcoins.
Meanwhile, Bitcoin is testing a major resistance level that once acted as a sideways range support between November 2024 and February 2025. Price has now re-entered that range, and BTC dominance (BTC.D), currently hovering above 64%, has been in a strong uptrend since 2022. However, a shift in dominance—should it begin to decline—could mark the start of a long-awaited altseason.
Yes, altcoins might be one of the least favored topics in the current climate—but historically, disbelief has often been the foundation of great opportunities. The market’s psychology at times like these rewards those who position early, not late.
Let’s see how the price action unfolds from here.
#TRUETIDE🌊

OLD BEAR TRAPBEAR TRAP smart money possibly using recycled liquidity to hype up the market and sell off inti stregnth

This is crazy! Total3-USDT Monthly chart
Yellow lines: Tops of past 3 cycles
Blue arrows: Where the bottom occured ... this is crazy. You can't make this stuff up.

Are small caps about to bounce?TOTAL3 looks poised for a major upturn. Don't give up on Altcoin Season! No financial advice!
Altcoin Breakout or Breakdown? Key Levels Ahead🤔📉📈 Altcoin Breakout or Breakdown? Key Levels Ahead 🚨🧠
Hey Traders! Let’s talk about what’s really going on in the altcoin scene 👀
We’re still in a heavy Bitcoin-dominated market (BTC.D at 64%), but TOTAL3—the market cap for altcoins excluding BTC and ETH—is setting up for something big.
📊 We’re currently trading in a tight range between $740B support and $779B resistance—both key Fibonacci levels. Sound familiar? That’s because we were in the exact same range back on Nov 24, right before a major move! 🌀
➡️ A confirmed breakout above $780B could send TOTAL3 surging toward the next major resistance at $929B.
⬅️ But if $740B breaks, we’re eyeing a move down to $641B, where crucial trendline support comes into play.
Zooming out, altcoins are still licking their wounds from the trillion-dollar highs. The space has been wild: Trump tokens, meme coin madness, the OM token collapse—volatility is the name of the game. But are you still bullish on real, utility-driven projects?
💬 Let’s discuss:
Are you riding this altcoin wave, or sitting on the sidelines until the storm passes?
Do you have faith in 'Crypto' and can the good projects make history, or will the market suffer indefinitely from Presidents launching meme tokens, Fartcoins and Pumpfuns dominating a space with no ethics or loyalty?
🔗 Check the chart and share your thoughts below.
One Love,
The FXPROFESSOR 💙

TOTAL3 looks good!We've got a breakout on the weekly chart for TOTAL3. We may see a few weeks of sideways movement, but this breakout looks legit.


Altcoins, Crypto is different since institutions came inHow long have we been saying this? Yet the masses have not grasped this concept. Neother have influencers. But that makes sense because they need clicks to survive. People tend to "graze" where pasture seems greener, even if it isn't.
CRYPTOCAP:TOTAL 3 = NO CRYPTOCAP:BTC or CRYPTOCAP:ETH
Altcoins have been in a steady incline since Nov 23.
Daily
The last 2 consolidation phases lasted AROUND 6 months, depending on where you begin the consolidation phase.
Weekly
Not important going further as Crypto landscape has changed & the back data is irrelevant. However, let's be nosey & see how it looks in comparison.

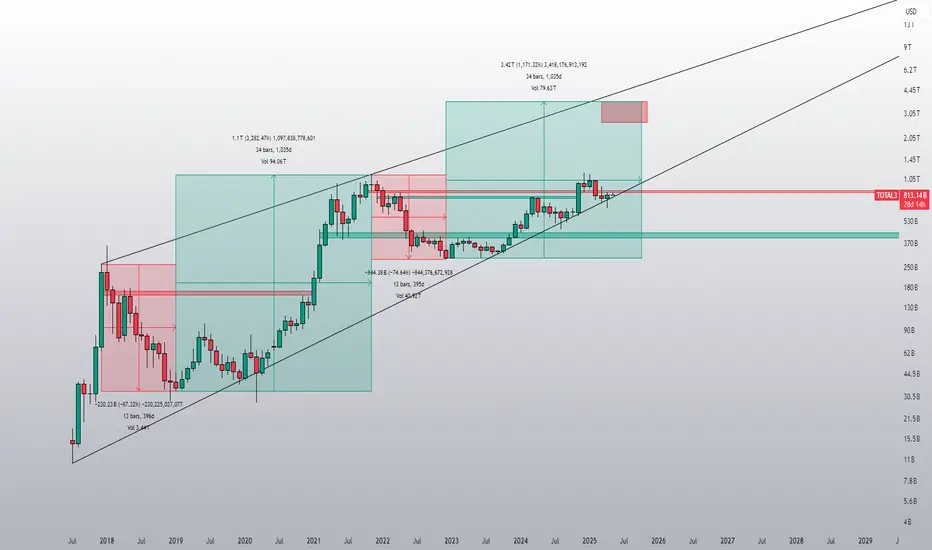
Total 3, do flags point to the target area?Welcome back dearest reader,
Today i have a very interesting analysis for you, quite some valuable time was put into this.
What i've noticed is the following:
-From april 2021 untill july 2021 total 3 has been trading in a bullish wedge flag, when we continue the lines on the full candle bodies the apex pointed to the top of that flag durationwise
-August 2022 till october 2023, extend the trendlines, apex march 2024, look up. Oh.
-March 2024, october 2024 --> apex december 2024, look up. Oh.
Now:
-January 2025, april/may 2025, apex june 2025, look up. Oh.
-I used the fractal from july 2021 as i think we're in this period
-Upward sloping channel from october 2022 untill now could provide insights as to what the target price might be, HH and HL
Target: 1.5T
Also check out my BTC.D idea, these would coincide perfectly
~Rustle
Is it certain this will happen? No-one has a glass ball, all we have are patterns based on past performance, this is no guarantee. But it does look good.

Altcoin Market Update – April 24, 2025As of today, the TOTAL3 Index (excluding BTC & ETH) offers key insights into the altcoin market:
⸻
Technical Overview:
• 1D: -1.54% → Minor pullback
• 1W: +6.37% → Bullish momentum
• 1M: -4.14% → Mid-term correction
• 6M: +32.94% → Strong growth
#TOTAL3 remains above $790B, a critical support. Holding this level is vital for future altcoin rally targets like $1.16T and beyond.
Bullish divergence on the TOTAL3/BTC chart hints at altcoins gaining strength over BTC.
⸻
Fundamentals:
• The global crypto market cap is $3.03T
• BTC & ETH dominate, but TOTAL3 reflects altcoin potential
⸻
Summary:
Altcoin market remains optimistic, with solid long-term signals. Keep an eye on support zones and momentum indicators for your trading strategy.

$Total3 alts about to go on their biggest run yet to $2.2T+I know everyone's been extremely down on crypto because alts have been down, but the chart looks very bullish from the lows.
As you can see, we've been consolidating in a channel and it looks like we're set to fall to the $448B - $581B region. After we find support there, we'll start the biggest leg of the cycle thus far.
I think it's very likely that we'll make it up to the $2.2T region during the next run. For context, the entire crypto market is sitting at $2.5T right now. That means alts alone should nearly equal the entire crypto market by the end of this cycle.
However, there's a possibility that the cycle can extend higher to the upper resistances as well.
Let's see how it plays out over the coming years. Lots of money to be made on the upside here.
This run will be the equivalent to getting into bitcoin early.

Beautiful TA played out. That was initiation for many Alt LONGsLook at this TA from 2 days ago, then you will understand my Alt LONGs.
Despite BTC D. made higher highs, but Alts moved up too.
7.5 % till now🎯 👌 😎
In Update, I will paste the Alts LONGs ;).
Original TA from 2 days ago:
Follow for more ideas/Signals.💲
Just donate some of your profit to Animal rights or other charity :)✌️

TOTAL3 Set to Explode: Altcoin Season Incoming? (12H)TOTAL3 refers to the total crypto market cap excluding Bitcoin and Ethereum.
The correction of TOTAL3 started from the point where we placed the red arrow on the chart.
It seems to have formed a triangle, and wave C now appears to be complete.
As long as the demand zone holds, it can move up toward the supply box and complete wave D.
After hitting the red box, a drop is expected for wave E — followed by the main bullish move.
Altcoins seem ready for a strong move; let’s see how it plays out.
A weekly candle close below the invalidation level will invalidate this analysis.
For risk management, please don't forget stop loss and capital management
When we reach the first target, save some profit and then change the stop to entry
Comment if you have any questions
Thank You

$TOTAL3 Breakout Altcoins breakout loading?
TOTAL3 (Crypto market cap excl. BTC & ETH)
breaking out of a falling wedge.
Target: $1.16T +51%
All-time high in sight. 👀
