Alt Coin PartyMy idea is that we have a Altcoin party in front of us that has the potential to grow 100% for Altcoins !!! What do you think?!
TOTAL3 trade ideas

PLain and SImple TOTAL 3 is the cryptomarket cap without BTC, ETH looks like a bullish divergence is forming and it looks like we will have one more retracement down as a liquidity pull before starting a new cycle

🔥 Altcoin Marketcap: Early Inverse Head & Shoulder PatternTOTAL3 is the total crypto marketcap minus BTC and ETH marketcaps, so we're looking at all altcoins here.
The alts are showing early signs of an inverse head & shoulders pattern, which is classically a bullish reversal pattern.
Overall, I think that BTC is still trading in a bear-flag formation until proven otherwise, so I'm not looking for an entry at this moment. See below for info:
However, if both BTC manage to break out on the bullish sides of their respective patterns we can deduce that they've confirmed their bullish reversal and that we might see more bullish price action in the coming months.
For now, keep an eye on the neck-line resistance. A bullish break out from there might signal further strength.
Happy trading!

TOTAL.3-4HAs you can see, there is a double bottom pattern is forming, 730B neckline must be broken and price must hang above it by closing 4H candles.
But I'm still not convinced that this is the rally that will take us to 50k, BTC is so weak and fragile. Still, I will trade it if neckline breaks.
NFA, DYOR.

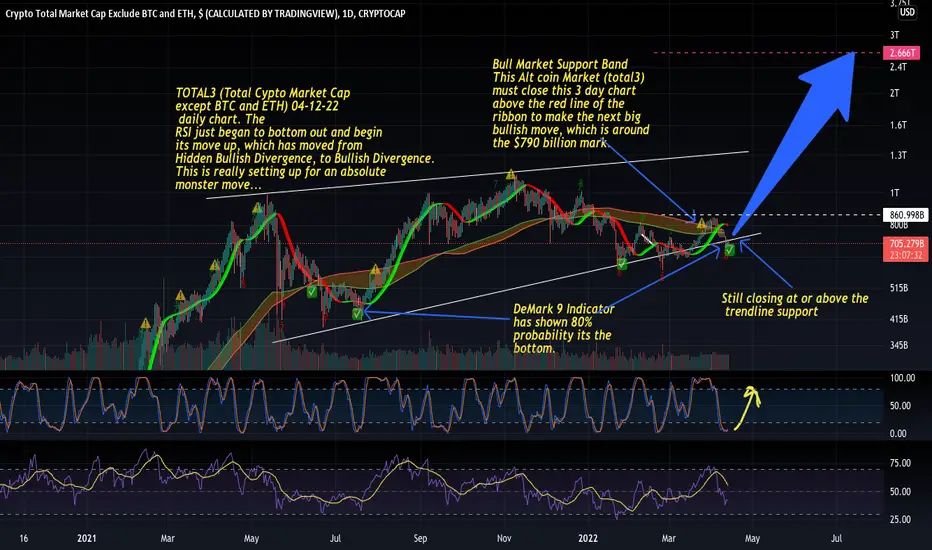
TOTAL3 daily remains at the bottom of the trendline but?TOTAL3 (Total Cypto Market Cap
except BTC and ETH) 04-12-22
daily chart. The
RSI just began to bottom out and begin
its move up, which has moved from
Hidden Bullish Divergence, to Bullish Divergence.
This is really setting up for an absolute
monster move...
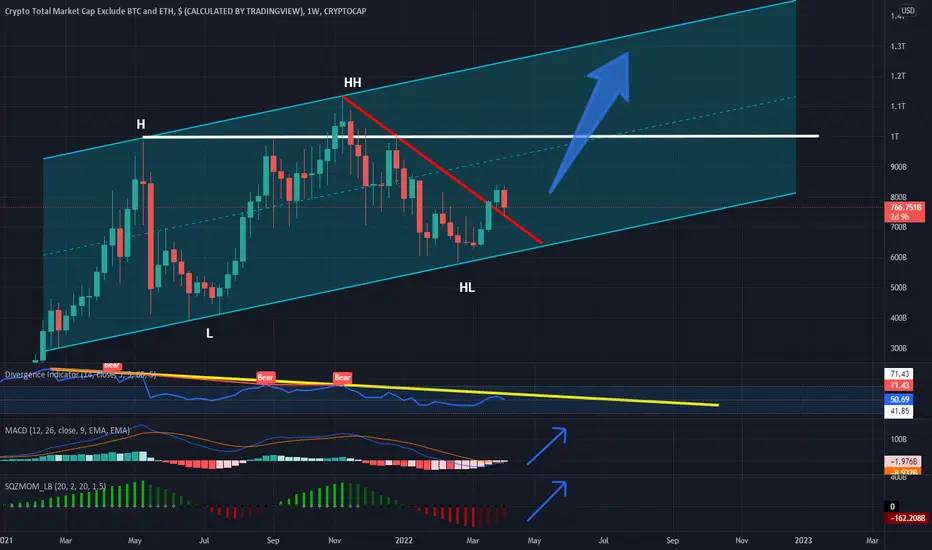
TOTAL3 Alts looking refueled for another runTotal3 is creating higher highs and higher lows within a parallel channel.
Weekly MACD is ready to cross bullish. Looking for a break above $1T MCap and then to the upper channel this summer.
Price Trend breakout is confirming exit. Weekly RSI still needs to breakout.
Good Luck
ALT coin market cap thoughts. I believe there might be another ALT mini season on the way, bounced nicely on the 382 and look to be gaining dominance against ETH and BTC

total 3 3 day chart is ready to explodeTOTAL3 (Total Cypto Market Cap
except BTC and ETH) 04-07-22
3 day chart. The
RSI just began to bottom out and begin
its move up, which has moved from
Hidden Bullish Divergence, to Bullish Divergence.
This is really setting up for an absolute
monster move...

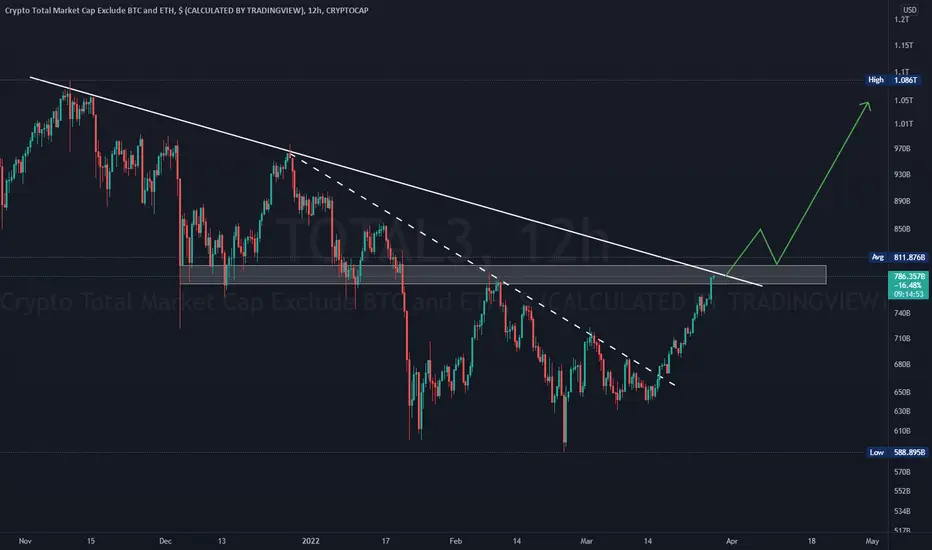
total3 crypto marketcapmaybe retest 705B level and hold up this zone..
if break 705B level confirmed bear season for altcoins...
step by step first 705B hold second 838B level attack maybe break and hold everything will pump..:)))))

An ABCD BAMM Hints $540B Will Be Added to Small & Mid Cap CoinsThis is total 3 and it tracks the total market cap of all the Cryptocurrencies combined Excluding BTC and ETH and there is currently Hidden Bullish Divergence on the weekly and a potential AB=CD Pattern in development that if it plays out would add around 540 Billion Dollars to the Total 3 market cap taking us to the top of the channel where we may then face a greater reversal.

TOTAL3 retest at 720b.TOTAL3 retest at 720b. TOTAL3 retest at 720b. TOTAL3 retest at 720b. TOTAL3 retest at 720b.

TOTAL CRYPTO-CAP, Paramount Formation With Pennant-Potential!Hello,
Welcome to this analysis about the Total Cryptocurrency Market-Cap on the 3-day timeframe perspective. Many determining factors in recent times have contributed to important developments in the Cryptocurrency Field in the recent times. In this case Cryptocurrency is getting more and more public mainstream attention as institutions as well as old economy participants moving into Cryptocurrency. In this case it is also important to take the technical aspects into consideration and therefore I detected important factors that will alter the whole dynamics in the next time. Therefore I detected the most important formational structures, price-levels, and upcoming determinations to consider here. As when looking at my chart now we can watch there how the Total Cryptocurrency Market-Cap is building this huge descending triangle formation with important supports within the structure and the coherent wave-count from A to C that has been already completed. Now the Total Cryptocurrency Market-Cap bounced within the lower boundary of the triangle and also matched with the momentous ascending trend line marked in blue in which the asset also bounced. Besides that the Total Cryptocurrency Market-Cap is holding greatly above the 65-EMA as well as 20-EMA and there is a high likelihood possibility given that the Total Cryptocurrency Market-Cap from here on shows up with a breakout above the upper boundary of the formation which will activate the further developments. In this case, the first target will be the initial target-zone and when this has been reached and the Total Cryptocurrency Market-Cap has developed strongly enough then the Wave-C-Extension-Target-Zone will be the next target to be pointed, it will be an interesting development ahead.
In this manner, thank you for watching the analysis, all the best!
"There are many roads to prosperity, but one must be taken."
Information provided is only educational and should not be used to take action in the markets.

ALTCOINS LOADED!!Extremely bullish sentiments for ALTCOIN cycle.
- Wave 5 of the Elliot Wave cycle is ready to pump it!
- MACD looks to be converging in 1 week
- RSI has broken the trend
We should see tons of action in APRIL!

TOTAL3 is getting even more bullish!TOTAL3 (Total Cypto Market Cap
except BTC and ETH) 03-28-22
3 day chart. The
RSI just began to bottom out and begin
its move up, which has moved from
Hidden Bullish Divergence, to Bullish Divergence.
This is really setting up for an absolute
monster move...

#Altcoin MarketCap TOTAL3 after breaking the small daily trendline now its ready to break above the massive trendline.
Expecting another wave to start after this breakout!
Altcoin Season after real breakoutWe have two trendlines here, the important hasn't been brake and it is the same as the bull band for ALTCOINS so we might see a consolidation here before breaking out which may mean a few more weaks of CRYPTOCAP:BTC.D BTC Dominance breaking up and ETH following stronger as CRYPTOCAP:TOTAL2 already broke those trends.
Trade smart, wait for confirmations.
