Flag patternI don't know about you, but I can't believe that after all this time of decline for altcoins, they will continue to decline... Even in terms of time, we have to climb, I don't know how, but soon the money will come into this season... Unlike most analysts, I am more hopeful for the continuation of the path.
TOTAL3 trade ideas

based on the history! this is my market cap and dates it's not a financial advice! do your own due diligence
based on the last alts-season we had1- 1000 days between the bottom and the top
2- we gained around 20x the market cap
my scenario: suppose this season of 2025 we get a big pump specially with the countries, intuitions & banks interest into crypto more and more every year,
if we ever encountered same days range and HALF of the previous pump (which is 10x instead of 20x from the bottom)
result:
A: Oct2025 we will be approaching 3.5 T market cap
B: more conservative result is 5x by October 2025
which makes the top 1.8-1.9T market cap (which is double the previous alt-season market cap)
In both scenarios i don't mean your token you are holding will 5x or 10x, some coins will outperform and reach 20x even in this year.

White House Crypto Summit 2025Today on March 7th the White House will host a Crypto summit for the first time. This summit is expected to host
many prominent figures in the space, here are some of the main ones:
Michael Saylor Founder of Strategy.
● David Bailey CEO of Bitcoin Magazine.
● Matt Huang Co-founder of Paradigm.
● Zack Witkoff Co-founder of world liberty financial
● SEC Chairman Paul Atkins
● Changpeng Zhao (CZ) Co-founder of Binance.
● Kyle Samani Managing partner at Multicoin Capital.
● Anatoly Yakovenko Co-founder of Solana.
● Charles Hoskinson Co-founder of Cardano.
● Sergey Nazarov Co-founder of Chainlink.
● Brian Armstrong CEO of Coinbase.
● Vlad Tenev CEO of Robinhood.
● Arjun Sethi CEO of Kraken.
● Kris Marszalek CEO of Crypto(.)com.
● Brad Garlinghouse CEO of Ripple.
Trump is expected to sign executive orders at 3PM EST during the summit but what these orders are is not confirmed as of yet. I would speculate the "Strategic Reserve" including BTC,ETH,SOL,XRP & ADA would be an EO in some capacity as all of the founders/CEOs of those projects are in attendance. Perhaps regulatory framework, a tariff based system to reward US based crypto projects? In truth the specifics are unpredictable.
What we do know is that each of the major announcements have been sell the news events, as the saying goes "Buy the rumor, sell the news" and that has been true so far. Will this be a repeat? This summit so far has not had a rally going into this event, the charts show that BTC and the broader market have pulled back and retested last years chop range high after a liquidity sweep of previous ATH. Altcoins fairing worse than Bitcoin but structurally very similar. I do think the bearish structure of the HTF chart has many worried, sentiment is very low and many see the sell off continue. Either this is a genius way to acquire cheaper coins for the upcoming reserve or many will be caught offside or sidelined.
For now I am not taking sides, there is no clear read on this event for me but I can guarantee huge volatility on the low time frames, whether this leads to a meaningful move on the high time frames is yet to be seen.

Total3I think you should hold your altcoins, in 2 months you will be rich… We will all see the biggest altcoin season in crypto history… Exactly where everyone is disappointed…. If you remember in 2021 when Bitcoin reached $30,000 no one thought the market would come back and coins would grow again. I think the growth of altcoins is very strong… I think anyone who sells in this rally and growth will regret it

[UPDATE ALT3] Scenario i'm watching (optimistic)Let's navigate through the positive scenario of alt3.

Accumulate crypto nowHere's a 6 chart split of BTC, ETH, SOL, XRP, ADA and TOTAL3. It's a good time to go long DCA accumulate crypto while it's at support levels this week.
3 month high / low:
BTC
high = 109,358
low = 78,168
ETH
high = 4109
low = 2002
SOL
high = 295
low = 125
XRP
high = 3.40
low = 1.28
ADA
high = 1.33
low = .56
TOTAL3
high = 1.16T
low = 743B

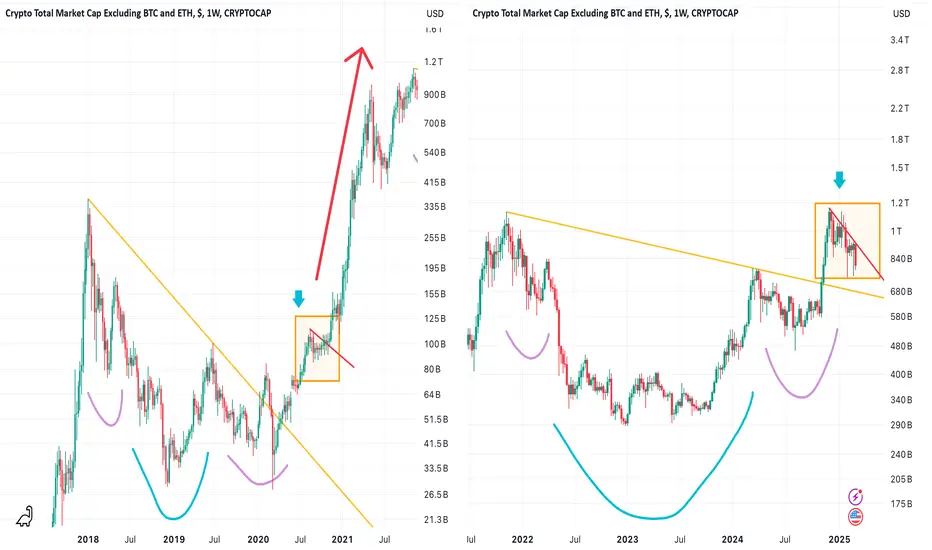
Potential Pattern for Altseason 20252020 Altcoin Season Bull Run:
Large Head & Shoulders Bottom ➡︎ Pullback ➡︎ Breakout of Downtrend Line → Massive Pump
Current Situation:
Large Head & Shoulders Bottom ➡︎ Pullback ➡︎ ❓
Do you still believe in the bull market?
Leave a comment!
🔴 Read my signature & publications for more info you don’t want to miss.
🔥 for more future "guesses" like this!

Are alts ready to take off? Let me know what you think?
Could we see incredible highs on the total3 chart?

THE PLAN WORK PERFECTLYAs the post at Feb 3 said, the market has a big potential to go down, or, you can say, CLEAR BEAR and it does happen. The reason behind this is simple:
TOTAL MARKET EQUITY has been dropping massively since then.
Why?
Instutional play, they are focusing on accumulating BTC. Yes, that shii including selling it too .
.
.
Future Forecast
Based on the current condition, we might see a move around 660 Bill. Am I positive about it? Nah, but we will see what happens. BTC has a strong demand at 78K and it shows a strong pullback. Yes, institutional keeps accumulating. Again, another BUT, the biggest area of interest for BTC is 73-67K.
Trade responsibly, take care
XCO


Will There Be an Altseason?The short answer: Maybe, but it won’t be like before.
🔹 Bitcoin’s Dominance (BTC.D) Needs to Drop
For altcoins to rally, Bitcoin’s dominance usually needs to come down. Right now, BTC.D is still high because Bitcoin ETFs have brought in strong institutional demand, keeping most of the capital in BTC. If Bitcoin slows down or stabilizes, we could start to see liquidity move into altcoins.
🔹 Memecoin Hype & Altcoin Dilution
Memecoins have been stealing the spotlight (and liquidity), making it harder for established altcoins to gain momentum. On top of that, new tokens keep launching, spreading capital across too many projects and weakening price action for altcoins.
🔹 Macro Factors & Institutional Impact
Bitcoin ETFs have brought more institutional involvement, and smart money generally favors BTC over high-risk altcoins. Plus, macroeconomic conditions—like interest rates, regulations, and trade tensions—will play a big role in whether capital flows into altcoins or stays in Bitcoin.
Unlike past cycles where most altcoins pumped together, this time the market may be more selective. Sectors like AI, DeFi, and Real-World Assets (RWA) could attract more focused capital, while weaker altcoins may struggle.
This analysis is for educational purposes only and should not be considered financial advice.

Altcoins Market Update Altcoins Market Update
The Total Crypto Market Cap (Excl. BTC & ETH) CRYPTOCAP:TOTAL3 is bouncing off the lower trendline of a descending channel!
Key Levels: Support Held: $800B
Target: MIL:1T (+25% Move)
Lower Trendline Acting as Strong Support
A breakout from this pattern could ignite ALL SEASON!
Are you positioned right? 👀

TOTAL3 - Adam & EveOn the above 2 day chart of TOTAL 3 (crypto market total excluding both Bitcoin and Ethereum markets), an Adam & Eve pattern confirms (see link below for details).
What follows next is the most exhausting sideways trading period that typically lasts a period of months ending with traders capitulating.
So the crypto market so going to crash?
The depends, are you holding XRP, DOGE, HBAR, SOL to name a few, there are some tokens that are considerably overbought with 1000-2000% extensions from the last six months. For holders of those tokens there is nothing I can do to convince them of what is about to happen.
For everything else, the outcome is actually quite positive. You either know what those tokens are or you don’t! If you don't, focus on the 8 day GRM, it tells you all you need to know.
Ww
Adam & Eve pattern:
forexbee.co

Total Market Caps inverted head & shoulder patternsHello Everyone,
On the Total Market cap grapsh incl. and excluding BTC and ETH you can clearly see that both are breaking out of an inverted Head & Shoulders pattern.
The Total Market Cap incl. BTC and ETH broke already out and is currently trying to hold support at the Fibonacci level 1.0. When this support is succesfully tested an outbreak to a 5.24T Market cap is possible.
The Total Market Cap excl. BTC and ETH is moving in a similar pattern slightly behind it. It is currently testing support in a Gold pocket zone. When this support is succesfully tested, the entire crypto market is ready to make a move up.
The patterns are very clear. There is a huge potential move up possible.

TOTAL3 potential breakup (ALT SZN?)The trend line shows key resistance from Dec 2021, which is now acting as support on TOTAL3.
Assuming this level holds as support it could indicate the early stages of a TOTAL3 breakup, or ALT Season.
In confluence, the Stochastic RSI appears to be close to crossing up (blue line over red trend line).
Should we break up, where could we see as a potential top indicator for Total3?
The blue line is a potential target, which is based on a key Fib level.
Any thoughts on this analysis? Please discuss.

Market Update: Bearish Conditions Persist, but Stability NotedCurrent Market Sentiment:
The market remains below key horizontal resistance levels and trendlines, continuing to show bearish behavior.
Despite the negative sentiment, the recent sell-off found support around the $850B level, suggesting there is buying interest or at least some stability at this critical support zone.
Altcoin Focus:
For altcoins, the next significant shift will come if price action breaks above the 50-day and 100-day moving averages.
These moving averages serve as dynamic resistance, and a clean break above them would indicate strengthening bullish momentum and potential for further upside.
Caution Ahead:
Until we see a clear break of the moving averages and key resistance levels, a cautious stance is warranted. Traders should watch for signs of continued consolidation or a break to the downside if support does not hold.
Key Takeaways:
Support at $850B remains critical.
Breakout signals for altcoins lie in a move above the 50-day and 100-day moving averages.
Caution is advised until price action confirms a bullish shift.


ALTCOINS This is the final bullish call.The altcoin market has found support two weeks ago on the 1week MA50.
Even though it is pulling back this week, the new bottom has been formed and the Channel Up should now extend the Cycle and its final Bullish Leg.
The previous Cycle topped just under the 1.5 Fibonacci extension.
With the 1week RSI about to turn neutral, the trend now favors buying again.
We expect to see the market at 2 Trillion (just under the 1.5 Fib).
Follow us, like the idea and leave a comment below!!


TOTAL3 Update.The total has successfully met my initial target, but I've identified two new scenarios that could still align with my longer-term expectations. Currently, the total is exhibiting a pattern on the lower timeframes that could lead to either a bullish or bearish breakout. A bullish breakout could propel the price to the upper boundary of the longer-term pattern at 1.6 trillion, or potentially form a double top. Conversely, a bearish breakout could see total3 decline to 460 billion, facing resistance at 530 billion. If that level is breached, the next resistance would be at 780 billion, which aligns with a head and shoulders pattern. Should this pattern also break (specifically the left shoulder), we could anticipate new highs. If it fails, we may need to prepare for the next phase of the bear market, with total3 potentially dropping to 400 trillion before a new bull market emerges. Additionally, I recommend examining the higher timeframes, as they reveal a classic Inverted Head and Shoulders pattern, with targets consistent with the clear pattern illustrated in my chart, providing two confirmations for my analysis.

High Liquidity Zone CRYPTOCAP:TOTAL3
Working through a high liquidity zone...
Price found resistance at the liquidity line a few days back and currently being held up by another liquidity support structure.
Pressure is building in this area; it's bound to pop somewhere.
I have color coded each fib pivot to correspond to the fib structure to help avoid confusion.
As my instructor dRends35 mentioned - if the correction phase continues downward; a possible outcome is a retracement to the 0.618 Golden Window Support structure.
I am favoring those odds as well. This would be a solid area for support. If there is something else in the MM's playbook, I would not be surprised if a lower low was in the books as well.
If that play is called, I would expect the 1:1618 (teal colored support structure) to be the area for that, as this is a Phi based fib.
Overall, I think the market is looking very exciting. ETH/BTC and ADA/BTC are currently moving (to the upside) in opposite directions of BTC. Some small signs that the tables are turning.
Good Luck Traders!
- Not Financial Advice -

TOTAL3🔴 Total 3 Index
Currently, the weekly support box and the key level of $800 billion have been maintained after a fake breakout.
If the index can establish a base at this level, we can remain hopeful for the formation of the final bullish leg (W5) with the goal of reaching a new ATH . This would allow some top-market altcoins to move in line with their pattern completion and recover.
