EBA trade ideas


EBAY LongEBAY 1-3 Week Horizon
Price has been on a bull run for the past few months. It first created bearish channel (blue) and a new bullish channel (green). It broke the bearish channel (blue), retested it and gapped up. It gapped up enough to break bullish channel (green) . It is now forming a bull flag just above the bullish channel (green) and it might retest channel boundary (like it did on last channel) and move up more.
The buy zone has a confluence of 60.68 key support, 21ema (blue), bullish channel (green) boundary, and 38.20% fib. In my opinion, a good buy zone. Stop loss at 59.79 (-2%, just below key support and 21ema) and target1 at 67.38 (10%) a good 5:1 risk reward ratio.
Disclaimer
I am not a registered investment professional. These are just my opinion and not an investment advise or recommendation. For entertainment purposes only.


EBAY, watch for break of this pennant for continuationEBAY beat earnings and made a move up. Expecting it to continue higher with a break of this pennant.

$EBAY | Triangle Consolidation After Daily Bull Flag Breakout $EBAY formed a bullish triangle after breaking out of a large daily bull flag. Watch for a breakout for continuation higher. See my previous $EBAY ideas below.
Let me know what you think in the comments and leave a like if you agree with my analysis! 👍🏽

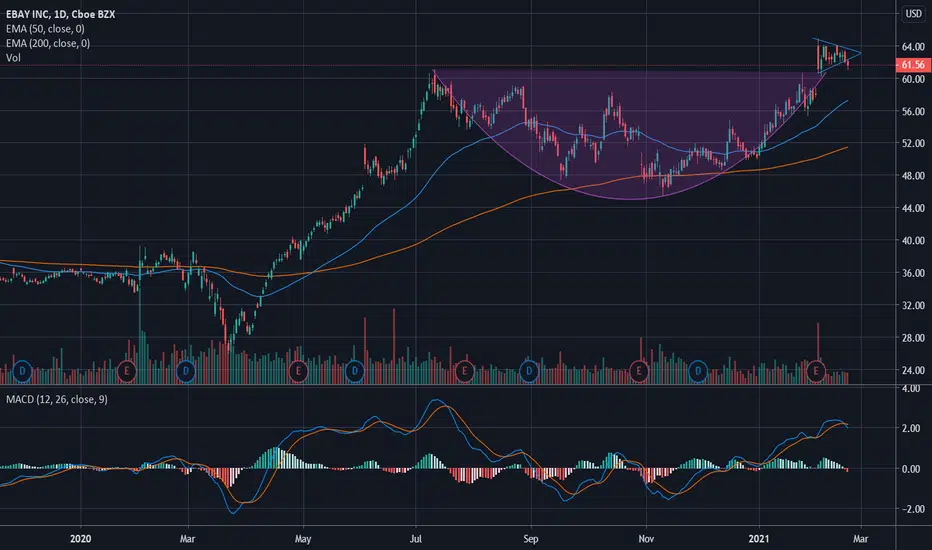
Long EbayBowl formation with recent breakout and confirmation. We are now in price discovery with price target at $77/share.


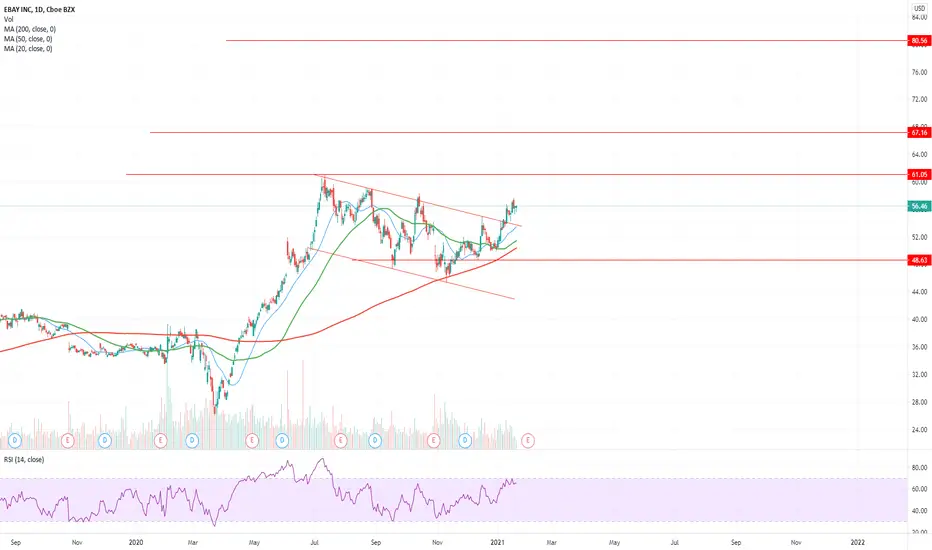
$EBAY Bullish trend$EBAY broke out the downtrend line. The earning report was good and the target is $70. But first it need to be cool down a little.

Ebay is ready for a new bull runNASDAQ:EBAY is breaking out and heading higher, targets are shown on the chart. I think this stock is cheap and deserves a considerably higher price. Stop around 44$.
Hit the like button and follow if you find this useful :)
This is only my own view and not financial advice, do your own analysis before buying or selling
Happy Trading!
EBAY WEEKLY -- $80 TARGETPretty simple trade--Solid earnings release / breakout from triangle. Measured move / Fib levels put us around $80 mid-2021. Always use stops!

$EBAY | Daily Bull Flag Breakout [Earnings Today After Close!]Ebay broke out of a daily bull flag and looks ready for continuation higher.
Earnings report is today after market close so longs are risky.
Goodluck!
Let me know what you think in the comments and leave a like if you agree with my analysis! 👍🏽


EBAYEBAY 1-2 week horizon
Around a month ago, price action broke downward channel (blue) and creating a new bullish channel (green). We have support at 54.87 but MACD overall is bullish but lines are kissing pointing down and stochastics are not yet at oversold levels. There is a chance that 54.87 support will break and with this I am anticipating price to go down for the next few days with pivot area around 50ema (53.78 area).
The 50ema area also happens to be around the top boundary of the down channel it was previously trading which could act as a support. 68.1% Fibonacci level at around 53.91 area (around 50ema). This area of support seems to be a strong one since multiple indicators agreeing at the same area of support.
Stop at 51.86, a good 4:1 risk reward ration at target 2. The only wild card is ER on Feb 3
Disclaimer
I am not a registered investment advisor and do not offer investment advice and recommendation. All my post is not a recommendation, advise nor a suggestion and should not be used as a replacement for investment advice from a qualified licensed professional. All my post is for, information and entrainment purposes only. You, the reader, bear full responsibility for your own investment and trade decisions and should seek the advice of a qualified securities professional before making any investment or trade.


Inverse Head and Shoulders Earnings 2-3 AMCNo rising wedges in the yearly chart..
Possible stop under right shoulder
RS 48.93 A closer place that may work is under 52.40 which makes the risk a bit lower
LS is 47.44
Head 45.36
This would be a relatively low risk trade in the schme of things if everything goes okay, just we never know..it has broken the neckline already..
Looking at risk/reward can help you choose trades where you can get the most gain with the least risk. I look at a trade sometimes and I know it will most likely work out, but the reward is too low to make it worth my while tying up my money on the trade. If you are ultra rich, I guess it does not matter cos you have so much money anyway (o:
I just noticed EBAY is in a long, but slow uptrend..NV and OBV are high..
Not a recommendation/Just an observation

