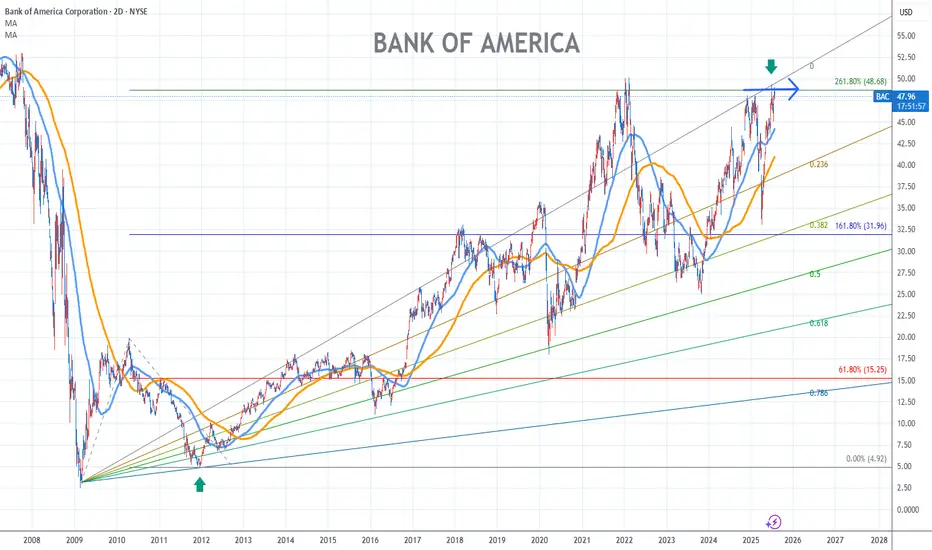
Bank of America Stock Chart Fibonacci Analysis 073025
Hit the 48.7/261.80% resistance level.
Trading Idea
Chart time frame:D
A) 15 min(1W-3M)
B) 1 hr(3M-6M)
C) 4 hr(6M-1year)
D) 1 day(1-3years)
Stock progress:E
A) Keep rising over 61.80% resistance
B) 61.80% resistance
C) 61.80% support
D) Hit the bottom
E) Hit the top
Stocks rise as they rise from support and fall from resistance. Our goal is to find a low support point and enter. It can be referred to as buying at the pullback point. The pullback point can be found with a Fibonacci extension of 61.80%. This is a step to find entry level. 1) Find a triangle (Fibonacci Speed Fan Line) that connects the high (resistance) and low (support) points of the stock in progress, where it is continuously expressed as a Slingshot, 2) and create a Fibonacci extension level for the first rising wave from the start point of slingshot pattern.
When the current price goes over 61.80% level , that can be a good entry point, especially if the SMA 100 and 200 curves are gathered together at 61.80%, it is a very good entry point.
As a great help, tradingview provides these Fibonacci speed fan lines and extension levels with ease. So if you use the Fibonacci fan line, the extension level, and the SMA 100/200 curve well, you can find an entry point for the stock market. At least you have to enter at this low point to avoid trading failure, and if you are skilled at entering this low point, with fibonacci6180 technique, your reading skill to chart will be greatly improved.
If you want to do day trading, please set the time frame to 5 minutes or 15 minutes, and you will see many of the low point of rising stocks.
If want to prefer long term range trading, you can set the time frame to 1 hr or 1 day.
NCB trade ideas
Bank of America Wave Analysis – 18 July 2025- Bank of America reversed from support area
- Likely to rise to resistance level 40550.00
Bank of America recently reversed up with the daily Morning Star from the support area located between the support level 45.00 (former resistance from May and June) and the lower daily Bollinger Band.
This support area was further strengthened by the 38.2% Fibonacci correction of the earlier upward impulse from April.
Given the clear daily uptrend, Bank of America can be expected to rise to the next resistance level 49.23 (top of the previous impulse wave 1).

Bank of America Wave Analysis – 9 July 2025
- Bank of America reversed from resistance area
- Likely to fall to support level 45.00
Bank of America recently reversed down from the resistance area located between the long-term resistance level 50.00 (which started the weekly downtrend at the start of 2022) and the upper weekly Bollinger Band.
The downward reversal from this resistance area stopped the previous intermediate impulse wave (3) from the start of 2025.
Given the strength of the resistance level 50.00 and the overbought weekly Stochastic Bank of America can be expected to fall to the next support level 45.00.

BAC – Building the Base for a Breakout?Bank of America (BAC) has been consolidating quietly, attracting attention as it sits near a key mid-range level. With a 52-week low of $33.06 and a 52-week high of $48.08, the stock currently trades around $36.92 – roughly 11% above its low and 23% below its high.
This setup could be the calm before the move.
💥 Technical Outlook & Strategy
With financials holding steady and macro headwinds softening, BAC might offer a solid swing trade or medium-term positioning opportunity.
📌 Entry Points to Watch
$36.90 – Market price, if volume picks up near support
$33.30 – Prior breakout area and potential pullback support
$30.50 – Strong support and near the 52-week low for aggressive buyers
🎯 Target Levels
$39.80 – Short-term resistance; previous rejection zone
$43.50 – Fib retracement from the high, medium-term target
$47.50–48.00 – 52-week high retest, bullish scenario
🧠 Narrative to Watch
With potential Fed pauses on rate hikes, improving margins, and relative stability in U.S. banks, BAC could be positioning for a slow grind higher. Watch for earnings momentum and bond yield trends.
⚠️ Disclaimer
This analysis is for informational and educational purposes only and does not constitute financial advice. Always do your own research or consult with a licensed financial advisor before making trading decisions.

BANK OF AMERICA INCOMING BREAKOUTNYSE:BAC weekly cup and handle pattern approaching breakout...
Do you see what I see?
A weekly candle close over $50 can send this to $70.
Keep it on your radar.
-READ THE CHARTS 7/5/2025

Bank of America Wave Analysis – 1 July 2025
- Bank of America reached resistance level 48.00
- Likely to fall to support level 46.00
Bank of America recently reached the powerful multi-month resistance level 48.00, which has been reversing the price from last November.
The resistance zone near the resistance level 48.00 is strengthened by the upper daily Bollinger Band.
Given the strength of the resistance level 48.00 and the overbought daily Stochastic, Bank of America can be expected to fall to the next support level 46.00.

BAC Targeting ATHBank of America is targeting new all-time highs (currently at 50.11, purple line).
The gray zone at 48.00 could offer some resistance for a short term pullback. This could be an opportunity for long trades (right now, RSI is overextended at 76).

Bank of America: Potential BreakoutBank of America squeezed into a range, and now it may be breaking out.
The first pattern on today’s chart is $44.84, the high on March 4 as the megabank gapped lower.
It spent more than a month pushing against that level while making higher lows. The resulting ascending triangle is a potentially bullish continuation pattern.
Second, BAC closed above the resistance on Friday and is now potentially entering the gap from March 4. Is a breakout underway?
Third, Bollinger Bandwidth has narrowed. That may create potential for prices to expand following a period of compression.
Next, the 8-day exponential moving average (EMA) has remained above the 21-day EMA. Prices have also held above their 200-day simple moving average. Those signals may reflect bullishness in the short and long terms.
Finally, BAC is an active underlier in the options market. Its 122,000 average daily contracts in the last month rank 23rd in the S&P 500, according to TradeStation data. That could help traders take positions with calls and puts.
Check out TradingView's The Leap competition sponsored by TradeStation.
TradeStation has, for decades, advanced the trading industry, providing access to stocks, options and futures. If you're born to trade, we could be for you. See our Overview for more.
Past performance, whether actual or indicated by historical tests of strategies, is no guarantee of future performance or success. There is a possibility that you may sustain a loss equal to or greater than your entire investment regardless of which asset class you trade (equities, options or futures); therefore, you should not invest or risk money that you cannot afford to lose. Online trading is not suitable for all investors. View the document titled Characteristics and Risks of Standardized Options at www.TradeStation.com . Before trading any asset class, customers must read the relevant risk disclosure statements on www.TradeStation.com . System access and trade placement and execution may be delayed or fail due to market volatility and volume, quote delays, system and software errors, Internet traffic, outages and other factors.
Securities and futures trading is offered to self-directed customers by TradeStation Securities, Inc., a broker-dealer registered with the Securities and Exchange Commission and a futures commission merchant licensed with the Commodity Futures Trading Commission). TradeStation Securities is a member of the Financial Industry Regulatory Authority, the National Futures Association, and a number of exchanges.
Options trading is not suitable for all investors. Your TradeStation Securities’ account application to trade options will be considered and approved or disapproved based on all relevant factors, including your trading experience. See www.TradeStation.com . Visit www.TradeStation.com for full details on the costs and fees associated with options.
Margin trading involves risks, and it is important that you fully understand those risks before trading on margin. The Margin Disclosure Statement outlines many of those risks, including that you can lose more funds than you deposit in your margin account; your brokerage firm can force the sale of securities in your account; your brokerage firm can sell your securities without contacting you; and you are not entitled to an extension of time on a margin call. Review the Margin Disclosure Statement at www.TradeStation.com .
TradeStation Securities, Inc. and TradeStation Technologies, Inc. are each wholly owned subsidiaries of TradeStation Group, Inc., both operating, and providing products and services, under the TradeStation brand and trademark. When applying for, or purchasing, accounts, subscriptions, products and services, it is important that you know which company you will be dealing with. Visit www.TradeStation.com for further important information explaining what this means.

US banks are in some kind of trouble.U.S. Banks are currently facing $482 Billion in unrealized losses, an increase of 33% from the prior quarter.
With rates now skyrocketing, these losses are going to increase. Banks, particularly small banks, are in trouble.
BAC has huge amount of gaps which are ridiculous.
In 1hr TF, there is already short signal from my own made indicator.
The net income has increased, but if you lose closely revenue has not improved, just the net margin being increased making the net income is seen to be up.
And most important, BUFFET has sold Citigroup completely, 100% out of his portfolio and imo he is the GOAT, it is better to follow his path than try to be smart by yourself.

BANK OF AMERICA: Strongest rebound since 2023 eyes $65.Bank of America is heavily bullish on its 1D technical outlook (RSI = 68.687, MACD = 1.120, ADX = 62.779) as it's on an impressive rebound since the April low, which was priced on the 0.236 Fibonacci level of the long term Channel Up that begun in December 2011. Every rally on the 0.236 Fib always hit the 0.786 Fib. Long until the end of the year, TP = 65.00.
## If you like our free content follow our profile to get more daily ideas. ##
## Comments and likes are greatly appreciated. ##

OptionsMastery: Sitting at resistance on BAC!🔉Sound on!🔉
📣Make sure to watch fullscreen!📣
Thank you as always for watching my videos. I hope that you learned something very educational! Please feel free to like, share, and comment on this post. Remember only risk what you are willing to lose. Trading is very risky but it can change your life!

Bank of America Wave Analysis – 8 May 2025
- Bank of America broke the resistance zone
- Likely to rise to resistance level 44,00
Bank of America recently broke the resistance area between the resistance level 41.35 and the 61,8% Fibonacci correction of the downward impulse from February.
The breakout of this resistance zone accelerated the active impulse wave 3 of the intermediate impulse wave (3) from the start of April.
Bank of America can be expected to rise to the next resistance level 44,00 (top of the previous correction iv from March).

BAC Holding Above EMA 200 with Strong Buyer SupportBank of America (BAC) is showing resilience:
Price is above the 209-WEEK EMA, indicating a bullish trend.
Recent down candles have occurred with high volume, suggesting that buyers are absorbing selling pressure.
This behavior often precedes upward movements, as strong hands accumulate shares during pullbacks.
Monitoring for a potential breakout if buying pressure continues.
Not financial advice – just my technical observation.
#BAC #BankOfAmerica #TechnicalAnalysis #EMA200 #VolumeAnalysis #StockMarket #TradingView

Bank of America May Face a DowntrendBank of America has rebounded sharply in recent weeks, but some traders may expect a move to the downside.
The first pattern on today’s chart is the series of lower highs since March 3. Combined with the low in early April, a falling channel may have formed.
Second is the price zone between roughly $39 and $40, which represents a basing area March 10-13. BAC is now stalling at the same level, which may suggest old support has become new resistance.
Third, stochastics on the megabank are turning down from an overbought condition.
Next, the 50-day simple moving average (SMA) had a “death cross” below the 200-day SMA earlier this month. That may indicate the long-term trend has turned negative.
Finally, BAC is a highly active underlier in the options market. That could help traders take positions with calls and puts.
TradeStation has, for decades, advanced the trading industry, providing access to stocks, options and futures. If you're born to trade, we could be for you. See our Overview for more.
Past performance, whether actual or indicated by historical tests of strategies, is no guarantee of future performance or success. There is a possibility that you may sustain a loss equal to or greater than your entire investment regardless of which asset class you trade (equities, options or futures); therefore, you should not invest or risk money that you cannot afford to lose. Online trading is not suitable for all investors. View the document titled Characteristics and Risks of Standardized Options at www.TradeStation.com . Before trading any asset class, customers must read the relevant risk disclosure statements on www.TradeStation.com . System access and trade placement and execution may be delayed or fail due to market volatility and volume, quote delays, system and software errors, Internet traffic, outages and other factors.
Securities and futures trading is offered to self-directed customers by TradeStation Securities, Inc., a broker-dealer registered with the Securities and Exchange Commission and a futures commission merchant licensed with the Commodity Futures Trading Commission). TradeStation Securities is a member of the Financial Industry Regulatory Authority, the National Futures Association, and a number of exchanges.
Options trading is not suitable for all investors. Your TradeStation Securities’ account application to trade options will be considered and approved or disapproved based on all relevant factors, including your trading experience. See www.TradeStation.com . Visit www.TradeStation.com for full details on the costs and fees associated with options.
Margin trading involves risks, and it is important that you fully understand those risks before trading on margin. The Margin Disclosure Statement outlines many of those risks, including that you can lose more funds than you deposit in your margin account; your brokerage firm can force the sale of securities in your account; your brokerage firm can sell your securities without contacting you; and you are not entitled to an extension of time on a margin call. Review the Margin Disclosure Statement at www.TradeStation.com .
TradeStation Securities, Inc. and TradeStation Technologies, Inc. are each wholly owned subsidiaries of TradeStation Group, Inc., both operating, and providing products and services, under the TradeStation brand and trademark. When applying for, or purchasing, accounts, subscriptions, products and services, it is important that you know which company you will be dealing with. Visit www.TradeStation.com for further important information explaining what this means.

Good times are brewing for the central banks
Bank of America (BAC) | 4D Chart 📈
After a hard dip into $33.07, BAC is finding its legs — now reclaiming the 0.382 Fib level (38.78) and pushing toward the 0.5 zone at $40.54. A full retrace into the 0.618 (42.30) and possibly the 0.786 (44.81) would not be far-fetched if this bullish pressure continues.
🧠 Psychological Breaker: $40
🟣 Macro Resistance: $47.98
💡 Watch for a clean retest above the 0.5 for continuation signals.
With broader rate expectations shifting and financials showing life, BAC could be riding the first wave of a larger capital rotation.

BAC on the UPTRENDBAC has completed the correction. Now running on the Uptrend.
On chart frame WEEK, the price was crossed MA200 then back up.
On chart frame Day, the volume so high and RSI look good.
It's mean, the Uptrend started from 04.09.25.
In the short term, the price still has to come back to fill at least 1 or 2 gaps that it has just created.
Price target: $43.63
Price entry: $37.99 (Today, 04.15.25).
Price stoploss: $36.20
R/R: 3.15.
IMO amateur trader.
Good luck!

BAC Trade LevelsTraded down to the previous demand zone around 34. Has yet to break the range of the bearish weekly candle.

4/14/25 - $bac - not a short but prefer jpm/gs4/14/25 :: VROCKSTAR :: NYSE:BAC
not a short but prefer jpm/gs
- defn more of a focus for me on financials this year, which have some distinct advantages to other industry, in many ways you can think of them as the "picks and shovels" of the MAGA agenda. they r nearest to money printer. the stocks have held up well. co's needing WC help will benefit this subset of companies etc. etc.
- but for now i much prefer to keep to winners and honestly the multiple difference between BAC and say GS aren't that much different. perhaps 50% on P/B fine - bc they're diff animals and GS has substantially higher mgn of safety on this rate of return etc. et.c
- let's see. i'm on the sidelines. i'd own the basket of financials. more curious on how they report.
V

Quantum's BAC Trading Guide 4/8/25BAC (Bank of America Corporation) - Sector: Financials (Banking)
Sentiment:
--Neutral (slight bullish tilt). Pre-market options lean call-heavy, RSI likely ~48 (up from ~45 with +1.8% from $35.58 to $36.23), X posts overnight mixed—rate fears vs. recovery hopes—suggesting a bounce from $34.19 (April 4).
Tariff Impact:
--Moderate. 10% tariffs could hit loan demand (trade-sensitive clients), but BAC’s diversified revenue softens impact. Sentiment drives here.
News/Catalysts:
--Consumer Credit (April 8) key—strong data could lift BAC; X posts on banking resilience or tariff delays might boost today.
Technical Setup:
-Weekly Chart:
---HVN near $37 as resistance, weekly low ~$34 as support (April 4: $34.19).
---Sideways (8-week EMA ≈ 13-week ≈ 48-week, reflecting $35–$40 range).
---RSI ~48 (neutral),
---MACD near signal (histogram flat),
---Bollinger Bands near midline,
---Donchian Channels at midline,
---Williams %R -50 (neutral).
-One-Hour Chart:
---Support at $35.58 (prev. close), resistance at $36.68 (day high), weekly alignment.
---RSI ~50, MACD near signal (histogram flat),
---Bollinger Bands near midline,
---Donchian Channels at midline,
---Williams %R -48 (neutral).
-10-Minute Chart:
---Pre-market uptick to $36.23, 8/13/48 EMAs flat-to-up, RSI ~52,
---MACD flat near zero.
Options Data:
--GEX: Neutral (slight bullish tilt)—pinning shifts mildly upward.
--DEX: Neutral (slight bullish tilt)—call delta edges out puts.
--IV: Low—~20–25% vs. norm 25–30%, steady post-drop.
--OI: Balanced (slight call tilt)—OI leans above $36.
--Directional Bias: Neutral (slight bullish tilt). GEX’s mild upward pinning, DEX’s call delta hint at buying, low IV limits big swings, and slight call-heavy OI nudges up—neutral with a bullish edge.
Sympathy Plays:
--JPM (JPMorgan Chase): Rises if BAC gains, falls if BAC fades.
--WFC (Wells Fargo): Gains with BAC upside, drops if BAC weakens.
--Opposite Mover: BAC rallies → cyclicals like ALK fade; BAC dumps → JPM/WFC soften.
Sector Positioning with RRG: --- Financials (Banking).
--RRG Position: Improving Quadrant. BAC’s bounce from $34.19 lifts it vs. XLF.
Targets: Bullish +2% ($36.95, hourly resistance); Bearish -2% ($35.50, hourly support).

Quantum's BAC Ultimate Weekly OutlookBAC (Bank of America Corporation) - Sector: Financials (Banking)
Sentiment: Bearish. Put volume rises, RSI 45 weakens, X posts note banking fears from tariffs/economic uncertainty.
Tariff Impact: Moderate. Tariffs may slow growth, impacting loans, but domestic focus softens the blow. Sentiment drives more than fundamentals.
News/Catalysts: Banking sentiment shifts on X. Consumer Credit (April 8) could signal credit trends.
Technical Setup:
Weekly Chart: HVN above as resistance, weekly low as support. Downtrend (8-week EMA < 13-week < 48-week). RSI 45 (neutral, fading), MACD below signal (negative histogram widening), Bollinger Bands near lower band, Donchian Channels below midline, Williams %R -68 (nearing oversold).
One-Hour Chart: Support below, resistance near highs, weekly alignment. RSI 42, MACD below signal (negative histogram growing), Bollinger Bands at lower band, Donchian Channels below midline, Williams %R -74 (close to oversold).
10-Minute Chart: Bearish breakdown, 8/13/48 EMAs down, RSI 42 weakening, MACD flat near zero.
Options Data:
GEX: Bearish—pinning below close, dealers hedge puts to resist upside.
DEX: Bearish—put delta leads, selling bias.
IV: Moderate—slightly above norm (e.g., 25–30% vs. 20–25%), uncertainty raising prices. Supports GEX pinning, boosts DEX bearish bias.
OI: Put-heavy—high OI at lower strikes, capping downside.
Sympathy Plays:
JPM (JPMorgan Chase): Moves in sync—rises if BAC takes off, falls if BAC dumps.
C (Citigroup): Correlates via banking—gains with BAC rallies, drops with sell-offs.
Opposite Mover: BAC dumps → defensive stocks like JNJ may rally; BAC rallies → JPM/C surge.
Sector Positioning with RRG:
Sector: Financials (Banking).
RRG Position: Weakening Quadrant. BAC’s economic sensitivity fades vs. XLF as tariffs/rates weigh.
Targets: Bullish +3% (hourly resistance); Bearish -5.1% (weekly support).
Trade Idea: Weekly put (exp. April 11) on 10-min breakdown, target support, stop above close.

BAC in Monthly chart Hello
This idea is quite imaginary but possible. The problem for this LD pattern is that Leading Diagonals do not usually happen in monthly timeframe but I give you all I think and you can sort them.
The reason for this page is to provide an interactive atmosphere for those who want to share their ideas gathered in a place to make the best decision for all of us.
I mean please participate to discuss about these ideas and believe me it can be helpful to see all aspects of the chart.
Don't be arrogant about your level. It doesn't matter how much you know about charts, it would be better to correct my mistakes and let it happens for you.
Most pages are like a one way road and the provider of the page can't bear any criticism. I just cant tolerate impolite and sarcastic talk.
Thanks

BAC – 30-Min Long Trade Setup!📈
🔹 Ticker: BAC (NYSE)
🔹 Setup Type: Falling Wedge Breakout + Support Reclaim
🔸 Breakout Price: ~$41.52
📊 Trade Plan (Long Position)
✅ Entry Zone: $41.45–$41.60 (breakout + yellow zone confirmation)
✅ Stop Loss (SL): Below $40.77 (white support line)
✅ Take Profit Targets:
📌 TP1: $42.17 (red zone – minor resistance)
📌 TP2: $43.09 (green zone – previous swing high)
📐 Risk-Reward Analysis
📉 Risk:
$41.52 - $40.77 = $0.75
📈 Reward to TP1:
$42.17 - $41.52 = $0.65 → 0.87:1 R/R
📈 Reward to TP2:
$43.09 - $41.52 = $1.57 → 2.09:1 R/R
🔍 Technical Highlights
📌 Breakout from falling wedge (pink lines)
📌 Yellow zone flip from resistance to support
📌 Price reclaimed structure with bullish candle
📌 Higher lows forming with rising trendline support
⚙️ Trade Management Strategy
🔄 After TP1:
— Move SL to breakeven
— Secure partial gains (~50%)
📈 Ride remaining to TP2, trail SL below structure
⚠️ Setup Invalidation
❌ Close below $40.77
❌ Bearish rejection at yellow zone
❌ Volume drop on breakout candle

BAC - Further Lows Expected
For the next few weeks, I still expect BAC to make new lower lows, with the green zone just above 43 serving as resistance.
