BANK OF AMERICA - Increased Probability of AppreciationBAC has the support of Fiboclouds for appreciation within the H4 timeframe, being sufficient to reach the first target and attempt the second, provided the stop loss is properly repositioned at the time of the first partial realization.
If this projection is confirmed and a partial realization occurs at the first target, the stop loss should be moved from its initial position to the same line where the position was opened.
This way, the journey towards the final target will proceed with reduced risk of losses and the preservation of the partial gains achieved so far.
Follow us to receive notifications of new trades as well as frequent updates on ongoing trades.
Finally, if you agree with the idea or found it useful, please give it a BOOST so that it can reach a larger number of people! Thank you!
NCB trade ideas

Bank of America Resistance Breakout At $40.47 16.07.2024- Bank of America breaks resistance in ascending triangle pattern on 4HR Chart at $40.47
- Potential upside target at $44.68; further breakout could target $50.03.
- Failure to sustain breakout may lead to downside support at $37.16; break below could target $34.57.
Apply risk management
Risk Warning: Trading in CFDs is highly speculative and carries a high level of risk. It is possible to lose all of your invested capital. These products may not be suitable for everyone, and you should ensure that you fully understand the risks taking into consideration your investment objectives, level of experience, personal circumstances as well as personal resources. Speculate only with funds that you can afford to lose. Seek independent advice if necessary. Please refer to our Risk Disclosure.
BDSwiss is a trading name of BDS Markets and BDS Ltd.
BDS Markets is a company incorporated under the laws of the Republic of Mauritius and is authorized and regulated by the Financial Services Commission of Mauritius ( FSC ) under license number C116016172, address: 6th Floor, Tower 1, Nexteracom Building 72201 Ebene.
BDS Ltd is authorized and regulated by the Financial Services Authority Seychelles (FSA) under license number SD047, address: Suite 3, Global Village, Jivan’s Complex, Mont Fleuri, Mahe, Seychelles. Payment transactions are managed by BDS Markets (Registration number: 143350)
Disclaimer

EMA Crossover 11/26 w/ stop lossA basic EMA crossover strategy that enters long when the fast moving average crosses above the slow moving average, and enters short when the fast moving average crosses under the slow moving average.
A stop loss target is also put in place to minimize risk.

$BAC #RisingWedge #CanaryInTheCoalMineTechnical Wedge pretty clean, not perfect, 7/10 lol. Triple top on the Eyes adds to to setup a bit...Will be looking at NASDAQ:AAPL NYSE:BAC Monday 7.1.24 morning for support bounces or breakdowns (could be nice day trades either way)
Bank of America = 2024 Lehman , mentioned this when the pattern was first building and it actually fake broke down then John "Wicked" back into pattern!
Digital Banking and the eventually passing of their bread n butter ie; dumb boomers that can't convert to pdfs LMFAO!, this bank is a DINOSAUR in today's finance landscape. They offer outdated products, poopy rates, poopy services, branches closing heavily since 2020. They even know it's coming. "Erica" is their hail mary, but all the "next gen" clients seem to have chosen newer banks with better interest rates on savings, invest opps, and easier tech accessibility. They also have tons of TERRIBLE COMMERCIAL REAL ESTATE which has silently crashed reality still waiting to hit...
I am waiting for the headlines to confirm thesis and buy puts... But on Radar...

Why you need to have rules in your trading careerHello,
The importance of rules cannot be underestimated in any business. This must not be different in trading/investing since it must be viewed at all times as a business.
Below are my rules as a wave trader. Wave trading is a trading strategy that combines technical analysis with Elliott Wave Theory to identify and predict future market movements. This approach involves analyzing market price patterns to understand the cyclical nature of market trends and capitalize on these patterns for trading opportunities. Below is an example of how markets move in waves
Rules are very important (Our trading rules)
Identify Impulse & Correction
The first step in trading is to identify the impulse and correction phases in the market. An impulse phase is characterized by strong, directional price movement, indicating a clear trend. Corrections, on the other hand, are smaller, counter-trend movements that typically follow an impulse. By recognizing these phases, you can better understand the market's structure and prepare for potential trading opportunities. Below is an example of impulses & corrections identified
Identify the Pattern Formations
Once you have identified the impulse and correction, the next step is to look for specific pattern formations. These patterns, such as head and shoulders, double tops, or triangles, provide clues about future price movements. Understanding and recognizing these formations can significantly enhance your ability to predict market direction and make informed trading decisions. Below are patterns identified that can be tradeable
Most of these patterns can nowadays be identified for you using Tradingview under indicators, metrics & strategies.
Identify Entry Points
After identifying the patterns, the next crucial step is to pinpoint entry points. This involves determining the optimal moment to enter a trade based on your analysis of the market. Entry points should be chosen carefully to maximize potential gains while minimizing risk. Look for confirmations, such as breakouts from patterns or specific technical indicators, to ensure a higher probability of success. Below is an example with a risk free entry
We shall be looking in another post on different types of entries.
Look for Targets
Setting targets is essential for effective trading. Targets help you establish your profit goals for each trade and ensure that you remain disciplined in your approach. These targets can be based on various factors, such as previous support and resistance levels, Fibonacci extensions, or measured moves from the identified patterns. Clear targets allow you to exit trades strategically and lock in profits.
Below is our clear target for the entry we made with a clear stop loss as well
Look for Exits in Case the Trade Doesn't Go Your Way
Not all trades will go as planned, so it's vital to have exit strategies in place for unfavorable scenarios. This involves setting stop-loss levels to limit potential losses and protect your capital. By defining these exits beforehand, you can remove emotional decision-making from your trading process and adhere to a systematic approach, ensuring long-term success and sustainability in your trading business.
I trust that these rules can help you in your trading journey. You can think of having them written somewhere. That way you can look at them & follow them for each trade you make.
All the best

BAC NEEDS A SMALL PULLBACK BEFORE EXPLODING?BAC has an interesting chart structure at the moment. There is a fresh weekly low on the RSI in March of 2020. From that low, there is a very clean five wave movement to the upside that terminates around 49.50. Following the 49.50 top, we get a meaningful pullback that resets the RSI at around a price point of 25. Based on the RSI and clean structure, we are treating these two larget degree movements as a wave 1 and 2. That said, it appears that wave 1 of 3 just completed and rejected the .50 extension, which is a common target for such. Going forward, we would expect a shallow pullback that targets the .382 extension. From there, we would expect the larget degree wave three to really get going to the upside and volume to take over.

Bac Breakout TradeStock has broken out of my symmetrical triangle. Price has broken out and a candle has closed above my structure. I think there will be a rally to the levels of April 2022. Those are my targets. I think my targets will be hit by a friday two to three weeks out.

Could Bank of America be a point of interest in the next month.Hellooo
I guess you all realized that how much I am interested in bigger time frames.
Now I have brought you another share that I think will be a really good chance
for our nest weeks trades.
I do not care about last waves before this Leading Diagonal because if this Leading Diagonal is confirmed it does not matter if it wave 1 or wave A of a zigzag.
What we should do is that put it in our watch list and wait and see if its next movements (Correction Pattern) can make us confident about this pattern.
Note that potential retracement for leadinigs is 78.6 even it does not make sense that this huge correction does not make sense.
Inside the correction:
Our Cycle leading (if it is true) ended in the price 50.11 and then its correction started to shape wave (II). In this way, wave A of ABC of wave (II) was finished as a leading diagonal (Primary) and it should continue the of this correction pattern as a ZIGZAG (If wave A of correction is Leading Diagonal so our correction pattern must be a ZIGZAG).
All these ideas are just ideas till our correction pattern completes and then we will decide about Cycle Leading Diagonal entry point.
For now trading we can wait for wave B Primary and then if it corrects logically we can get a Buy Position for wave C primary or if it tries to deceive us with ugly shapes so we will wait till this ABC Primary completes and then get a sell position.
(we will discuss about then in the due time).
Be safe

levels to manage $BACBank of America is using artificial intelligence (AI) to deliver personalized, client-specific insights, advice and resources at key moments. The bank has invested $3 billion or more on new technology initiatives each year for over a decade, including significant investments in #AI. Bank of America is also using AI to reliably predict which companies are likely to be acquired close to a year in advance.

ready to break down?Can we see a big move down in the coming months?
We should watch of he breaks the trendline and wait for a retest.

BAC Great performance, it's time to halve the positionHI, I thought I'd share some trades from the last few months, one of the most brilliant performances I've had in my portfolio was made by BAC which has had a surge in prices since the expectations of a rate cut from part of the FED. I hope you enjoy this interesting bullish pattern. If you like the content I share, I invite you to give it a boost. Thank you

Elliott Wave Expects Bank of America (BAC) to Continue HigherShort Term Elliott Wave in Bank of America (BAC) shows incomplete bullish sequence from 4.16.2024 low. Up from there, wave (1) ended at 38.49. Dips in wave (2) unfolded as a zigzag structure. Down from wave (1), wave A ended at 37.38 and rally in wave B ended at 38.31. The 45 minutes chart below shows the wave B as the starting point. Down from there, wave ((i)) ended at 37.75 and wave ((ii)) ended at 38.06. Wave ((iii)) lower ended at 36.82 and rally in wave ((iv)) ended at 37.51. Final leg wave ((v)) ended at 36.65 which completed wave C of (2).
The stock has turned higher in wave (3). Up from wave (2), wave ((i)) ended at 38.15 and pullback in wave ((ii)) ended at 37.46. The stock extended higher in wave ((iii)) towards 38.78 and dips in wave ((iv)) ended at 38.10. Up from there, wave (i) ended at 38.79. Expect pullback in wave (ii) of ((v)) before stock turns higher again in wave (iii) of ((v)). Near term, as far as pivot at 36.65 low stays intact, expect pullback to find support in 3, 7, 11 swing for further upside.

BAC vs DBBattle of the Banks
Tides turning in Germany's favor.
Precious metals and commodities have shown to enjoy this.
#gold #silver #uranium #copper NYSE:DB NYSE:BAC #deutschbank #bankofamerica


$BAC Megaphone pt2?I have an older BAC idea from a few weeks ago that shows a LARGE megaphone pattern that started after the 08 Crash being tested. It held and bounced but formed what seems to be another NICE smaller weekly megaphone pattern that we are testing and in the morning rejecting at the upper band. AMAZING DOWNSIDE JUICE in these patterns imo.
I will be looking for a BADDDDD DAY in the markets over the next 2 weeks before i bite on any 25P for mid APRIL....
Stay Tuned
-Proffesseas

BAC Bank of America Corporation Options Ahead of EarningsIf you haven`t bought AAPL before the previous earnings:
Then analyzing the options chain and the chart patterns of BAC Bank of America Corporation prior to the earnings report this week,
I would consider purchasing the 35usd strike price Calls with
an expiration date of 2024-8-16,
for a premium of approximately $2.82.
If these options prove to be profitable prior to the earnings release, I would sell at least half of them.

Bank of America -Weekly 26 EMA pointing upwards suggesting an uptrend.
-A successful visit on the 26 EMA is recognized as well.
-FED rate cuts paused.
-There is a rumor that wants bank regulators to propose limitations on the compensation of the executives.
Long sentiment.
-Price inside a negotiation area that forms the lower edge of a bigger range.
Entry after the successful completion of the flag when a strong bull candle/pattern appears.
Stop loss below the flag.
Target on the extremes of the opposite negotiation area.
The trade here is indicative.

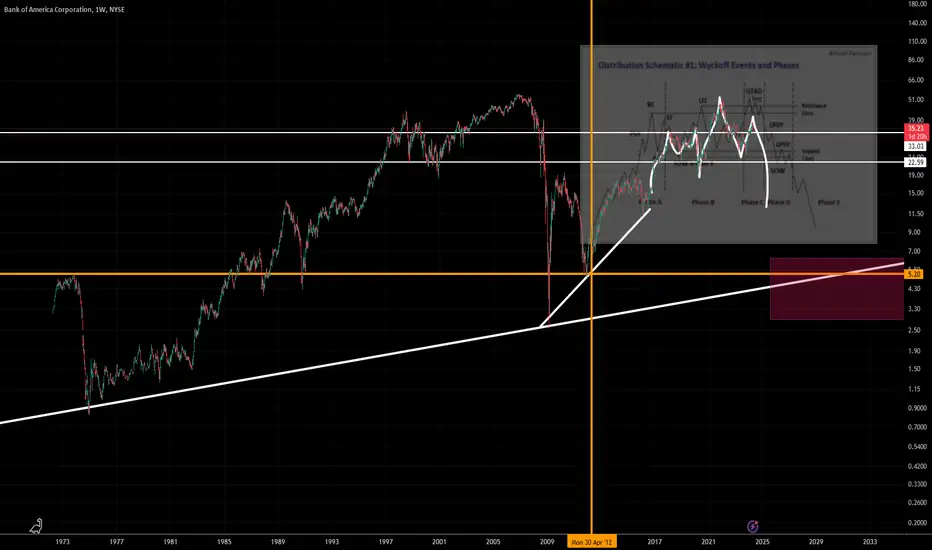
bank of america looking at the weekly of bank of America. looking at a Wyckoff top bac NYSE:BAC #bac
Bank of America Navigates Turbulent Waters: Beating Earnings Bank of America (NYSE: NYSE:BAC ) emerges from the first quarter with a mixed bag of results, showcasing resilience amidst economic uncertainty. While surpassing Wall Street's expectations on both revenue and earnings, the bank grapples with elevated expenses and mounting charge-offs, casting a shadow on its post-earnings performance.
Earnings Beat Amidst Headwinds:
Bank of America ( NYSE:BAC ) reported earnings of $0.83 per share on sales of $25.82 billion, outpacing analysts' forecasts. Despite this positive outcome, shares experienced a slight dip of about 3%, reflecting investor concerns over elevated expenses and an uptick in charge-offs of bad loans. The bank's diversified revenue streams, including robust performance in investment banking and trading, partially offset lower net interest income, underscoring its adaptability in challenging market conditions.
Consumer Banking Dynamics:
In the consumer banking segment, Bank of America ( NYSE:BAC ) faced headwinds with a 5% decline in revenue and a 7% dip in average deposits, albeit remaining above pre-pandemic levels. However, the addition of 245,000 new checking accounts and strong growth in global wealth management, banking, and market divisions signal underlying strength in client acquisition and relationship-building efforts.
CEO Perspective and Strategic Outlook:
CEO Brian Moynihan highlighted the bank's strong quarter, emphasizing business performance and client engagement. Despite economic uncertainties, Bank of America ( NYSE:BAC ) remains optimistic about its market-leading positions and emphasizes continued focus on earnings growth and expense management to drive shareholder value.
Navigating Economic Uncertainty:
While Bank of America ( NYSE:BAC ) showcased resilience, challenges persist, particularly in managing credit card issues and addressing elevated charge-offs. The bank attributed the higher-than-expected charge-offs to lingering effects from the previous quarter but expressed confidence in stabilization moving forward. Additionally, one-time expenses, such as the FDIC special assessment, posed temporary hurdles but underscored the bank's commitment to regulatory compliance and financial stability.
Investor Considerations:
For investors seeking exposure to national banking franchises, Bank of America presents an intriguing opportunity. Despite short-term headwinds, the bank's resilient performance and strategic positioning in key business segments warrant consideration. As economic conditions evolve, investors should monitor Bank of America's proactive measures to mitigate risks and capitalize on growth opportunities.
Conclusion:
Bank of America's ( NYSE:BAC ) first-quarter performance reflects a blend of resilience and challenges in navigating the dynamic economic landscape. While surpassing earnings expectations, concerns linger over elevated expenses and credit quality issues. However, the bank's strategic focus on client engagement, expense management, and regulatory compliance positions it for long-term success.
Technical Outlook
Bank of America's ( NYSE:BAC ) stock is trading below the 200-day Moving Average (MA) with a weak Relative Strength Index (RSI) of 35.86 further accentuating to the bearish position of NYSE:BAC stock is the bearish Harami pattern exhibited in the 4- Month price chart.

Bank - Long - TP 32Bank of America has been falling since Feb 2022.
Its going for the support zone.We might get some support in the regions of 26 and 23.
Do not consider for long term investments take profits at 32 max at 37.

Bank of America Priced in SilverYes, #Silver is getting STRETCHED, begging for a consolidation.
However, this has permitted it to outperform #BankofAmerica, carving out a possible MASSIVE topping structure.
In fact, we are on the brink of a PARADIGM SHIFT breakdown in favor of the #PreciousMetals.
OH BOY!


Lets get a buy position of a Monster (BAC)Hello everyone
I just want to give you an intraday signal but if it works.
Please let wave ii complete and then enter in the extremity of it with money management if you want.
Thanks
