NCB trade ideas


BAC ResistanceThere appears to be key support at $18 not only now but throughout the history of the stock. Expect big moves for the rest of the week depending on whether or not this willbreak through the $18 support

$BAC Wedge + Trending + DivergenceMonthly Chart
Weekly Chart
1. Wedge
We can see in the 1-hour chart of Bank of America that is forming a wedge. We can see the wedge with the purple lines in the price chart.
2. Regular Divergence
In addition we can also see a regular divergence from 6th March to 23 March while the price was falling the indicator in the Rsi was rising.
3. Trend Line
We can see better in the monthly chart that there is a trend line that is forming from about 2008. The next days that will be tested.And the is the second more general trend line forming decades before.
4. Support Line
Also if we look in the monthly chart we will see that there is a main/strong support line that in the next days will be tested again. The 1st support line lies around at 15.24$ and the second at 4.92$
From the first two factors we can see that might be a breakout and form a new uptrend. At the 1 hour chart we will see that the wedge the 1st trend line and the 1st suport line get together in one spot.
So the first scenario will be to test that support at 15$ and form a new uptrend.
The second scenario is to break that support and fall until it lands at the more strong 2nd support and resistance at around 4,5$ and then form a new uptrend from there .
Scenarios

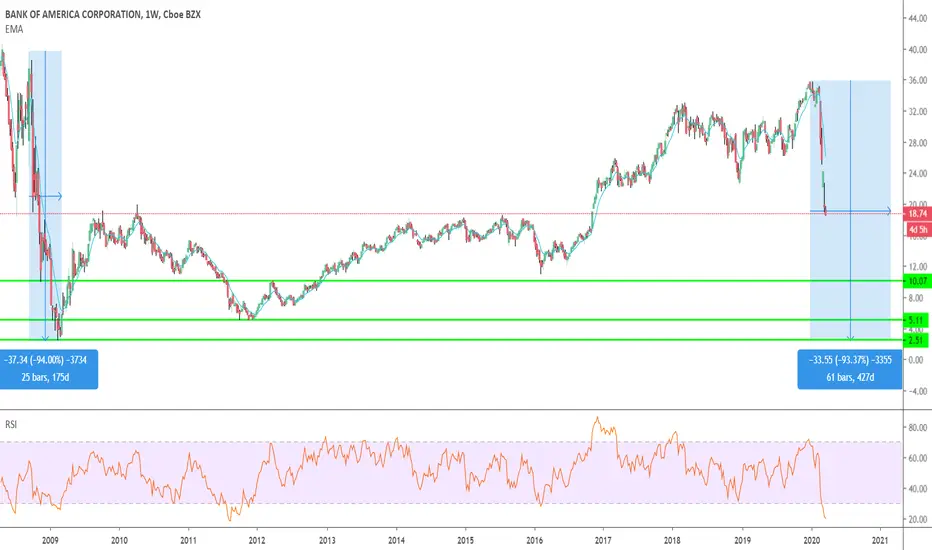
BAC - We are repeating the 2008 dropHello everyone, as we can see we are heading for the same % drop as in 2007, so expect till March - May 2021 the price to be around 5$ - 2.5$ . We do have support at 10$, but giving the fact how the 2007 crysis turned out for BAC with more than 90% drop, right now we are seeing record big drops, I see -90% from all time high price again. Right now we will see temporary retracement to the upside, but it will be fore 1-2 months, then we will drop again. Good luck to everyone, see you next year :D
BAC monthly buyBAC has formed a long legged H&S if that's a thing? along the uptrend that has formed. Following the monthly momentum of the MA we can see that it is moving upwards, and from past bounces we can see that the purple MA is the optimal buy point for BAC. Lets get that money!

baclml line of chart is 18.37 but price may test 17.81.if price break 17.81 then accordind red arrow will go to 14.15

Analyzing BAC price movements I notice a RSI divergence formingHi Everyone,
First time publishing my ideas on tradingveiw. After analyzing BAC price movements, I notice a RSI divergence forming on BAC. The divergence can be clearly seen forming. Let me know what you guys think .
P.S.
Sorry for the audio.

BANK OF AMERICA CORPORATION (BAC) WeeklyDates in the future with the greatest probability for a price high or price low


Bank Of America (BAC) Will Drop Hard (90%+ Crash?!)The chart for Bank Of America (BAC) is looking bad long term, there are many signals pointing to a very strong drop.
The last time this company had a crash, it shredded over 95% of its value... The same might happen again.
Let's take a look at some of the signals:
Let's start by looking at Divergence , you can spot this marked with a light blue line on both the MACD and RSI. These divergences work strongly on conventional assets, they always confirm. We have bearish divergence on both indicators.
I marked a rising wedge in purple which is also bearish. You can expect the asset value to move a bit longer within the wedge before breaking down; if it does. Probabilities are really high...
EMAs are going to be challenged now, this is our main support (22.33).
The RSI is super bearish.
Volume has dropped massive while price moving up.
If you were to use this information to trade, a break and close above 28.45 would be a great stop loss. As for the way down, 13.62 can be your main target and more after/if this level breaks.
...
This one is about to crash really hard... Just like it is happening with Apple, Google, SPX, DJI and the rest.
Thanks a lot for reading.
Namaste.

Bank Of America Struggles. Await Long opportunity $bac
Market extremely volatile, so we await this opportunity to trade BAC.

Elliott Wave View: BAC Looking for More DownsideBank of America (Ticker: BAC) decline from December 27, 2019 high is unfolding as a 5 waves impulsive Elliott Wave structure. Down from December 27 high, wave ((1)) ended at $32.47 and wave ((2)) ended at $35.45. The stock has resumed lower in wave ((3)) and internal of wave ((3)) subdivides in an impulse in lesser degree. Down from $35.45, wave (1) ended at $27.44 and bounce in wave (2) ended at $29.8.
In the chart below, we can see that down from $29.8, wave 1 ended at $27.50 and bounce in wave 2 ended at $28.42 as a Flat. Stock then resumed lower in wave 3 towards $21.75 and bounce in wave 4 ended at $23.49. Finally wave 5 ended at $21.51 which also completed wave (3). Wave (4) rally is now in progress to correct cycle from March 3 high. Potential target for wave (4) in 3 swing comes at $23.7 -$25. Sellers can appear from this area for more downside or 3 waves pullback at least. We don’t like buying the stock. Expect rally in Bank of America to fail in the sequence of 3, 7, or 11 swing as far as pivot at 29.80 high stays intact

BAC may not go up much furthertwo years' consolidation and broke up was invalidated by the selloff in two weeks.
give the current macro environment, BAC may not be ready for another breakout any time soon.
