Looking for deeper correction before going longI like BAC, But it seems quite clear to me that we are going deeper.
So where is the next logical support?
well, it would be the completion of a harmonic shark, a historical support, and the touch on the bottom of a falling wedge.
3 different types of market participants, and maybe even more signs will show up at that time, will likely place market bids here.
Patience will bring opportunity.
NCB trade ideas

BAC - horizontal and diagonal support, updated forecastLONG BUY ~$28.50, SL: $27.55, T1: $32.40, T2: $36.00
1. Horizontal and diagonal support
2. Good R/R
3. Updated analyst forecast +22.14%
Disadvantage - Dioganal resistence

Bank of Amercia QuarterlyARE WE AT MAXIMUM COMPLACENCY?
Bank of America's momentum grinding to a halt.
This makes it vulnerable for a prestigious fall.
#Banks #Recession #BankingCrisis #Inflation

Bank of America bullish signalBAC has bullish setup, potential target is $40 level. There was strong consolidation between $30-37 levels, now bulls are strong enough to move price +40%.

BAC 03.08.2023 LONGAsset and Time frame -BAC DAILY
Entry Price -31.49
Exit(Stop Loss) -30.17
Exit(Take Profit) -35.53
Price bounced off the significant 38$ level after a restest, which is also the 0.382 Fibonacci level from the lows to the new high, just before that price succeeded in breaking the daily 100 MA with decent volume post earnings.
Good luck

my levels to manage BACBased on 16 Wall Street analysts offering 12 month price targets for Bank of America in the last 3 months. The average price target is $34.73 with a high forecast of $49.00 and a low forecast of $28.00. The average price target represents a 21.86% change from the last price of $28.50.

Burton Malkiel should Reconsider Market Randomness..!last night I published 3 analyses on 20 tickers and shared the links with my followers. (private posts)
20 out of 20 tickers behave as predicted today..!
The odds of being correct is 1 in 1,048,576..!
Banks:
BAC,WFC,JPM,C,MS,and GS
They are all down but they are near their support levels.
they could experience a rally before their earnings!
Keep your eyes on them for a possible 10% rally.
Airlines:
AAL, DAL,UAL,LUV,ALK, and SAVE
They all made bearish engulfing (except SAVE), in the weekly chart near the upper border of a bearish channel!
Lower prices in the coming weeks are the strongest possibility!
EV makers:
TSLA, LCID, RIVN, FSR, NIO, XPEV,Li, and WKHS
All of them rejected their resistance and could experience lower prices, but the exception is LCID which is already at its support!
LCID could be the only one to experience higher prices..!
Have it on your watchlist!
Today's charts:
Banks: 6 out of 6 positive..!
Airlines: 6 out of 6 negative!
EV makers: 8 out of 8 negative:
Dear Mr. Malkiel,
You need to Update the book you have written in 1973, 5 years before computers became available to public..!
Best,
Dr. Moshkelgosha M.D
DISCLAIMER
I’m not a certified financial planner/advisor, a certified financial analyst, an economist, a CPA, an accountant, or a lawyer. I’m not a finance professional through formal education. The contents on this site are for informational purposes only and do not constitute financial, accounting, or legal advice. I can’t promise that the information shared on my posts is appropriate for you or anyone else. By using this site, you agree to hold me harmless from any ramifications, financial or otherwise, that occur to you as a result of acting on information found on this site.

Bank of America is Shaping Up to Be Just Like PacWestWhen comparing the price action between BAC and PACW, it can be seen that both stocks exhibit the same price action, which is a Rising and Broadening Structure leading into the PCZ of a Bearish Alt-Bat, which all eventually came to a halt upon getting Bearish PPO Confirmation. This led to a breaking of the 21-Month SMA before ultimately flushing down to all-time lows after months of treating the 21-Month SMA levels as resistance.
The same price action can be seen on Bank of America; it is just 1 step behind PACW at this point in time, which is the flipping of the 21-SMA into resistance. The next step would be for it to crash below the 2009 lows.

Bank of America priced in SilverPriced in silver...
#BankOfAmerica's recovery momentum since 2008 has been stifled and now rolling over.
Always price in #gold or #silver.
Remove the #fiat illusion.

(BAC) 3H - Bull Bat Type1 EntryI went long @ 28.45 yesterday. This pattern should be treated as a reaction; the Natural harmonic Reaction to the .236 retracement is the most likely outcome and is in fact a high probability trade. This patterns structure suggests that a move to 2.54-2.91 is certainly possible. I contend that that will not occur until the pattern at very least yields a NHR. Despite this possibility, I have my eyes on a larger move that perhaps will be a part of an emerging Harmonic Range. I am hopeful yet wary. The key will be the action at .236 retracement level. If price rejects there either a deep retrace to retest the lower median line or a divergent move to the 1.13 extension is likely to occur.

BACI'm not getting a lot of confidence that this blue uptrend line dating back over a decade is going to hold.

BAC Short Trigger incoming! Analysis of Bank of America Stock: Support, Risk, and Stop-loss
Bank of America's stock is currently finding a support level at $28.71, backed by accumulated trading volume. This level presents a potential buying opportunity, as historical patterns suggest an upward price reaction when this support level is tested.
In terms of daily price movements, Bank of America's stock displays average volatility, accompanied by robust trading volume. This places the risk level at a moderate range. In the most recent trading day, the stock exhibited a price range of $0.370 between its highest and lowest points, equivalent to a 1.28% fluctuation. Looking at the past week, the stock has maintained a daily average volatility of 1.68%.
The Relative Strength Index (RSI14) indicates that Bank of America's stock is currently oversold, with a reading of 23. While an oversold condition on the RSI might lead some stocks to experience substantial and extended declines before a reversal, it's important to note that this also introduces a higher degree of general risk.
It's advisable to consider these factors while evaluating your investment decisions for Bank of America's stock, taking into account the support level, risk level, and the potential implications of the oversold RSI condition.🩸

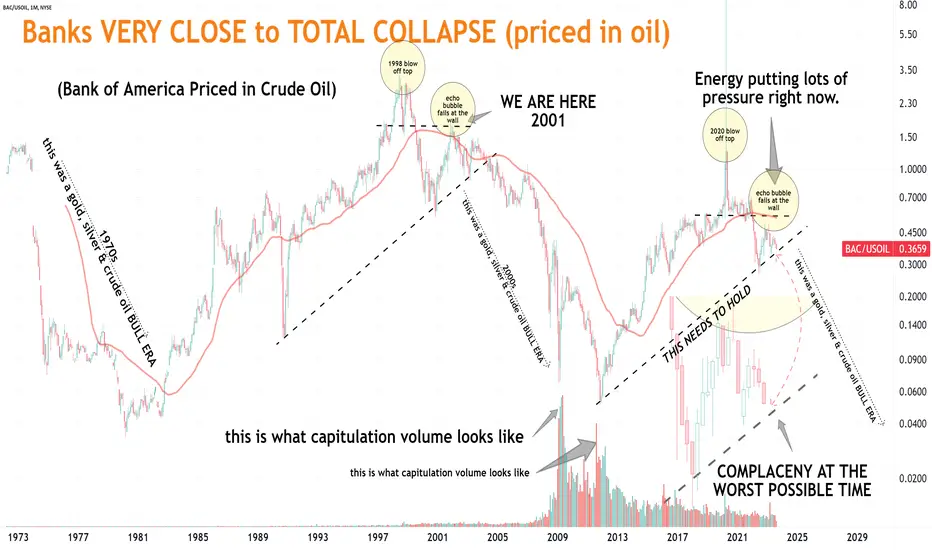
Bank of America priced in oil v2Bank of America (priced in oil) is getting VERY CLOSE to MELT DOWN mode...
BUCKLE UP!
#crudeoil #uranium #gold #silver #bankingcrisis
Energy putting lots of
pressure right now.
COMPLACENY AT THE
WORST POSSIBLE TIME
(no volume)

Bank Of America Priced in OilWhile it may not feel like it now, #Gold and #Silver BULL ERAS lie just ahead...
We are witnessing MAXIMUM COMPLACENY...
at the ABSOLUTE WORST TIME !!!
#CrudeOil on brink of historical BREAKOUT.
#Banks on brink of historical BREAKDOWN.
#fintwit #bankofamerica #inflation
BAC - Another Leg Down?If this recent move proves to be an A-B-C correction, then some cheap puts are in order here. I bought some Jan 25 Puts. I also hold a BAC covered call position for Jan 35. So I am also acting to ensure protection against potential downside that can drop price into the low 20s.

Bank of America priced in silver#Banks STILL on brink of MAJOR collapse. Nowhere close to any type of CAPITUALTION bottom.
Remember, they will DESTROY your purchasing power to save them. Expect #GOLD and #SILVER to price that in.
#BankofAmerica #BankingCrisis #Banking

Another strong drop is comingA historical decline was made in 2006 to 2009, from which the rise took place in three waves, not an impulsive rise, and there are many manifestations of weakness in the rise from the presence of a strong monthly negative divergence, in addition to the weakness of the rise at the historical peak. next big
Good luck

Bank of America break-out?? Possible break out on the downward channel helped by a previous strong push to the upside..... Will the upward push continue or will it retest?

BAC: Dividend Day May Help The Price To Grow Even MoreBAC: Dividend Day May Help The Price To Grow Even More
After the price broke out of a strong structure around 30.70, we can see that it is already consolidating and preparing for another bullish move.
The current price position combined with the EX- Dividend date, which will be August 31st, could raise the possibility that the BAC price could go higher.
Let's see.
Thanks and good luck!

undervalue, slight growthIt used to trade at 40 USD
Too undervalue, still has growth in Q1, one of the oldest bank.
and I just love Premier League.
Of course it's a long game.

BANK OF AMERICA is about to start the new 2 year rally.The Bank of America Corporation (BAC) got rejected again on its 1W MA50 (blue trend-line), a level that has been acting as a Resistance since the March 2022 break-down. This has created a Lower Highs trend-line that is the key pivot level now. But before that, let's see how it's been trading on a +10 year basis.
As you see on this chart, ever since the November 2011 Low, the stock has been trading within a Fibonacci Channel, with the extensions serving as very accurate Resistance and Support levels. We have seen 1W MA50 rejections after strong corrections in April 2016 and June 2020. Each of those times, the price hit the Buy Zone (green) before rebounding to a Higher High, while the RSI on the 1M time-frame hit the 38.80 Support. The 1M MA100 (red trend-line), which on March 2020 provided Support, acted once more as the long-term Support this March (2023), exactly at the top of the 10 year Buy Zone.
As a result, BAC is a buy opportunity, but will only get confirmed when it closes a 1W candle above the Lower Highs trend-line. As far as a long-term target is concerned, the first Higher High on the Fibonacci scale was made on Fib 2.0 (March 2014), the second on Fib 4.0 (March 2018) and the third on Fib 6.0 (January 2022). Investors could hold, based on this sequence, until the 8.0 Fibonacci extension.
It is interesting to point out that each Cycle within this Channel has approximately been 4 years and each of the rallies around 2 years, like the one we're currently about to confirm.
-------------------------------------------------------------------------------
** Please LIKE 👍, FOLLOW ✅, SHARE 🙌 and COMMENT ✍ if you enjoy this idea! Also share your ideas and charts in the comments section below! **
-------------------------------------------------------------------------------
💸💸💸💸💸💸
👇 👇 👇 👇 👇 👇

BAC HKEX BUYHi, according to my analysis of BAC stock. There is a good chance to buy. We notice that the stock started moving very positively. With the arrow exiting the triangle pattern. And breaking the resistance at 29.50. We also notice that a strong green candle is forming outside the pattern, which indicates the power of buyers. good luck for everbody

Bank of America - SHORTBANK OF AMERICA SHORT IMO
Needs to correct here as they have been very naughty little bankers with a "W"
nice pull back opportunity
