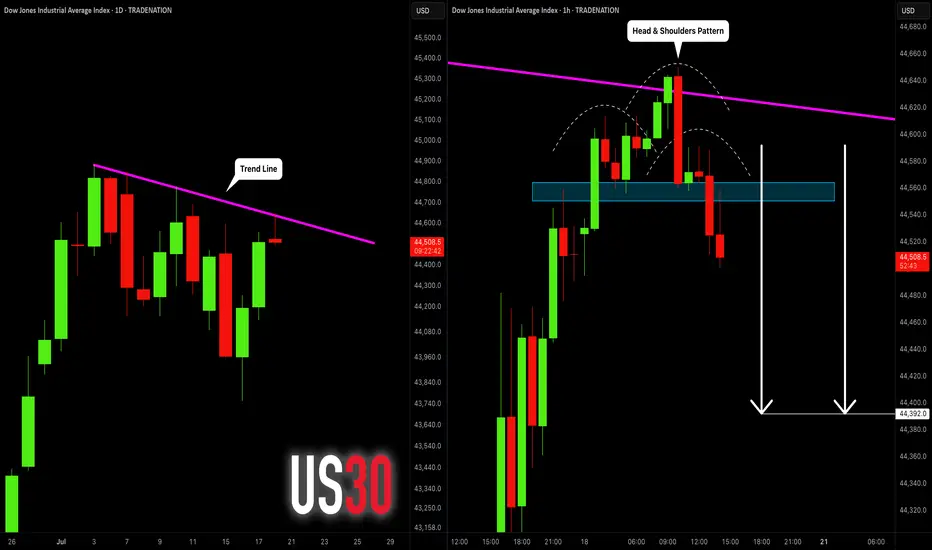
DOW JONES INDEX (US30): Bearish Move From Trend Line
I see a test of a strong trend line on US30.
The price formed a head & shoulders pattern on that
and a breakout of its neckline on an hourly time frame.
I expect a retracement to 48390
❤️Please, support my work with like, thank you!❤️
I am part of Trade Nation's Influencer program and receive a monthly fee for using their TradingView charts in my analysis.
US30 trade ideas
Dow Eyes 45000 After Bullish BreakoutThe U.S. 30 contract has broken topside from a short-term bull flag, reinforcing the broader uptrend and putting 45000 resistance back in focus.
Traders looking to play a continuation can consider longs with a tight stop beneath for protection. A break of 45000 may trigger a fresh burst of upside momentum, putting big figures above in play.
Bullish price momentum is also building again, adding to the case for upside.
Good luck!
DS

Long Position on Dow Jones Industrial Average
Initiating a long position at 44,456, supported by robust economic data and stronger-than-expected corporate earnings. These indicators point to continued resilience in the U.S. economy, potentially allowing the Federal Reserve to consider rate cuts sooner than previously anticipated — a positive catalyst for equities.
📌 Entry: 44,456
🛑 Stop Loss: 44,207
🎯 Take Profit: 44,900
Monitoring price action closely as market sentiment continues to shift in response to macroeconomic developments.

US30: The Market Is Looking Down! Short!
My dear friends,
Today we will analyse US30 together☺️
The recent price action suggests a shift in mid-term momentum. A break below the current local range around 44,306.1 will confirm the new direction downwards with the target being the next key level of 44,263.8..and a reconvened placement of a stop-loss beyond the range.
❤️Sending you lots of Love and Hugs❤️

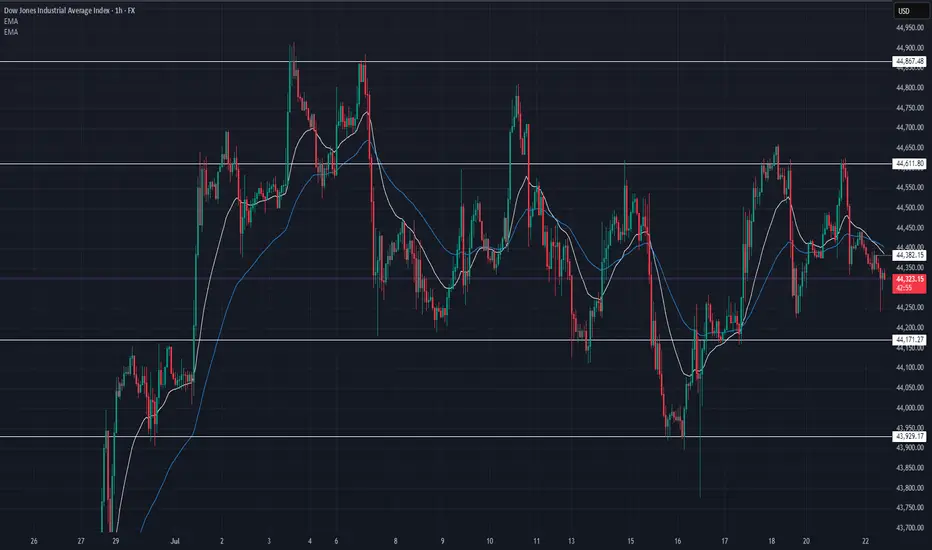
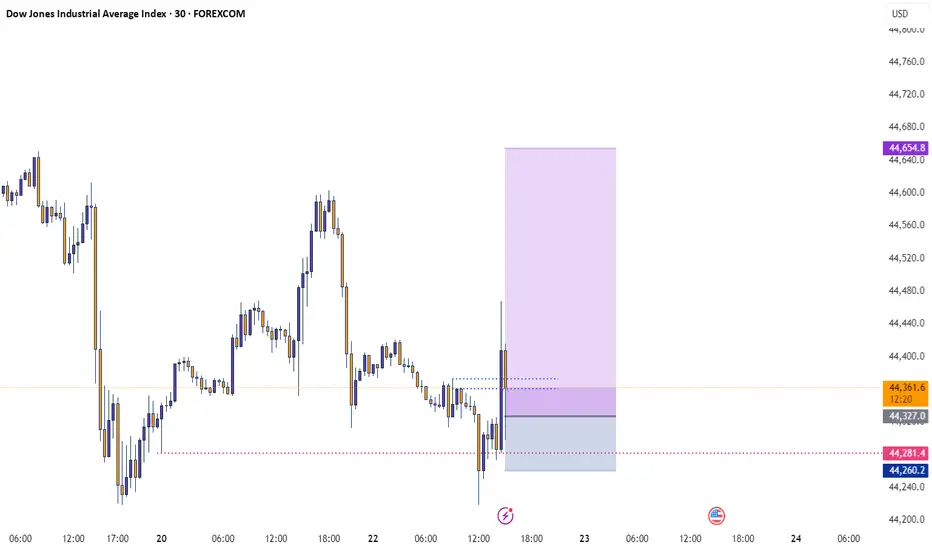
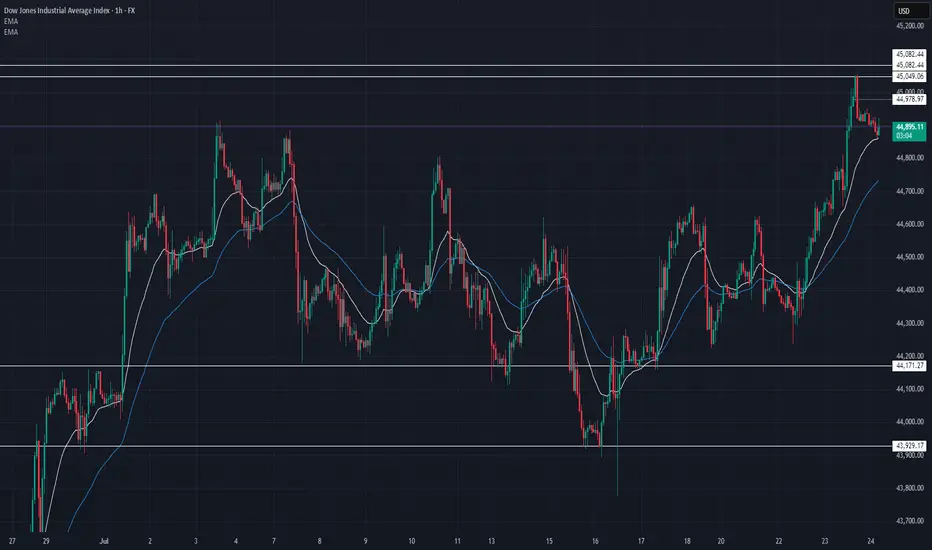
US30 Update – 07/22/2025📍 US30 Update – 07/22/2025
Still trapped in the range chop ⚠️
Price rejected off 44,611 again and is now pulling back toward mid-range. Structure continues to respect key zones, and we now see lower highs forming — early signs of bearish pressure building 🐻
EMA crossover is flipping bearish on the 1H — sellers gaining control short term.
📊 Market Structure:
📉 Lower highs forming below 44,611
📈 Still above demand at 44,171
📉 EMA 9/21 crossover down — bearish tilt
📉 Momentum weak under 44,385
🔑 Key Levels:
🔼 Resistance: 44,611 → 44,867
🔽 Support: 44,171 → 43,929
🧠 Market Bias:
Short-term bearish 🧨
➡️ Clean breakdown of 44,171 = bearish momentum
➡️ Buyers must reclaim 44,385 to shift bias
💡 Trade Scenarios:
📉 Bearish Rejection Play:
Entry: 44,380–44,400
TP1: 44,200
TP2: 44,000
SL: Above 44,430
📈 Demand Bounce (Low-Risk Buy):
Entry: 44,180–44,150
TP1: 44,385
TP2: 44,600
SL: Below 44,100
US30 - LONGBearish Friday after price hit a key level high. Price will continue to the downside the remainder of today. Expecting a jump back to today's highs come Monday morning.
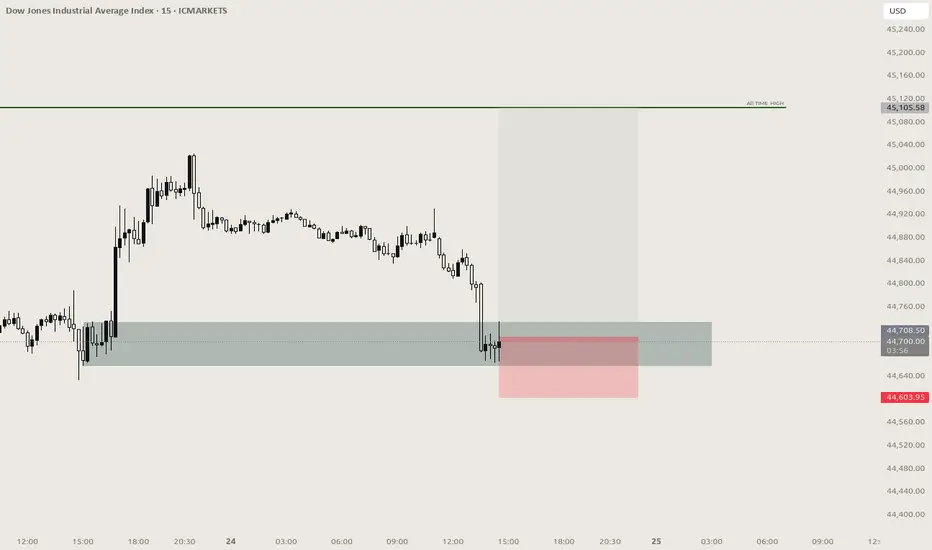
US30 ATH coming?Update to my last port wondering if I should add, what would you do in this situation?
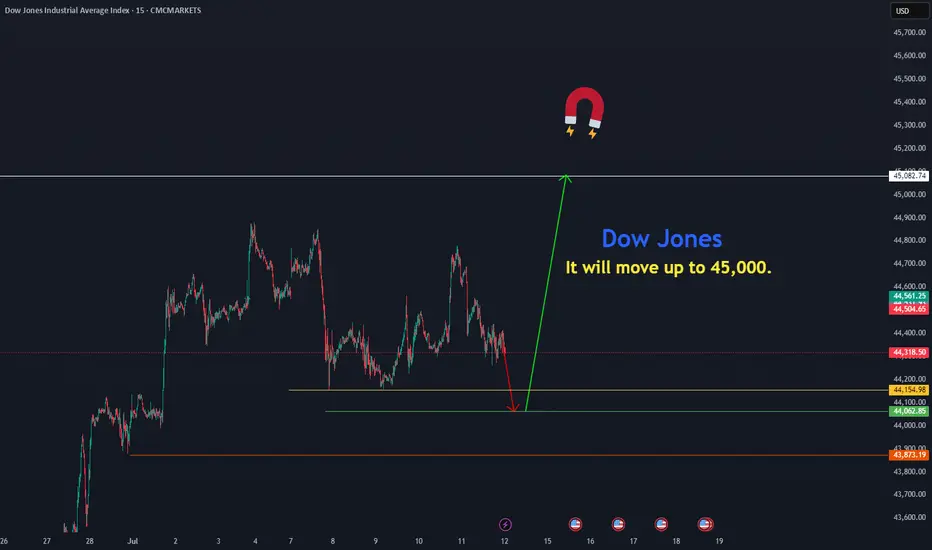
Dow Jones move upThe Dow Jones is resuming its rally toward 45,082 from the price zones of 44,154.97 and 44,000.
CMCMARKETS:US30

Buy
Rejection Level
Daily Volume
Market Structure Shift
London Session
Trend Line Break
Untapped Order Point
US30 | Inverted Hammer at Key Supply Zone – Reversal or BreakoutUS30 just printed an inverted hammer on the 4H at a major supply zone (44,550–44,600). This is a critical decision point:
✅ Bearish Case:
If price rejects and closes back below 44,530, sellers could take control with targets at 44,380 → 44,180 → 44,020.
✅ Bullish Fakeout:
If price breaks and holds above 44,620, expect a push toward 44,700 and 44,900.
📌 What I’m Watching:
Rejection candle + bearish close → short entries.
Strong breakout candle with retest → long continuation.
Key Levels:
🔴 Resistance: 44,550–44,600
🟢 Support: 44,380 → 44,020
⚠️ Manage risk carefully. Volatility is high and liquidity hunts are common in this zone.
💬 Do you think we reject here or break out higher? Drop your thoughts below!
#US30 #DowJones #PriceAction #SmartMoney #TradingView #TechnicalAnalysis #IndicesTrading
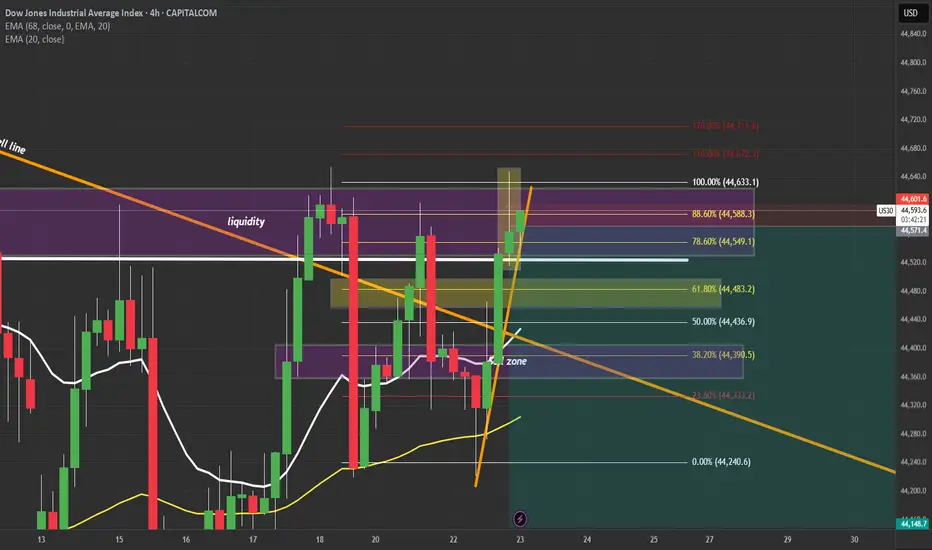
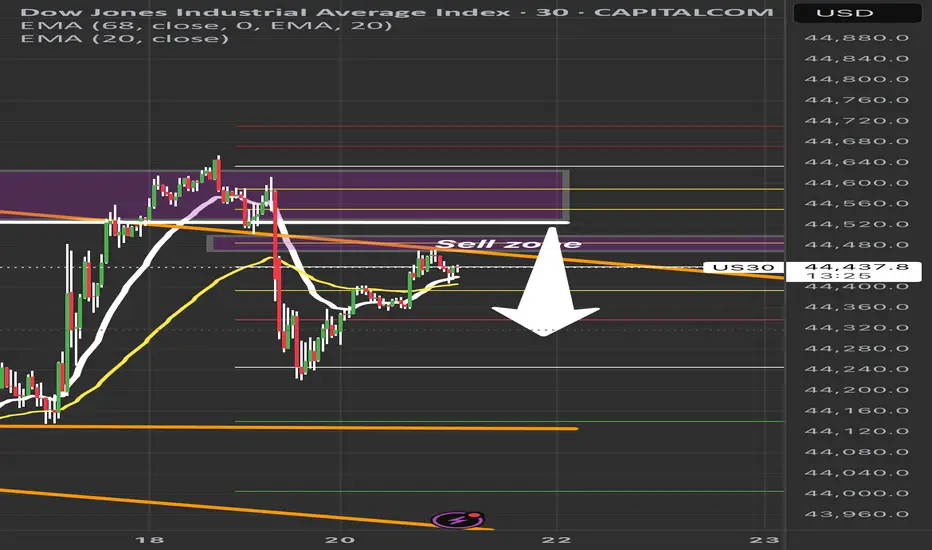
US30 Sell Setup – Watching Key Retracement ZonePrice is pulling back into a key sell zone (44,480–44,550) after a strong bearish move.
✅ Confluences:
• Previous liquidity zone
• 50–61.8% Fib retracement
• EMA rejection overhead
Plan: Waiting for bearish confirmation before short entry.
🎯 Targets:
TP1: 44,300
TP2: 44,150
TP3: 44,000
❌ Invalidation: Break above 44,600.
Patience = Precision. No confirmation, no trade.
#US30 #DowJones #TradingSetup #SmartMoneyConcepts #PriceAction #LiquidityZones #ForexTrading #DayTrading #IndicesTrading #SupplyAndDemand #TechnicalAnalysis #Fibonacci #MarketStructure #ScalpSetup #SwingTrade #RiskManagement #TradingEducation
Dow Jones Potential UpsidesHey Traders, in the coming week we are monitoring US30 for a buying opportunity around 44,650 zone, Dow Jones is trading in an uptrend and currently is in a correction phase in which it is approaching the trend at 44,650 support and resistance area.
Trade safe, Joe.

US30: MEXT MOVE!!Longs on US30!! I see price heading towards the EH on the !W chart because above it rests a pool of liquidity. Entry on 1hr missed entry on 15min.

US30 Technical Breakdown – 07/24/2025📍 US30 Technical Breakdown – 07/24/2025
🔥 New highs achieved — bulls pushed straight through the 44,867 ceiling and tagged 45,082 before pulling back slightly. This is a key psychological level, and price is now consolidating just below.
We’ve officially shifted into breakout territory. Momentum is strong, and EMAs are fully bullish. But after such a run, we may be due for a retest or short-term correction. Let’s break it down 👇
📊 Current Market Structure:
✅ Series of higher highs & higher lows
✅ EMA 9 > EMA 21 > Price (bullish structure)
✅ Breakout from range: 44,867 → 45,082
🧱 Minor resistance at 45,050–45,082
⚠️ Watch for pullback to 44,750–44,800 zone
🔑 Key Levels:
🔼 Resistance:
45,050 → 45,082 (fresh supply zone)
45,200+ (blue sky if broken)
🔽 Support:
44,867 (former resistance turned support)
44,734 (EMA confluence)
44,450–44,600 (demand zone)
🧠 Market Bias:
📈 Still bullish, but extended.
Above 44,867 = continuation zone
Below 44,734 = momentum shift likely
Rejection at 45,082 could give scalpers a play short 🔄
💡 Potential Trade Setups:
📈 Breakout Buy (Momentum Entry):
Entry: Above 45,100
TP1: 45,200
TP2: 45,300
SL: Below 45,040
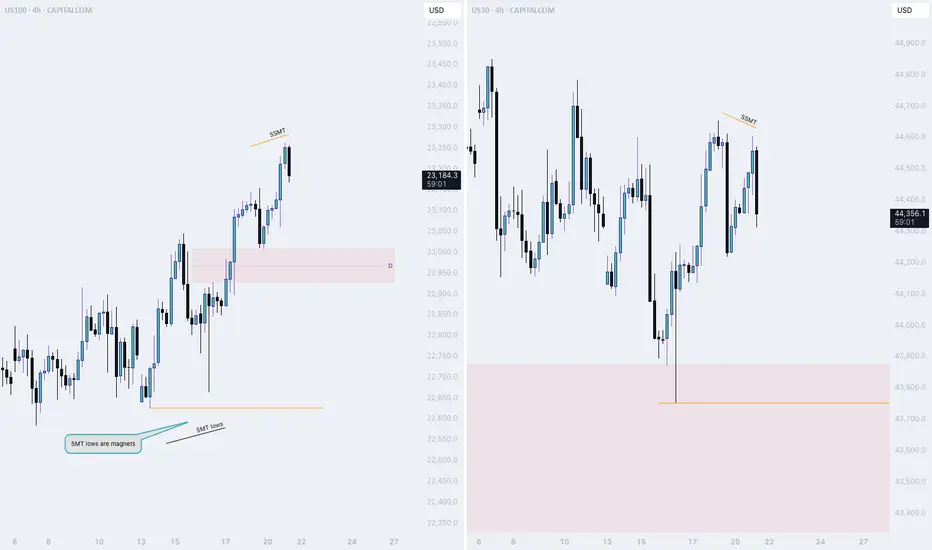
NQ thread: Short ideaMonday started off bullish, but only to drop at the end of the session.
Here is a thread on what is happening and on which narratives I view the market
Starting off with the 4H Time frame, we witnessed NQ and ES taking last weeks high.
YM did not.
This is the first stage of the movement. To find the second stage, we need to dive deeper into the lower timeframes..
Litty Like US30!!I'm purely going off the Week chart. 4hr MSS+ 4hr BPR gives me reasons to buy price. I'm targeting the Equal Highs on the Weekly chart.

DowJones bullish continuation breakout support at 43990Key Support and Resistance Levels
Resistance Level 1: 45000
Resistance Level 2: 45440
Resistance Level 3: 46000
Support Level 1: 43990
Support Level 2: 43700
Support Level 3: 43420
This communication is for informational purposes only and should not be viewed as any form of recommendation as to a particular course of action or as investment advice. It is not intended as an offer or solicitation for the purchase or sale of any financial instrument or as an official confirmation of any transaction. Opinions, estimates and assumptions expressed herein are made as of the date of this communication and are subject to change without notice. This communication has been prepared based upon information, including market prices, data and other information, believed to be reliable; however, Trade Nation does not warrant its completeness or accuracy. All market prices and market data contained in or attached to this communication are indicative and subject to change without notice.
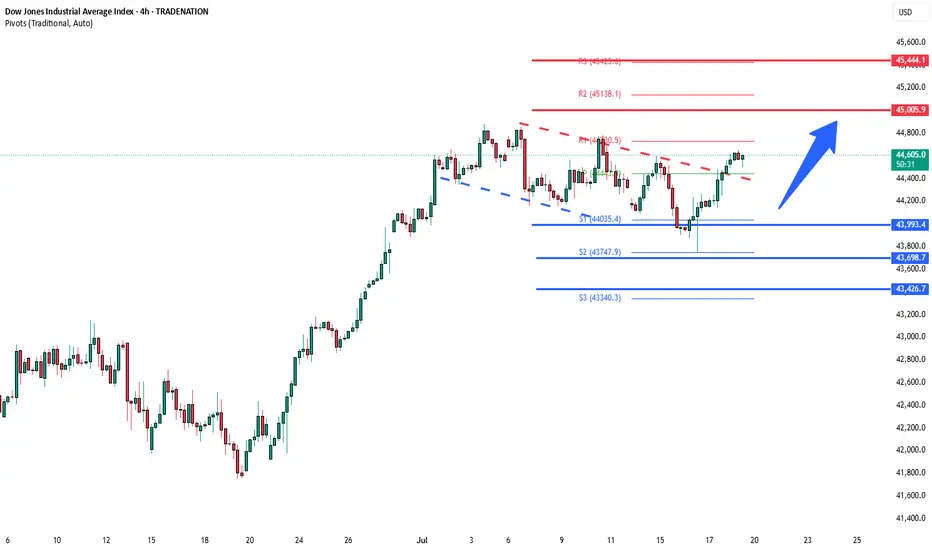
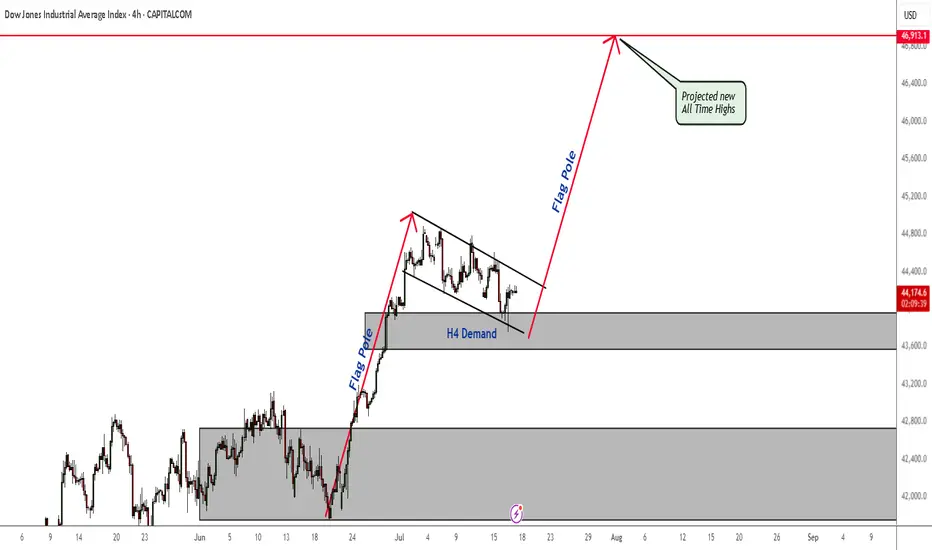
US30 Bullish Flag - All Time Highs The plan for Dow Jones has not changed. Price is still in an H4 demand zone. As soon as price breaks out of this bull flag, nothing will stop the bull run and new All Time Highs being claimed.
Don't miss it.
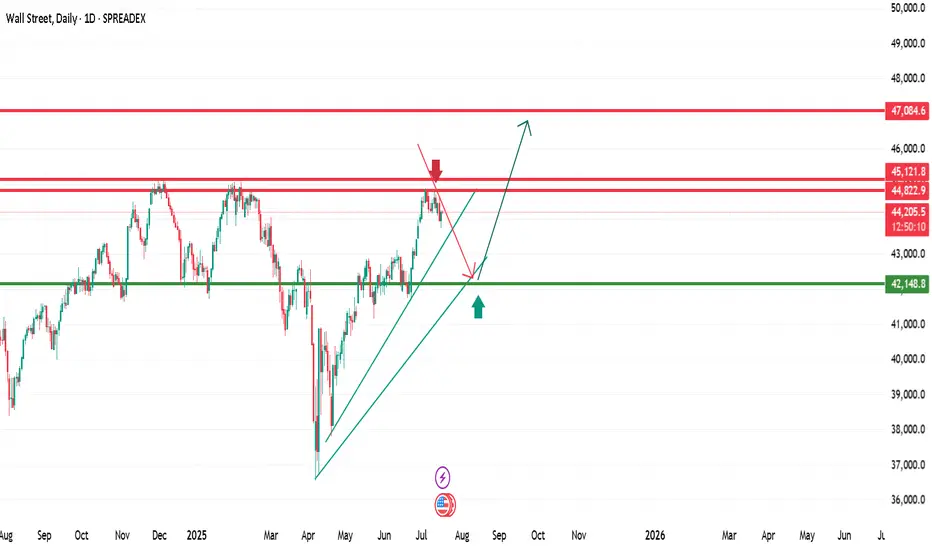
The trend has decreasedAt the moment, the trend has decreased, it will probably fall to the bottom of the pivot daily, and then it will rise and continue to fall to the bottom of the pivot for the first week
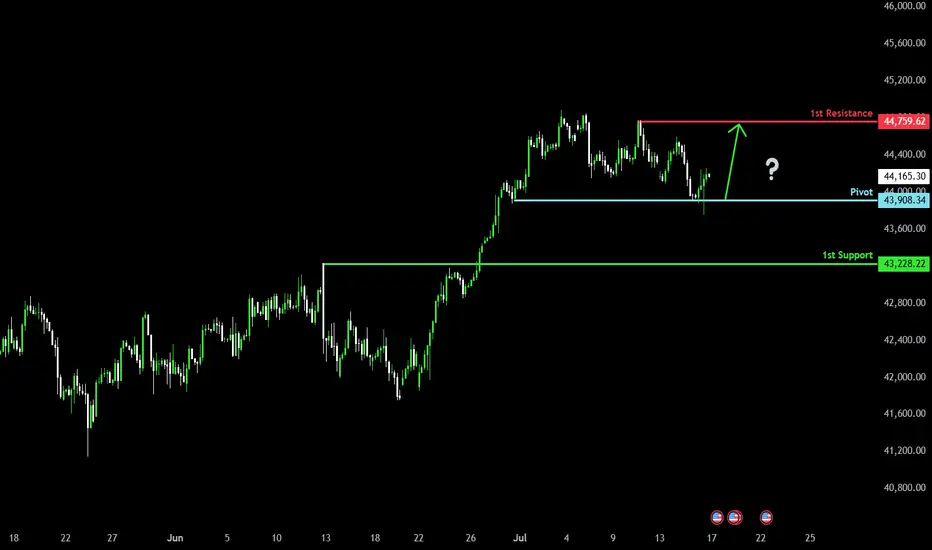
Could the price rise from here?Dow Jones (US30) has bounced off the pivot and could potentially rise to the 1st resistance which acts as a pullback resistance.
Pivot: 43,908.34
1st Support: 43,228.22
1st Resistance: 44,759.62
Risk Warning:
Trading Forex and CFDs carries a high level of risk to your capital and you should only trade with money you can afford to lose. Trading Forex and CFDs may not be suitable for all investors, so please ensure that you fully understand the risks involved and seek independent advice if necessary.
Disclaimer:
The above opinions given constitute general market commentary, and do not constitute the opinion or advice of IC Markets or any form of personal or investment advice.
Any opinions, news, research, analyses, prices, other information, or links to third-party sites contained on this website are provided on an "as-is" basis, are intended only to be informative, is not an advice nor a recommendation, nor research, or a record of our trading prices, or an offer of, or solicitation for a transaction in any financial instrument and thus should not be treated as such. The information provided does not involve any specific investment objectives, financial situation and needs of any specific person who may receive it. Please be aware, that past performance is not a reliable indicator of future performance and/or results. Past Performance or Forward-looking scenarios based upon the reasonable beliefs of the third-party provider are not a guarantee of future performance. Actual results may differ materially from those anticipated in forward-looking or past performance statements. IC Markets makes no representation or warranty and assumes no liability as to the accuracy or completeness of the information provided, nor any loss arising from any investment based on a recommendation, forecast or any information supplied by any third-party.
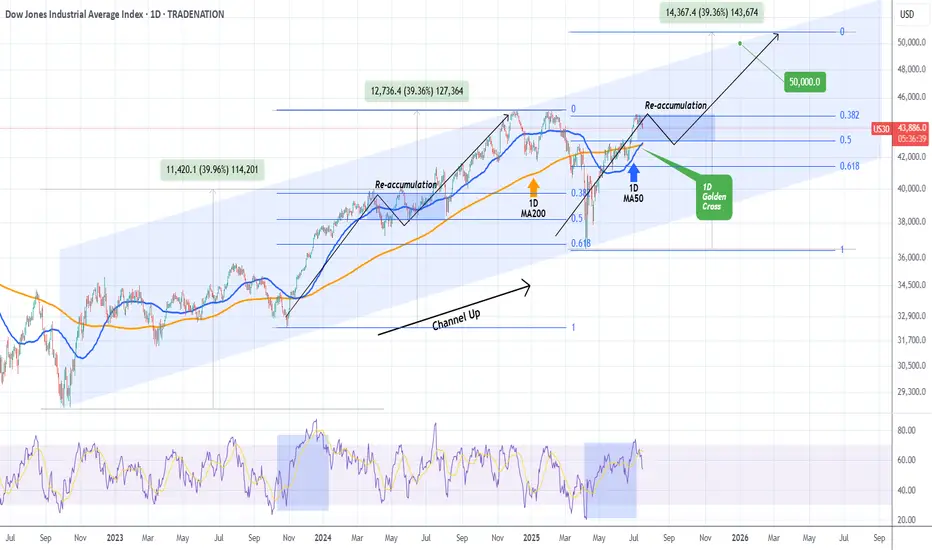
DOW JONES formed 1st 1D Golden Cross since 2022!Dow Jones (DJIA) completed on Monday its 1st Golden Cross on the 1D time-frame since December 12 2022! This powerful bullish pattern comes with the price close to its All Time High (ATH).
Being inside almost a 3-year Channel Up, the current rise is the pattern's latest Bullish Leg following the April 07 2025 bottom (Higher Low). Both previous Bullish Legs rose by +39.96% before forming a Higher High.
Based on the Fibonacci retracement levels, last time the previous Bullish Leg was within the 0.382 - 0.5 Fibonacci Zone, it formed a Re-accumulation Phase for 3 months. As a result, we shouldn't dismiss the fact of trading sideways for the rest of the Summer and then picking up the pace. Our end-of-year Target remains 50000.
-------------------------------------------------------------------------------
** Please LIKE 👍, FOLLOW ✅, SHARE 🙌 and COMMENT ✍ if you enjoy this idea! Also share your ideas and charts in the comments section below! This is best way to keep it relevant, support us, keep the content here free and allow the idea to reach as many people as possible. **
-------------------------------------------------------------------------------
Disclosure: I am part of Trade Nation's Influencer program and receive a monthly fee for using their TradingView charts in my analysis.
💸💸💸💸💸💸
👇 👇 👇 👇 👇 👇
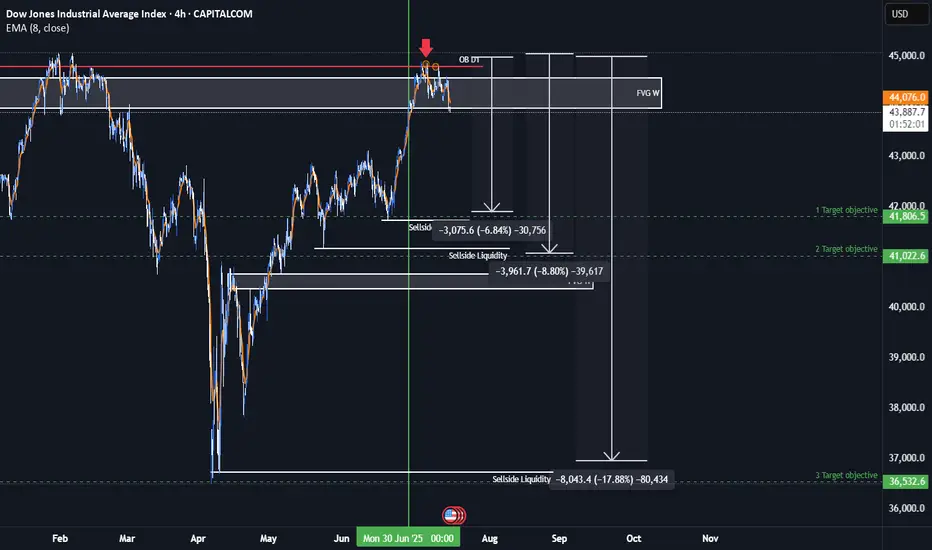
US30 Bearish IdeaAs we can see this is a anticipation of us being in a quarterly shift in the markets and having an assumption that we had a retracement up to collect more orders for smart money to go short. We have relative strength with US30 against both NASDAQ and the SP500. We have seen resistance in our premium arrays of our weekly FVG and daily order block
* Fundamental analysis:
We are are having a shift in our bond yields which could potentially effect the dollar giving it strength and you add the fact that dollar is under valued when we have a stronger dollar rate than the rest of the basket currencies we could see it negatively effect the Dow this quarter. The Dow is very over valued and we have had consistent quantitative easing from the Fed and the Fed balance sheet has been still consistently decreasing. The commercial interest have also seen a great rise of buying dollar and if dollar is being bought up then something would need to be sold.