US30 Bearish Below 44490 – Watching 44180 US30 Analysis
US30 remains bearish below 44490, with downside targets at 44180 and 43960.
A 1H close below 44180 would confirm continuation toward 43630.
To turn bullish, price must break above 44490.
Pivot: 44430
Resistance: 44460, 44550, 44760
Support: 44180, 43960, 43630
US30FU trade ideas

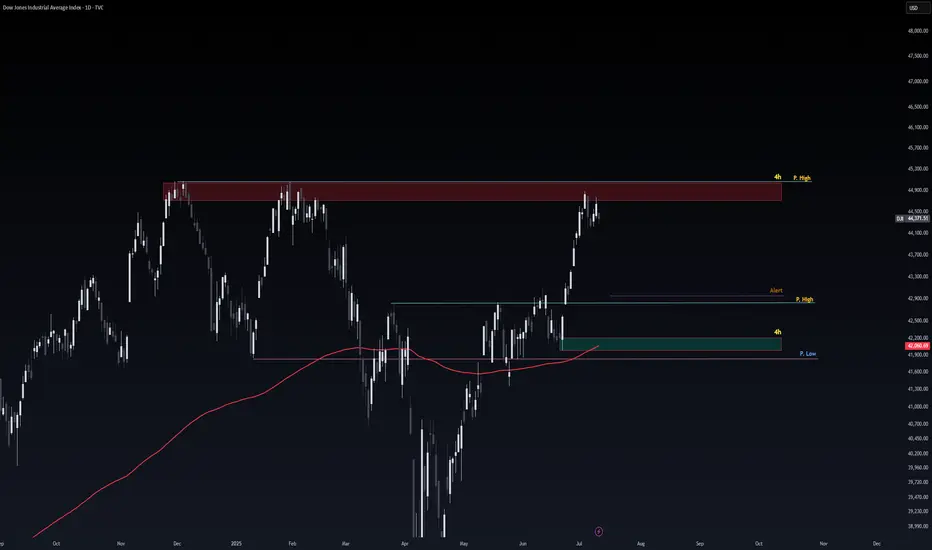
Safe Entry DJIObvious Movement I Guess.
P.High(Previous High) Act As good Support for price to Respect.
Note: 1- Potentional of Strong Buying Zone:
We have two scenarios must happen at The Mentioned Zone:
Scenarios One: strong buying volume with reversal Candle.
Scenarios Two: Fake Break-Out of The Buying Zone.
Both indicate buyers stepping in strongly. NEVER Join in unless one showed up.
2- How to Buy Stock (safe way):
On 1H TF when Marubozu/Doji Candle show up which indicate strong buyers stepping-in.
Buy on 0.5 Fibo Level of the Marubozu/Doji Candle, because price will always and always re-test the
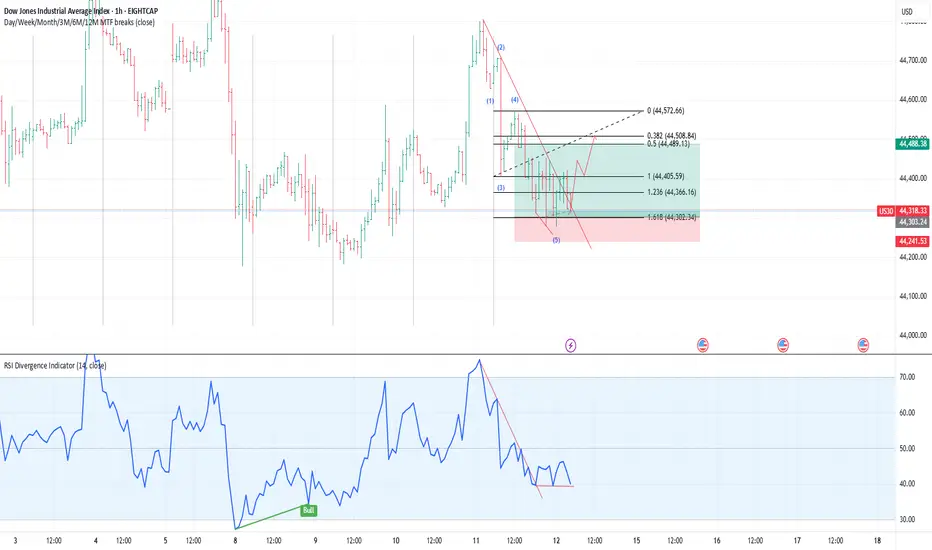
US30SIGNAL: BUY
A) SETUP: B (h1 wave5 to Correction)
B) CONFIRMATION:
1) SBT: done
2) RSI DIVERGENCE: done
3) MOMENTUM CANDLE: done
C) RR = 1:3
US30 UNCERTAINTY We could see a possible bounce on 4465. or price could break below and target 43700
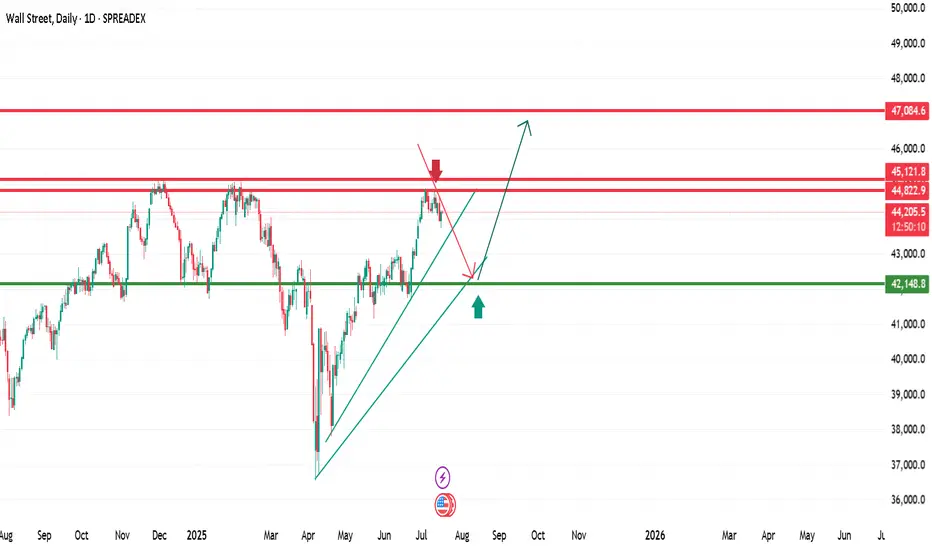
US30 Weekly Sell Setup: 44400 Entry, 45051 SL and 42400 TargetThis is a proposed sell setup for US30 with longer time frames weekly and H4 timeframe target. The strategy anticipates a significant downward move, capitalizing on current market conditions and key technical levels.
Entry Point: Sell at 44450
Stop Loss (SL): 45051
Target (TP1): 42400
Target (TP2): Deep down if the support fails to hold
Reasoning & Details:
Resistance at 44400-44500: The US30 has been consolidating around the 44400-44500 region. This area has consistently acted as a significant resistance level, as evidenced by multiple rejections in recent trading. A failure to sustain price above this level, or a confirmed bearish candlestick pattern in this zone, would strongly reinforce the sell setup.
Weekly H4 Timeframe Perspective: The target of 42400 is based on a weekly analysis, suggesting that this is not a short term scalp but rather a move expected to unfold over several days or even weeks. This longer timeframe allows for wider price swings and potential pullbacks without invalidating the overall bearish thesis, focusing on the broader trend.
Stop Loss Placement (45055): The stop loss at 45055 is strategically placed above recent highs and psychological resistance levels, specifically around the 45000-45100 area. This placement aims to protect capital by exiting the trade if the market unexpectedly breaks above critical resistance, indicating a continuation of the uptrend. 45042.77 is an identified resistance. Placing the stop loss slightly above this provides a reasonable buffer.
Initial Target at 42400 (Key Support): This target aligns with a key support level that, if reached, would represent a substantial decline from the entry point. identified 42430 as a critical resistance, which could now act as a support if broken from above. A strong move to this level would indicate significant bearish momentum.
Further Downside Potential (Beyond 42000): A critical aspect of this idea is the potential for further price depreciation if the 42000 support level fails to hold. Should price break convincingly below 42000, it would signal a deeper bearish move, opening the door for a more extended sell-off. This suggests a potential for a cascading effect, where a break of this major psychological and technical support could lead to significant further declines, potentially towards 41155 or even 40215 as indicated by some pessimistic forecasts.
Note; This is a trading idea based on technical analysis and current market observations. Trading in financial markets carries inherent risks. Always conduct your own thorough research and manage your risk appropriately.

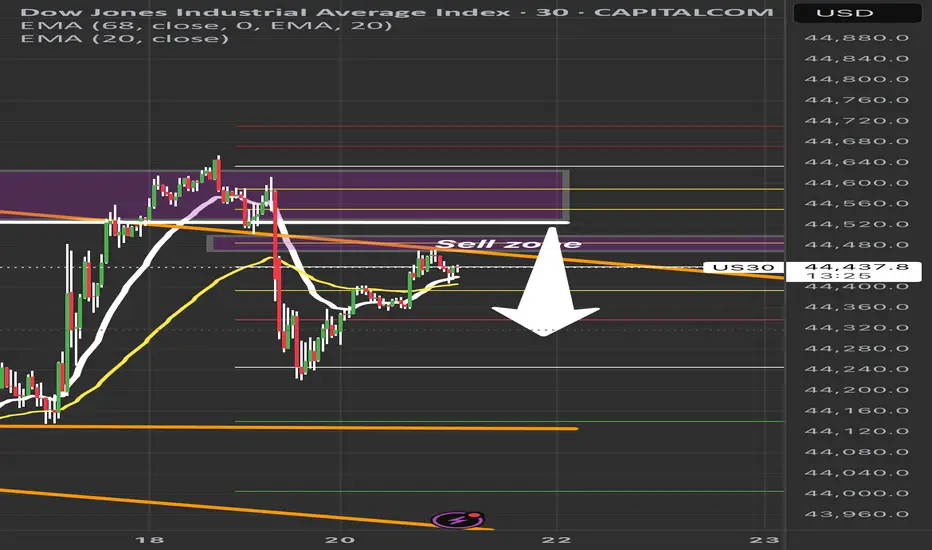
US30 Sell Setup – Watching Key Retracement ZonePrice is pulling back into a key sell zone (44,480–44,550) after a strong bearish move.
✅ Confluences:
• Previous liquidity zone
• 50–61.8% Fib retracement
• EMA rejection overhead
Plan: Waiting for bearish confirmation before short entry.
🎯 Targets:
TP1: 44,300
TP2: 44,150
TP3: 44,000
❌ Invalidation: Break above 44,600.
Patience = Precision. No confirmation, no trade.
#US30 #DowJones #TradingSetup #SmartMoneyConcepts #PriceAction #LiquidityZones #ForexTrading #DayTrading #IndicesTrading #SupplyAndDemand #TechnicalAnalysis #Fibonacci #MarketStructure #ScalpSetup #SwingTrade #RiskManagement #TradingEducation
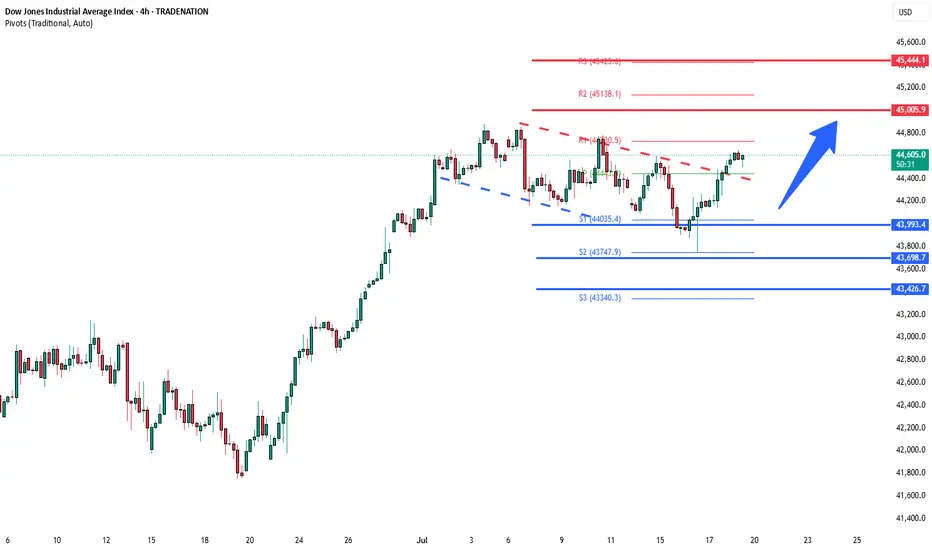
DowJones bullish continuation breakout support at 43990Key Support and Resistance Levels
Resistance Level 1: 45000
Resistance Level 2: 45440
Resistance Level 3: 46000
Support Level 1: 43990
Support Level 2: 43700
Support Level 3: 43420
This communication is for informational purposes only and should not be viewed as any form of recommendation as to a particular course of action or as investment advice. It is not intended as an offer or solicitation for the purchase or sale of any financial instrument or as an official confirmation of any transaction. Opinions, estimates and assumptions expressed herein are made as of the date of this communication and are subject to change without notice. This communication has been prepared based upon information, including market prices, data and other information, believed to be reliable; however, Trade Nation does not warrant its completeness or accuracy. All market prices and market data contained in or attached to this communication are indicative and subject to change without notice.
Dow Jones: Shaking amid rumors of Powell’s dismissalIon Jauregui – Analyst at ActivTrades
The main Wall Street indices closed Thursday’s session with mixed results. Comments from Trump stating he had no plans to fire Powell but “doesn’t rule anything out” except in cases of fraud, along with Powell’s declaration that he will serve his full term until mid-2026, pressured the market. The U.S. market has been dealing with these dismissal tensions for seven months, which made the Dow Jones appear weaker, while the S&P 500 and Nasdaq managed to stay in positive territory, supported by strong earnings from key companies. At the session’s start, the Dow Jones fell 0.09% to 44,202 points, while the S&P 500 rose 0.04% to 6,266 points and the Nasdaq gained 0.17% to 20,777 points. However, the Dow Jones closed at 44,484.49 points (+0.52%), the S&P 500 at 6,297.36 points (+0.54%), and the Nasdaq at 20,885.65 points (+0.75%). The day was marked by rumors from the White House, where an official stated that Trump would “probably soon” fire Jerome Powell. The news triggered an intraday drop of over 260 points in the Dow Jones, although markets later moderated losses after clarifications from the former president himself.
An early dismissal of Powell would likely impact the market very negatively and generate significant chaos. Trump’s interest in pressuring the Fed for rate cuts, although he cannot legally dismiss the central bank’s president, has been on the table since the start of his term. This has caused pronounced volatility movements. Meanwhile, the 10-year U.S. Treasury yield fell to 4.449%, as the market reduced the probability of a rate cut in September from 66% to 55% (CME FedWatch).
On the macroeconomic front, June retail sales rose 0.6%, far exceeding the expected 0.1%. Weekly jobless claims stood at 221,000, also below expectations. With these results, Trump has little leverage to challenge the Fed.
Notable corporate results:
PepsiCo surprised positively with EPS of $2.12 (vs. $2.03 expected) and rose 5.7% at the open.
United Airlines advanced 3.6%, beating earnings expectations with EPS of $3.87, although revenues slightly disappointed.
GE Aerospace raised its 2025 EPS forecast to a range of $5.60–5.80, driven by strong aftermarket demand.
Netflix reported after the close, with expectations of $7.09 EPS and $11.06 billion in revenue.
TSMC led chip sector gains, rising more than 3% after announcing record profits thanks to AI. AMD, NVIDIA, and Super Micro also traded higher.
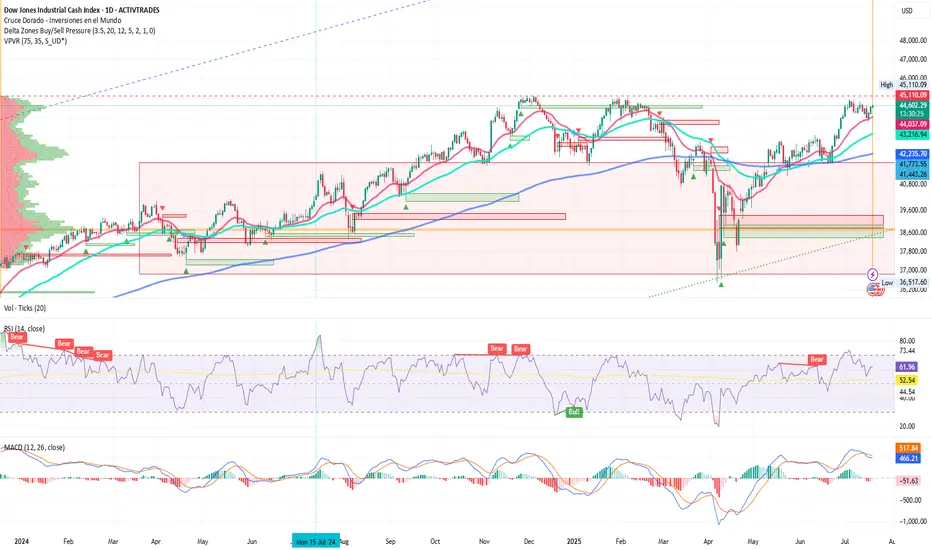
Technical Analysis
Observing the Dow Jones daily chart (Ticker AT: USAIND), since late April the index has moved upward toward its long-term control zone around 42,230 points, where the Point of Control (POC) acts as support for the current rally. In recent days, candles have used the 50-day moving average as support. The price expansion that began on June 6 with a golden cross appears solid. The bullish delta pressure zones from February and last year’s Christmas rally coincide with the current trading zone, suggesting a potential fourth attempt to break the current all-time highs at 45,110.09 points in pursuit of 46,000. If this price area is not breached, a pullback toward the POC zone could occur, and if that level fails to hold, a drop toward 39,600 points may follow.
*******************************************************************************************
La información facilitada no constituye un análisis de inversiones. El material no se ha elaborado de conformidad con los requisitos legales destinados a promover la independencia de los informes de inversiones y, como tal, debe considerarse una comunicación comercial.
Toda la información ha sido preparada por ActivTrades ("AT"). La información no contiene un registro de los precios de AT, o una oferta o solicitud de una transacción en cualquier instrumento financiero. Ninguna representación o garantía se da en cuanto a la exactitud o integridad de esta información.
Cualquier material proporcionado no tiene en cuenta el objetivo específico de inversión y la situación financiera de cualquier persona que pueda recibirlo. La rentabilidad pasada y las estimaciones no sinónimo ni un indicador fiable de la rentabilidad futura. AT presta un servicio exclusivamente de ejecución. En consecuencia, toda persona que actúe sobre la base de la información facilitada lo hace por su cuenta y riesgo. Los tipos de interés pueden cambiar. El riesgo político es impredecible. Las acciones de los bancos centrales pueden variar. Las herramientas de las plataformas no garantizan el éxito.
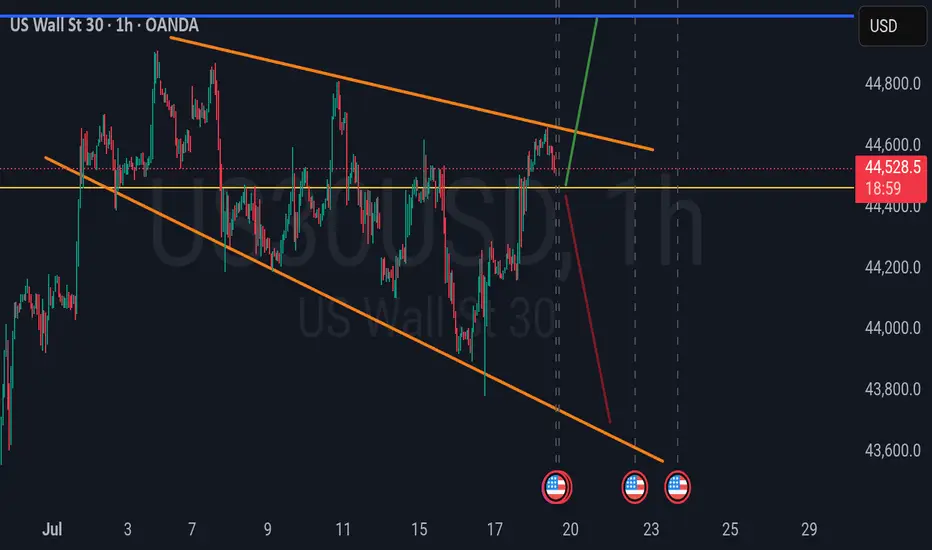
The trend has decreasedAt the moment, the trend has decreased, it will probably fall to the bottom of the pivot daily, and then it will rise and continue to fall to the bottom of the pivot for the first week
NQ thread: Short ideaMonday started off bullish, but only to drop at the end of the session.
Here is a thread on what is happening and on which narratives I view the market
Starting off with the 4H Time frame, we witnessed NQ and ES taking last weeks high.
YM did not.
This is the first stage of the movement. To find the second stage, we need to dive deeper into the lower timeframes..
Litty Like US30!!I'm purely going off the Week chart. 4hr MSS+ 4hr BPR gives me reasons to buy price. I'm targeting the Equal Highs on the Weekly chart.

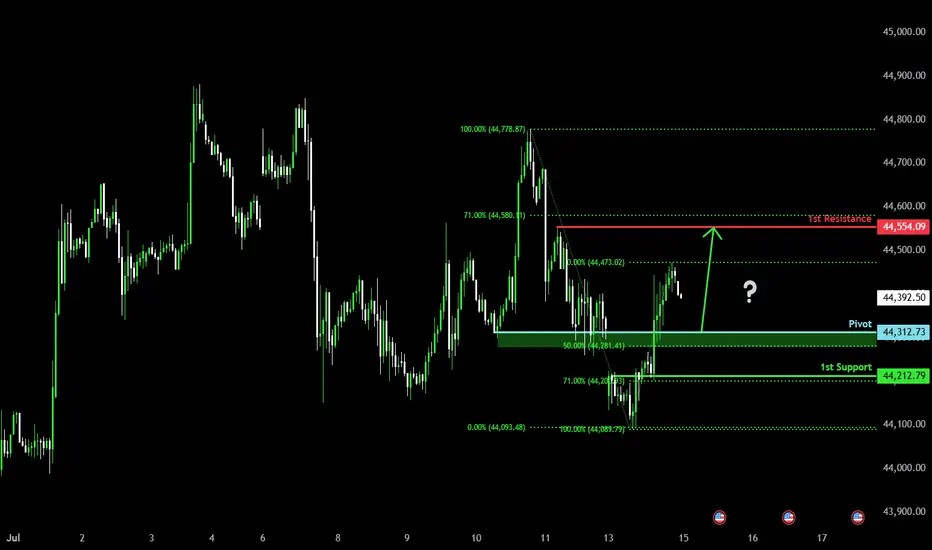
Bullish bounce off pullback resistance?Dow Jones (US30) is falling towards the pivot and could bounce to the 1st resistance.
Pivot: 44,312.73
1st Support: 44,212.79
1st Resistance: 44,554.09
Risk Warning:
Trading Forex and CFDs carries a high level of risk to your capital and you should only trade with money you can afford to lose. Trading Forex and CFDs may not be suitable for all investors, so please ensure that you fully understand the risks involved and seek independent advice if necessary.
Disclaimer:
The above opinions given constitute general market commentary, and do not constitute the opinion or advice of IC Markets or any form of personal or investment advice.
Any opinions, news, research, analyses, prices, other information, or links to third-party sites contained on this website are provided on an "as-is" basis, are intended only to be informative, is not an advice nor a recommendation, nor research, or a record of our trading prices, or an offer of, or solicitation for a transaction in any financial instrument and thus should not be treated as such. The information provided does not involve any specific investment objectives, financial situation and needs of any specific person who may receive it. Please be aware, that past performance is not a reliable indicator of future performance and/or results. Past Performance or Forward-looking scenarios based upon the reasonable beliefs of the third-party provider are not a guarantee of future performance. Actual results may differ materially from those anticipated in forward-looking or past performance statements. IC Markets makes no representation or warranty and assumes no liability as to the accuracy or completeness of the information provided, nor any loss arising from any investment based on a recommendation, forecast or any information supplied by any third-party.
DOW JONES INDEX (US30): Classic Gap Trade
I see a gap down opening on US30 index.
As always, there is a high chance that this gap is going to be filled.
A bullish imbalance candle and a local change of character CHoCH
indicate a highly probable rise to a gap opening level.
Target - 44300
❤️Please, support my work with like, thank you!❤️
I am part of Trade Nation's Influencer program and receive a monthly fee for using their TradingView charts in my analysis.

US30US30 needs some more correction before we go bullish again.
Disclosure: We are part of Trade Nation's Influencer program and receive a monthly fee for using their TradingView charts in our analysis.

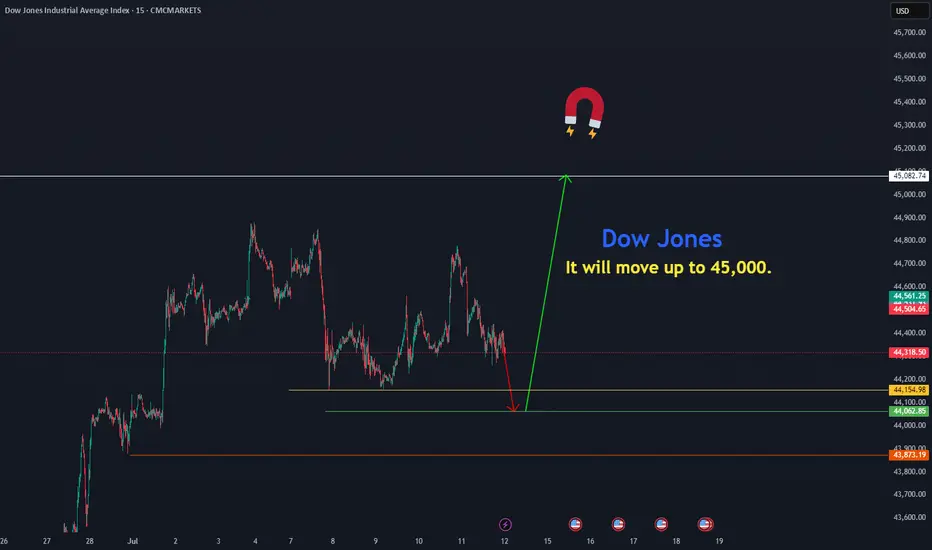
Dow Jones move upThe Dow Jones is resuming its rally toward 45,082 from the price zones of 44,154.97 and 44,000.
CMCMARKETS:US30
Dow Jones Industrial Average Index - 4 Hour Chart4-hour chart of the Dow Jones Industrial Average (US30) shows a recent price movement as of July 13, 2025. The index is currently at 44,315.0, reflecting a decline of 285.5 points (-0.64%). The chart highlights a sell signal at 44,312.0 and a buy signal at 44,318.0, with a shaded area indicating a potential downward trend from a recent peak. Key price levels include 44,855.7 (high) and 43,902.2 (low), with a support level around 44,315.0.

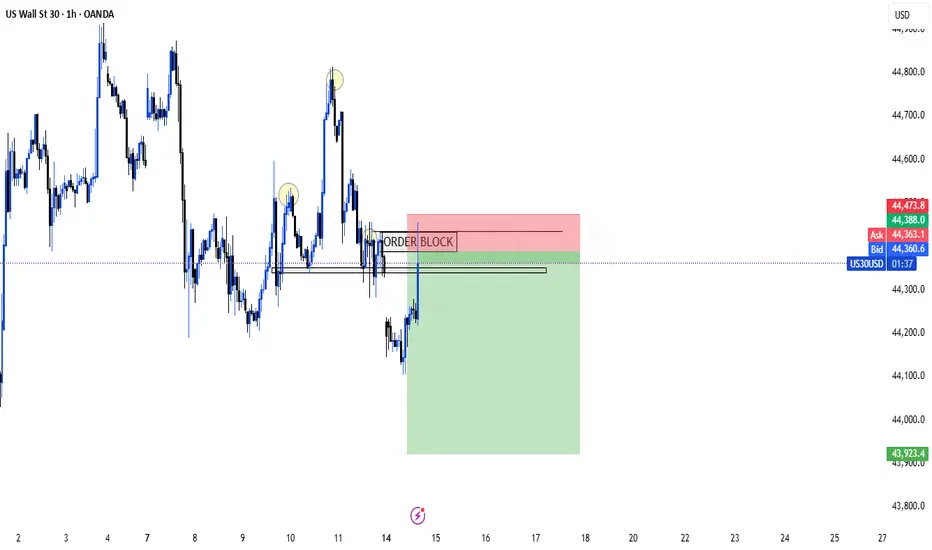
US30 prepare for the bullish 1. there is double bottom at 44152 level, i will tend to wait for the sweep meaning the price go down and hit the 4hr order block.
2. wait for 15m/ 30m TF a strong bullish momentum.
3. retest the 44152 around level or 0.618 to enter the market to long

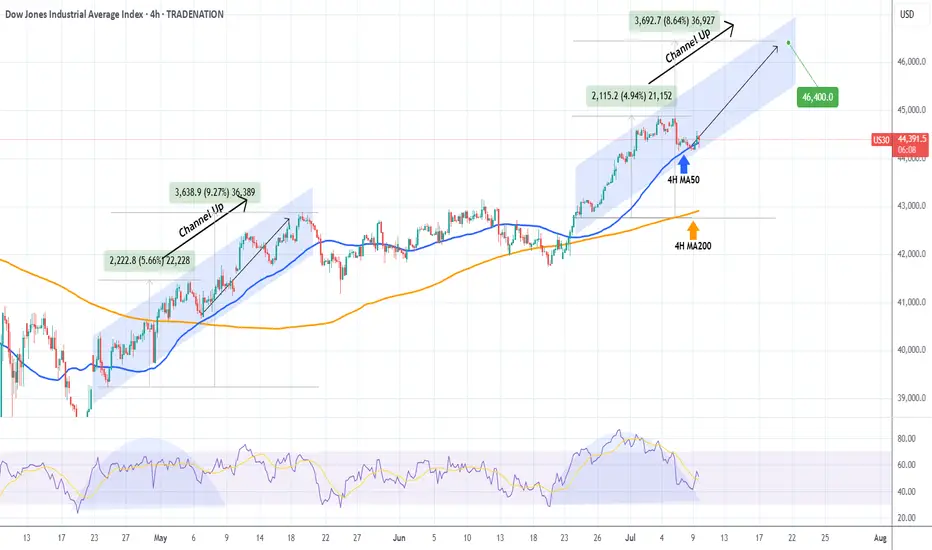
DOW JONES repeating May's pattern.Dow Jones (DJI) has been testing its 4H MA50 (blue trend-line) since yesterday, following 2 straight weeks of trading strongly above it.
If it holds and rebounds, the pattern will draw even more similarities with May's Channel Up, which after the May 06 Low, it resumed the uptrend to peak on a +9.27% rise from the bottom, before breaking below the 4H MA50.
Since the current rise is -0.70% weaker (+4.94% against +5.66%) from May's fractal, we can assume that as long as the 4H MA50 holds, we can expect a peak at 46400.
-------------------------------------------------------------------------------
** Please LIKE 👍, FOLLOW ✅, SHARE 🙌 and COMMENT ✍ if you enjoy this idea! Also share your ideas and charts in the comments section below! This is best way to keep it relevant, support us, keep the content here free and allow the idea to reach as many people as possible. **
-------------------------------------------------------------------------------
Disclosure: I am part of Trade Nation's Influencer program and receive a monthly fee for using their TradingView charts in my analysis.
💸💸💸💸💸💸
👇 👇 👇 👇 👇 👇
Us30 h4 next move Rejection near BoS
2. Break below support zone
3. Lower high formation
4. Bearish continuation towards 43,250

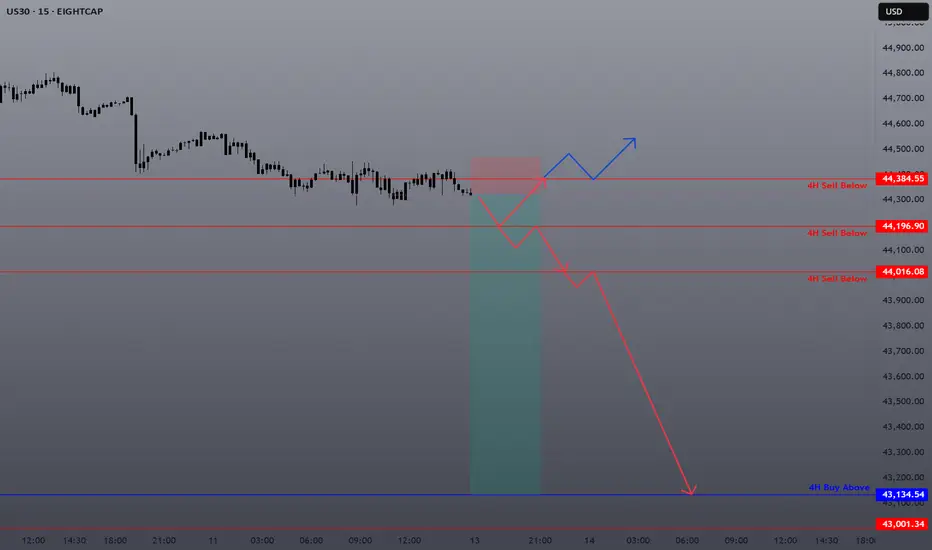
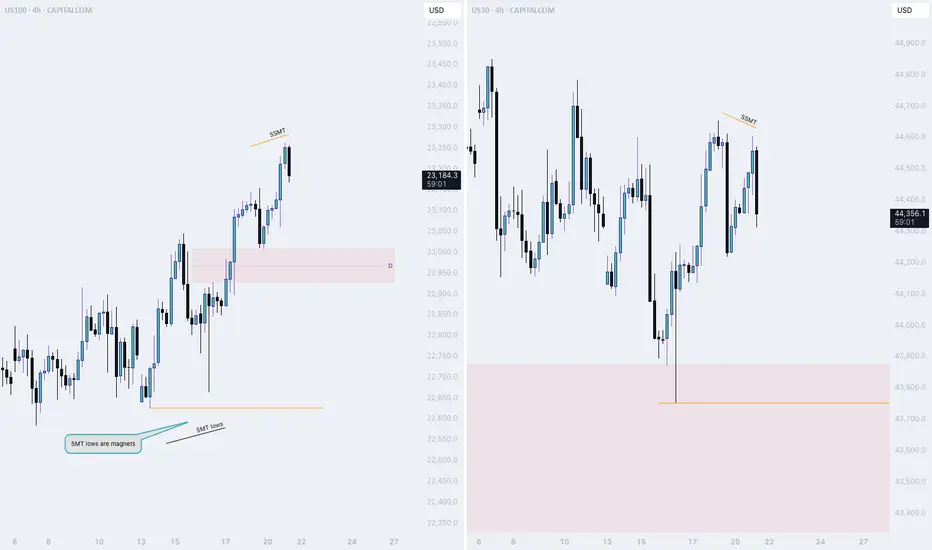
US30 Sell continuationUS 30 appears to be running SSL. 4H levels identified. Looking for Break & retest. If support does not hold on to any level, expect the bulls to return and take over.