Dow Jones approaches 45kThe Dow Jones has extended its recovery to 44,800, just shy of its 45,000 record high reached in January. The RSI is tipping into overbought territory, so some consolidation could be on the cards. Buyers will look to extend the bullish run above 45,0000 to fresh record highs. Meanwhile, immediate support is at 44,500. Below here, 44,000 could offer some support. It would take a drop below 42,900 to negate the near-term bull trend.
FC
US30FU trade ideas

US30 // There is a strong resistance point at 44.967 level. In case you consider short trading at the level I mentioned, our take profit point is 8 ema.

US30 – Bullish Breakout Retest Play (1H + 15M Confluence)US30 – Bullish Breakout Retest Play (1H + 15M Confluence)
Price has broken out of descending channel and is now retesting the 44,671–723 zone. 1H chart confirms bullish momentum within a broader uptrend. Watching for clean retest → continuation move towards 44,850+. Checklist Score: ✅ 9/10.
#US30 #DowJones #TCBstrategy #BreakoutRetest #SmartMoney #PriceAction
📌 Journal Summary Entry:
US30 Compression Play – July 7
Watching 44,723.1 key supply zone for decision. Price consolidating under zone with descending trendline. Two options: (1) Short on rejection with 2R+ to 44,512.3 demand or (2) Long breakout above 44,723 with target at 44,850–900 zone. Scored 8/10 on TCB checklist. Awaiting confirmation candle during NY session.

Upward trend Given the behavior of the index within the current resistance range, possible scenarios have been identified. It is expected that a trend change will take place and we will witness the beginning of a correction. With consolidation above the resistance range, the continuation of the upward trend will be likely.

US30 Technical Outlook – 07/07/2025📍 US30 Technical Outlook – 07/07/2025
The bulls are holding it down 💪
We’re pushing back near the top of the range — New high at 45,018 tapped!
Price is comfortably riding above both EMAs (20 & 50), showing strong trend continuation 🚀
🧠 Key Observations:
Clear breakout from previous consolidation (44,700 zone)
New higher high → momentum remains intact
EMAs continue to act as dynamic support (especially 44,688 area)
📊 Key Price Zones:
🔼 Resistance: 45,018 → Next psychological level: 45,200
🔽 Support: 44,688 → 44,500 → 44,250
📈 Trade Setup Ideas:
🔹 Long Setup (Primary Play):
Pullback entries near 44,688 EMA zone
Confirmation: Bullish engulfing or bounce on 15min/1H
Targets: 45,000 → 45,200
SL: Below 44,500
🔻 Short Setup (Cautious/Counter):
Only if strong rejection from 45,018 with breakdown back below 44,700
Target: 44,500 → 44,250
Lower TF confirmation required

Dow Jones H4 | Bullish uptrend to extend higher?The Dow Jones 30 (US30) could fall towards a swing-low support and could potentially bounce off this level to climb higher.
Buy entry is at 44,437.85 which is a swing-low support.
Stop loss is at 43,850.00 which is a level that lies underneath a swing-low support and the 23.6% Fibonacci retracement.
Take profit is at 45,046.46 which is a multi-swing-high resistance.
High Risk Investment Warning
Trading Forex/CFDs on margin carries a high level of risk and may not be suitable for all investors. Leverage can work against you.
Stratos Markets Limited (tradu.com ):
CFDs are complex instruments and come with a high risk of losing money rapidly due to leverage. 63% of retail investor accounts lose money when trading CFDs with this provider. You should consider whether you understand how CFDs work and whether you can afford to take the high risk of losing your money.
Stratos Europe Ltd (tradu.com ):
CFDs are complex instruments and come with a high risk of losing money rapidly due to leverage. 63% of retail investor accounts lose money when trading CFDs with this provider. You should consider whether you understand how CFDs work and whether you can afford to take the high risk of losing your money.
Stratos Global LLC (tradu.com ):
Losses can exceed deposits.
Please be advised that the information presented on TradingView is provided to Tradu (‘Company’, ‘we’) by a third-party provider (‘TFA Global Pte Ltd’). Please be reminded that you are solely responsible for the trading decisions on your account. There is a very high degree of risk involved in trading. Any information and/or content is intended entirely for research, educational and informational purposes only and does not constitute investment or consultation advice or investment strategy. The information is not tailored to the investment needs of any specific person and therefore does not involve a consideration of any of the investment objectives, financial situation or needs of any viewer that may receive it. Kindly also note that past performance is not a reliable indicator of future results. Actual results may differ materially from those anticipated in forward-looking or past performance statements. We assume no liability as to the accuracy or completeness of any of the information and/or content provided herein and the Company cannot be held responsible for any omission, mistake nor for any loss or damage including without limitation to any loss of profit which may arise from reliance on any information supplied by TFA Global Pte Ltd.
The speaker(s) is neither an employee, agent nor representative of Tradu and is therefore acting independently. The opinions given are their own, constitute general market commentary, and do not constitute the opinion or advice of Tradu or any form of personal or investment advice. Tradu neither endorses nor guarantees offerings of third-party speakers, nor is Tradu responsible for the content, veracity or opinions of third-party speakers, presenters or participants.

US30 LONG There's still bullish momentum on US30. Price has done third touch on US30, it printed a strong bullish signal for another bullish push, potentially to 45,000 psychological level.

US30US30 is due correction, it can start now or just above the ALH.
Disclosure: We are part of Trade Nation's Influencer program and receive a monthly fee for using their TradingView charts in our analysis.

US30 Will Move Higher! Buy!
Take a look at our analysis for US30.
Time Frame: 1h
Current Trend: Bullish
Sentiment: Oversold (based on 7-period RSI)
Forecast: Bullish
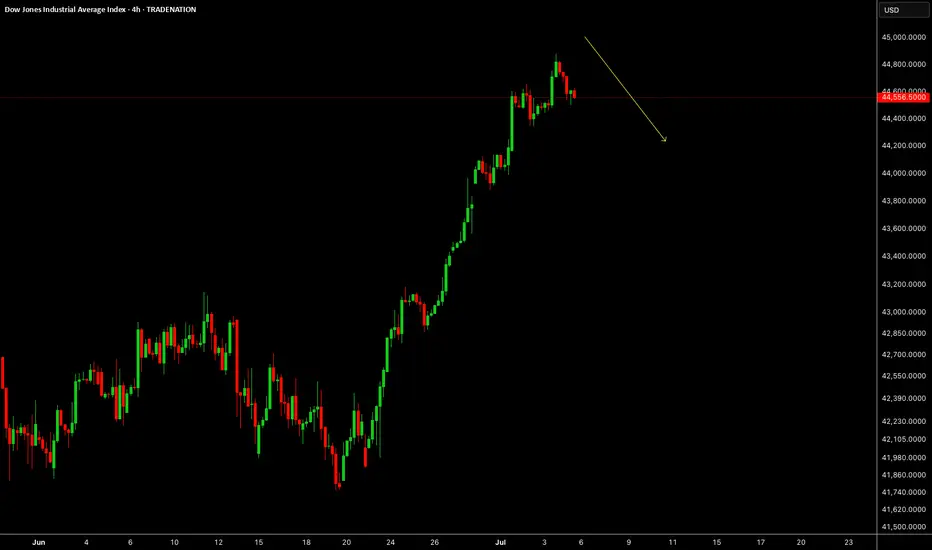
The market is testing a major horizontal structure 44,556.0.
Taking into consideration the structure & trend analysis, I believe that the market will reach 44,867.4 level soon.
P.S
Please, note that an oversold/overbought condition can last for a long time, and therefore being oversold/overbought doesn't mean a price rally will come soon, or at all.
Disclosure: I am part of Trade Nation's Influencer program and receive a monthly fee for using their TradingView charts in my analysis.
Like and subscribe and comment my ideas if you enjoy them!

DJIDou John's in a bit to a new one in a while but it is still in bed now but it is not going in to it I can but it's a new day in a while so it will work but it's still available I will work with a new day USA and then we will go with
DOW Jones go upCMCMARKETS:US30
Reaching the price level of 45,082.74 is inevitable. From the current closing price, there is a high probability of continuation toward the ATH.
However, the price levels 44,440 and 44,344.95 are also acceptable zones from which the move toward 45,082.74 may begin.
At the start of the upcoming week, as soon as the market opens, we are likely to move toward the ATH from one of these three levels.

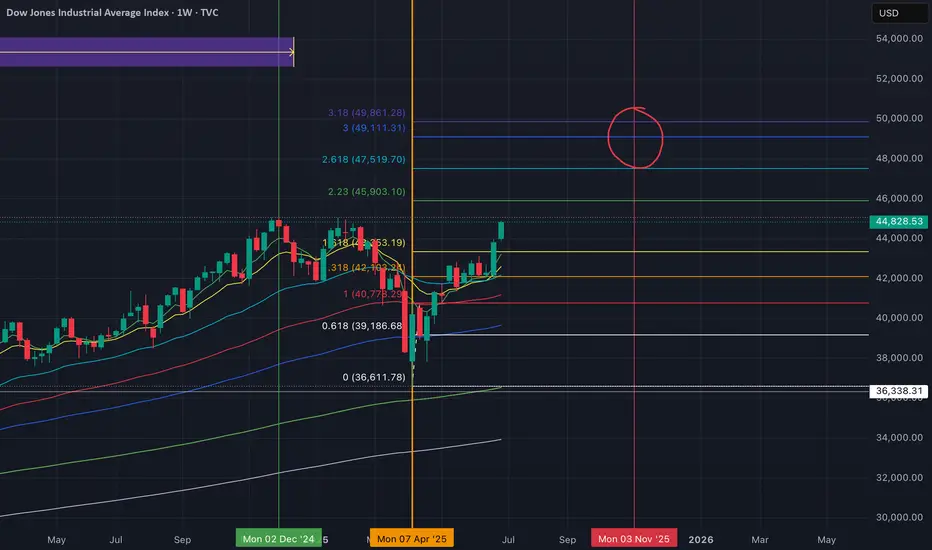
Dow Could Be Gearing Up for a Run Toward 50,000We’ve seen it before—and we might be seeing it again . The Dow Jones is showing a familiar pattern, and here’s what’s happening:
The index has been repeatedly hitting the 1.618 Fibonacci extension from previous ranges.
Right now, we’re approaching the 100% extension between the last swing high (~45,000) and swing low (~36,600).
If the Dow breaks above that previous high at 45,000, there's a good chance we’ll see the pattern repeat—with 50,000 as the next target.
It’s all about that breakout confirmation. Until then, we watch and wait.
This market has a memory—let’s see if it chooses to repeat it again.

US30 Scalp Buy SetupIf upside liquidation taken first before the entry is achieved then don't take the entry, wait for the entry and set tp & relax.

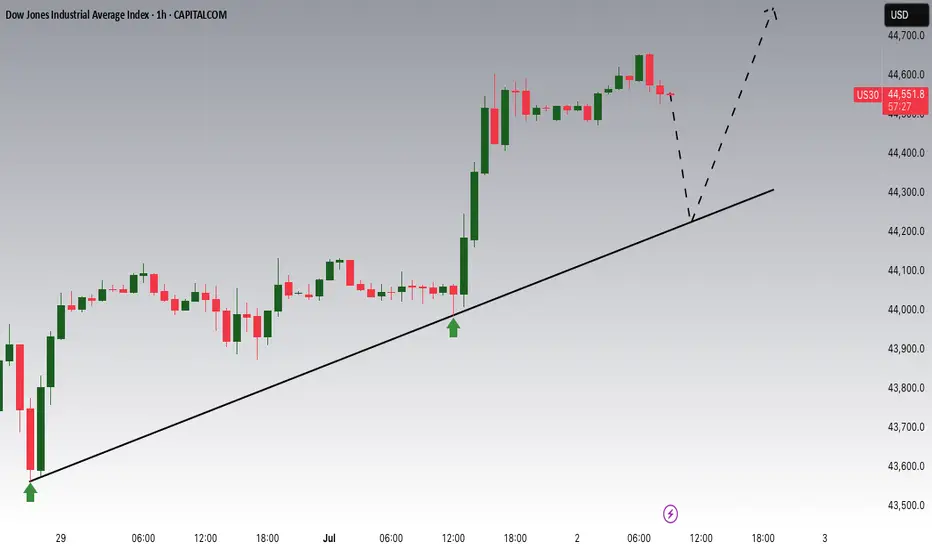
Trendline / Channel retestDJI hits this trendline / channel bottom again. I expect a rejection and a correction from it. It's not a classic channel, so a false break-in is allowed.
US30: Will Go Up! Long!
My dear friends,
Today we will analyse US30 together☺️
The market is at an inflection zone and price has now reached an area around 44,585.50 where previous reversals or breakouts have occurred.And a price reaction that we are seeing on multiple timeframes here could signal the next move up so we can enter on confirmation, and target the next key level of 44,663.28.Stop-loss is recommended beyond the inflection zone.
❤️Sending you lots of Love and Hugs❤️

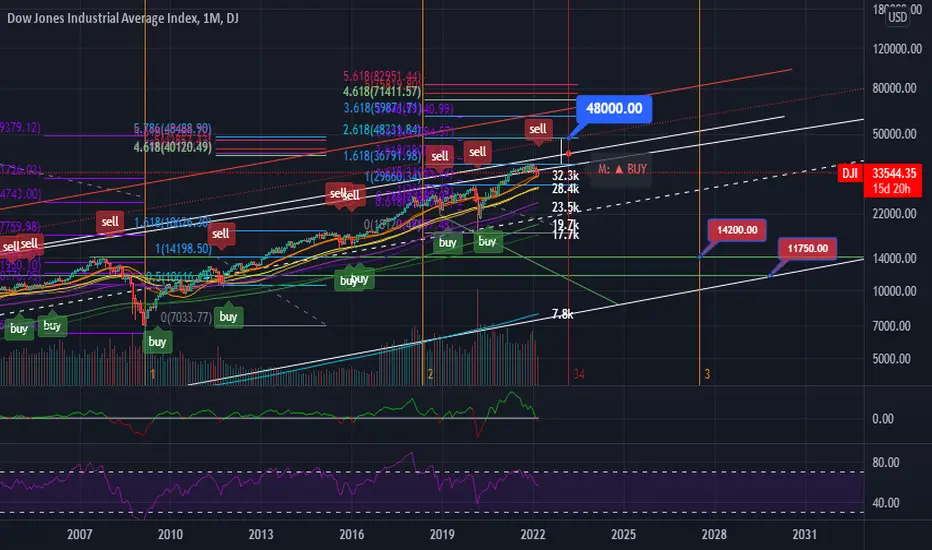
Dow Jones (DJI) Logarithmic Macro Outlook Log target: 48k
The dotted red line is adjusted for inflation. The stock market cycles are lengthening. Continued downside till EOM followed by a final melt-up rally that will bring the end of grand wave 5.
ETA: Q1 '23.
US30 SHORT FROM RESISTANCE|
✅DOW JONES is going up now
But a strong resistance level is ahead at 45,077
Thus I am expecting a pullback
And a move down towards the target of 44,500
SHORT🔥
✅Like and subscribe to never miss a new idea!✅
Disclosure: I am part of Trade Nation's Influencer program and receive a monthly fee for using their TradingView charts in my analysis.

VIX-DJI // In case of an upward movement in the VIX fear index from the 14-16 band, DJI can be pressured at the 45003 level. In case of a sale, 8 ema is our take profit point.

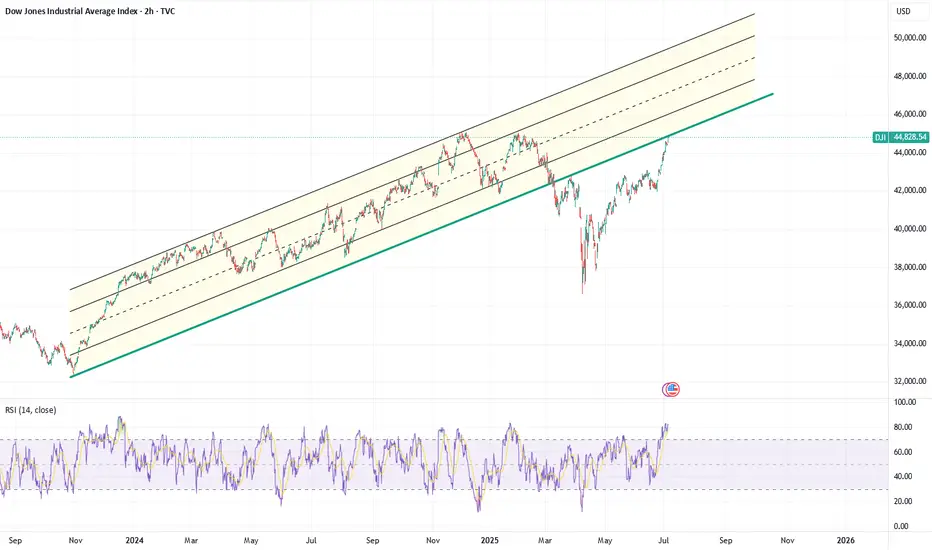
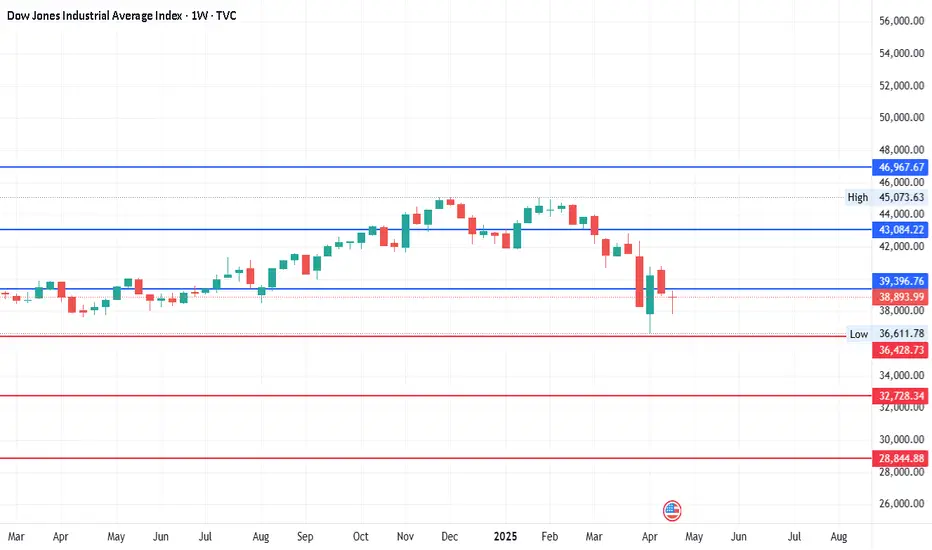
Dow Jones in Long-Term Fibonacci Channel📈 Dow Jones Weekly | Fibonacci Channel in Play Since 2020
The Dow Jones Industrial Average has been trending within a well-defined Fibonacci channel on the weekly timeframe since the 2020 lows.
🔹 The price has consistently respected the Fibonacci levels as tilted support and resistance lines—a technical behavior that adds weight to this structure.
🔹 Three major horizontal support/resistance zones are clearly active and validated multiple times (highlighted on the chart).
🔹 Currently, the index is approaching the upper boundary of the downtrend resistance.
📌 The setup suggests it's only a matter of time before we retest this dynamic resistance zone, with potential rejection or breakout to follow.
🎯 Target zone around 45,000 as marked—aligning with previous highs and the upper resistance confluence.
Stay tuned—momentum is building.
#DowJones #DJI #FibonacciChannel #TechnicalAnalysis #WeeklyChart #StockMarket #Resistance #Support #Trendlines #ChartAnalysis #TradingView #US30 #MarketOutlook #PriceAction

US30 Potential UpsidesHey Traders, in today's trading session we are monitoring US30 for a buying opportunity around 44,230 zone, Dow Jones is trading in an uptrend and currently is in a correction phase in which it is approaching the trend at 44,230 support and resistance area.
Trade safe, Joe.
Dow Jones - Volatility is HighLevels mentioned here are based on the market volatility and it is purely for the study purpose only.
US30 (DOW JONES) 4H – Bullish Breakout BUY Setup
US30 (Dow Jones Industrial Average) is pushing higher, breaking through previous resistance levels. Price is now trading at 44,586.48, confirming strong bullish momentum after reclaiming the 44,000 psychological zone.
We remain bullish — looking for continuation of this breakout.
---
BUY Trade Setup:
🔵 Buy Limit: 44,500.00 – 44,520.00
🛑 Stop Loss: 44,400.00
🎯 Take Profit 1: 44,750.00
🎯 Take Profit 2: 45,000.00
---
Why Buy?
✅ Clear bullish market structure.
✅ Price consolidating after breakout — healthy sign for continuation.
✅ Smart Money likely accumulating for next leg up.
We ride with momentum — no reason to fight the trend.
---
Summary:
Bias: BUY ONLY 🔥
Setup: Wait for price to retest 44,500 – 44,520 zone, look for rejection, then enter.
Risk Management: Respect SL — trade with discipline.
---
💬 Are you buying US30 too? Let me know your setup below!
#US30 #DowJones #Indices #TradingView #BuySetup #SmartMoney #FrankFx14
