Trend Exhaustion Detected – Bearish Structure AheadUS100 (NASDAQ) 30-minute chart as of July 26, 2025, with technical insights based on the visible elements.
🔍 1. Trend Analysis
Primary Trend: Uptrend (bullish structure)
The price has been respecting a rising parallel channel, marked by:
Ascending support (lower boundary)
Ascending resistance (upper boundary)
Market structure shows:
Higher Highs (HH)
Higher Lows (HL)
✅ This indicates continuation of bullish momentum until structure breaks.
📐 2. Market Structure Elements
Structure Type Label on Chart Price Zone (approx.)
Break of Structure (BOS) BOS (center-left) ~22,950
Higher Low (HL) HL (2x) ~22,700 (1st), ~23,050 (2nd)
Higher High (HH) HH (2x) ~23,150 and ~23,300
Resistance Labelled ~23,300–23,320
Demand Zones Labelled ~22,450–22,700
🔁 Break of Structure (BOS)
The BOS occurred after a prior swing low was broken, followed by a new higher high, confirming a bullish shift.
🧱 3. Support / Resistance Analysis
🔼 Resistance Zone
The price is testing strong resistance around 23,300–23,320
Multiple rejections in this area
Trendline resistance also aligns here
A rejection arrow is drawn, indicating potential bearish reaction
🔽 Support Zone (Immediate)
23,180–23,220: highlighted green box is a local support block
If broken, likely to revisit 23,000–23,050, or even down to 22,900 range
🟩 4. Demand Zones
Zone 1:
22,450–22,600: Strong bullish reaction historically — likely to act as a key demand if a deeper pullback occurs
Zone 2:
22,850–22,950: Validated with prior accumulation & BOS event
🧠 5. Key Observations
Price is at a critical inflection zone:
Testing a resistance zone
At the upper trendline of an ascending channel
A bearish reaction is projected (black arrow)
Possibly targeting the green support zone around 23,180–23,220
If that fails, demand at ~23,000 will likely be tested
Ichimoku Cloud:
Currently price is above the cloud → still bullish
Cloud is thin → potential weakness or upcoming consolidation
⚠️ 6. Trading Bias & Setup Ideas
✅ Bullish Bias (if price holds above ~23,180)
Long entries can be considered on bullish reaction from support
Target: retest of 23,300–23,350 or even breakout continuation
❌ Bearish Bias (if breakdown below support)
Short entry valid below 23,180 with:
TP1: 23,050
TP2: 22,900
A breakdown from the ascending channel would signal trend exhaustion
🔚 Conclusion
Current Price: 23,298.4
Trend: Bullish, but at resistance
Next move: Watch for reaction at resistance and support box below
Bias: Neutral-to-bullish unless the structure breaks below ~23,180
USTEC trade ideas

NASDAQ (CASH100) SHORT - double top H6Risk/reward = 4.3
Entry price = 23 282
Stop loss price = 23 398
Take profit level 1 (50%) = 22 871
Take profit level 2 (50%) = 22 663
If current H6 goes back into range, I will open short position.
All variables on checklist have been met.
I was out last night so I missed my initial entry. Hoping for a second chance.
Hopefully this short works because the last few higher time frame short setups have failed, although because of exit plan I have made very little losses.
NasdaqCOT data shows large speculators increasing net long positions on the Nasdaq-100, reflecting rising institutional confidence in tech and growth sectors. This positioning supports a bullish bias, especially as price holds above key moving averages and market breadth improves.

NAS 100 Potential PullbackHi there,
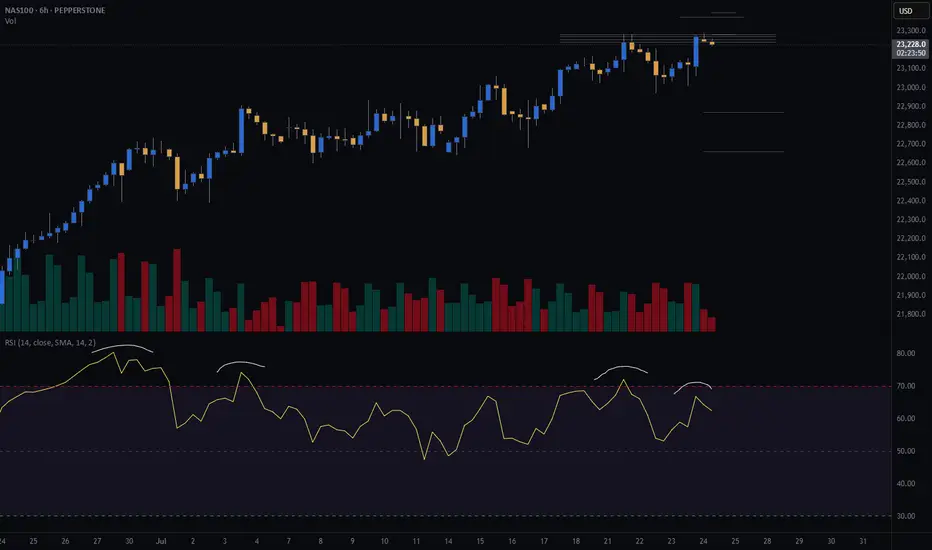
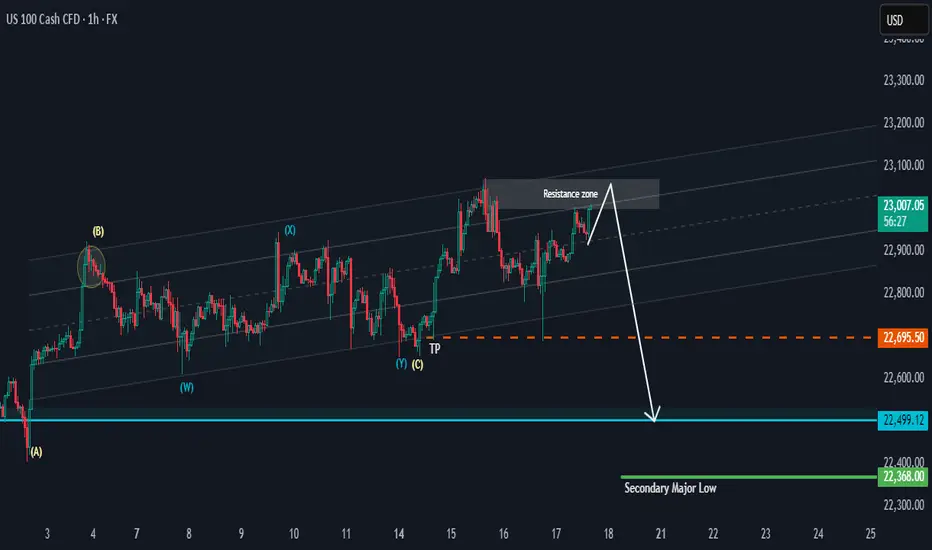
NAS100 has the potential to drop as it keeps testing the resistance zone in the range of 23100. This looks more like bull exhaustion than a reversal. The 22695.50 is the target for a bias of 22499.12
The overall bigger trend is bullish, with price highs aiming as far as 23717.44, 24837.28, and 26222.31, making this a potentially massive bullish trend, and it will take time to reach those highs.
Happy Trading, 🌟
K.
CALL THE MARKETS - XAUUSD ANALYSISWE HAVE
ona
kyle
Hasan
Ashlee
Mav
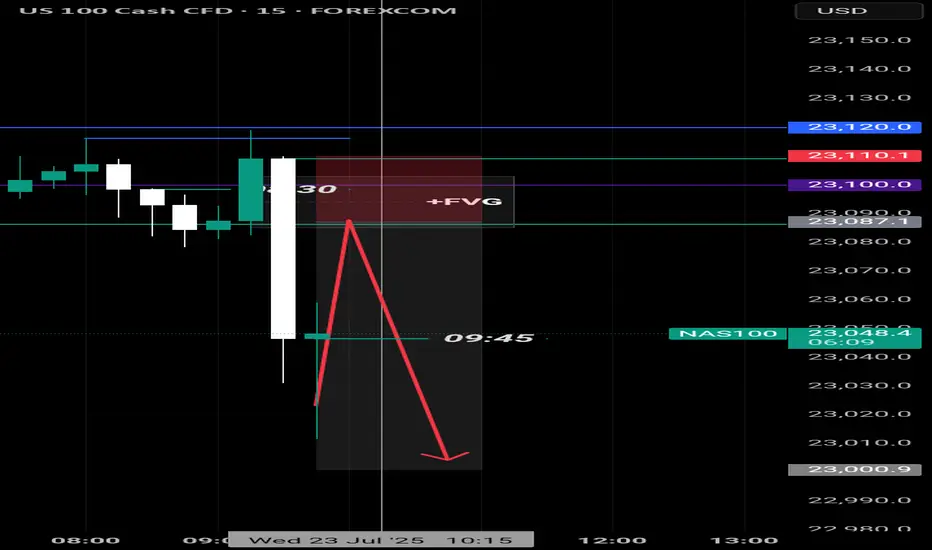
We are looking for the new red candle to drop down to 23100 area. from the 23100 to see continuation or a reversal towards ATH for a rejection to continue down to our lower Blue square area.
obviously we will wait for more news but thats what we are looking a for now.

NAS100 | FLUSHPOINTNas1oo is pulling back into HTF keyzones, down below looking to catch sellers to the upside so trade is a bit riskier but we are looking for upside moves overally

NAS100 Bullish Setup: Clean Structure & Entry Zone Pending📊 NASDAQ 100 (NAS100) remains bullish, showing a clean, well-structured uptrend—higher highs and higher lows 🔼📈.
Price has now pulled back into my optimal entry zone 🎯. At this stage, I’m waiting for a bullish break in market structure before considering an entry 🟢🔓.
Patience is key—let the structure confirm first.
Not financial advice ❌💼

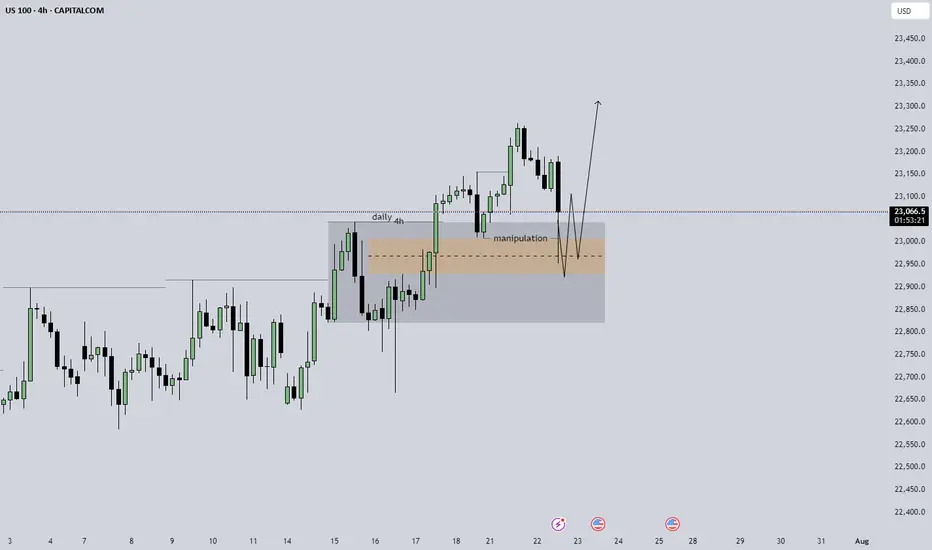
US100 expecting smth like this daily is strongly bullish, 4h is showing some sort of manipulation in the short, i am expecting something like the arrow that i pointed to happen on the m5 structure to try and take an entry, without that kind of circumstance stay out of the trade.
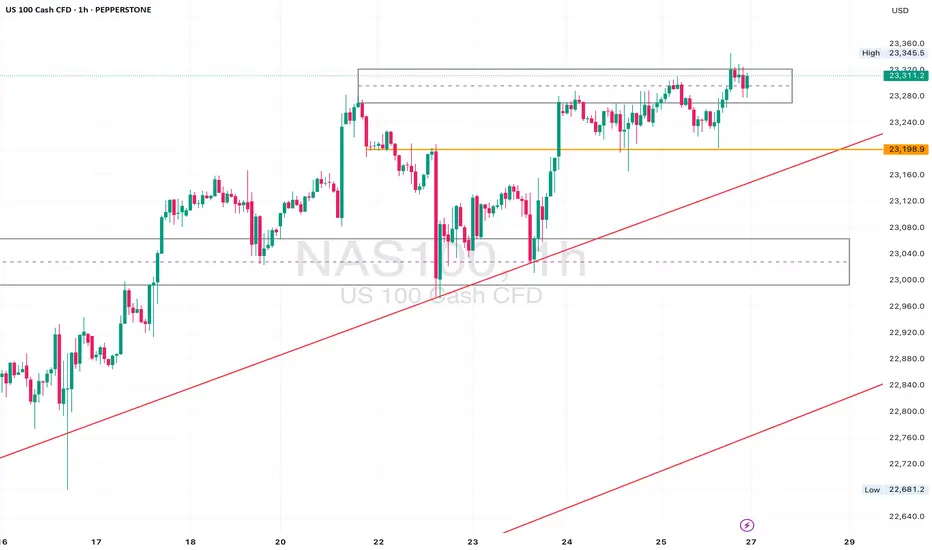
NAS100 Retesting Breakout – Eyes on 23170 for Bullish PushDaily Analysis:
Price is testing the upper boundary of the long-term ascending channel. Structure is still bullish with no major breaks of support. If momentum holds, we could extend toward the channel top.
4H Analysis:
Retesting breakout structure. Support is forming around 23000–23050. Bullish momentum remains valid unless price closes below this zone.
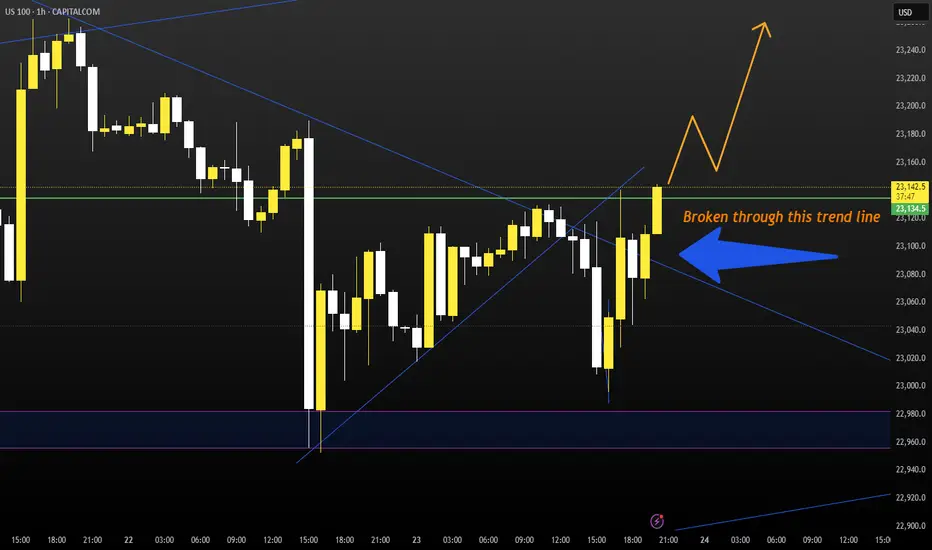
1H Analysis:
Micro-breakout confirmed with bullish impulse above 23120. If 23170 holds, continuation toward 23280–23320 is likely.
Confirmation & Entry:
Watch for continuation above 23170. SL below 23080. TP: 23280+
Use caution if 23000 breaks — this would weaken short-term bias.
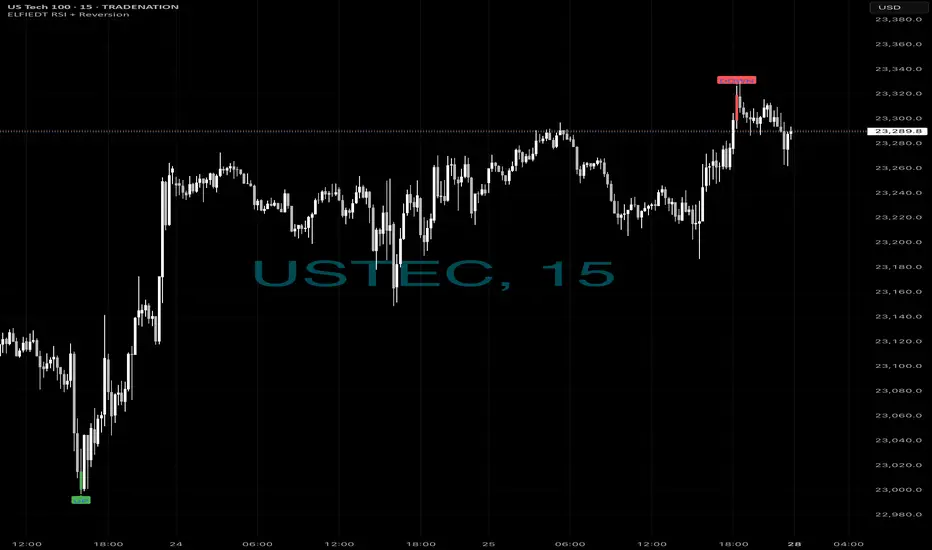
Longs then short - $$$🚀 Caught the Bottom. 🔻 Sold the Top.
Same chart. Same system. Same day.
While most traders were guessing,
ELFIEDT RSI + Reversion was sniping both ends on the US Tech 100.
📍 Long Signal:
At the dead low — green UP arrow fired.
The reversal followed instantly. Momentum exploded.
📍 Short Signal:
At the top of the rally — red DOWN printed.
Perfect spot. Price reversed hard within 1 candle.
⸻
🎯 How It Works:
✔️ Combines RSI overshoots + volatility reversion
✔️ Filters false signals using structure + time of day
✔️ Works on any index or FX pair
✔️ Real-time signals. No lag. No repainting.
⸻
💡 These weren’t “lucky trades.”
They were high-probability SETUPS.
Backed by logic. Confirmed by RSI extremes.
And now? Proven on the chart.
⸻
👉 Want to catch the next reversal like this?
💬 DM me “USTEC” or drop a 🚀
🔒 Access is limited to serious traders only.
📲 Follow for daily setups & training.
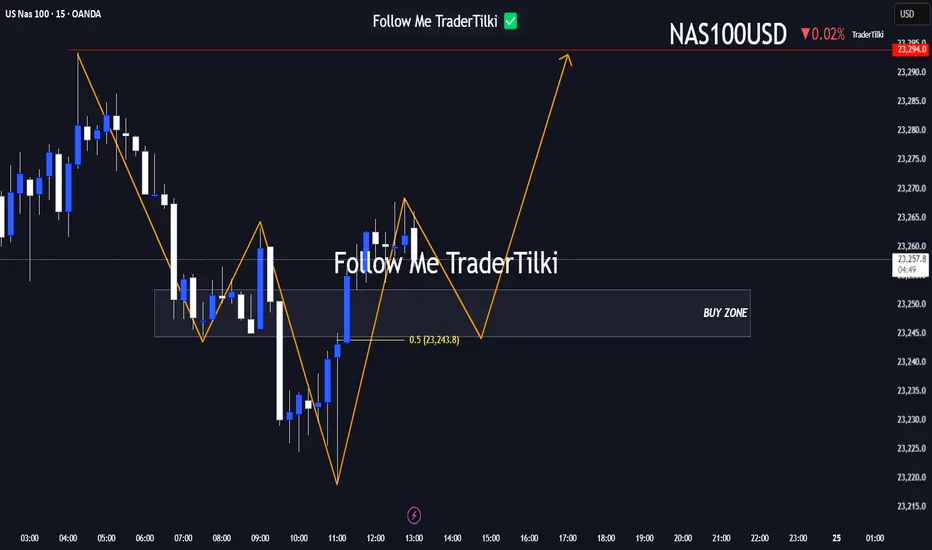
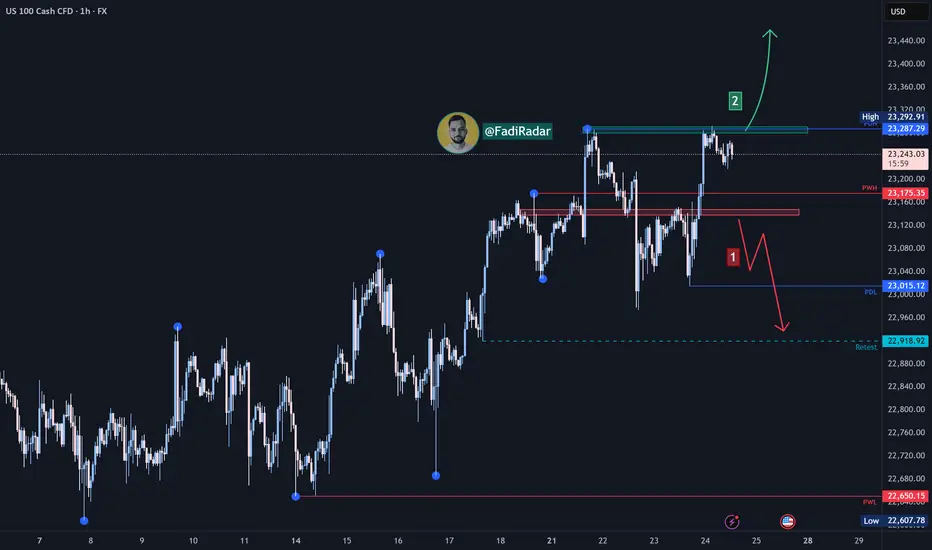
Here’s a fresh Nasdaq100 analysis I’ve put together for you.Hey Guys,
Here’s a fresh Nasdaq100 analysis I’ve put together for you.
I’ve marked the buy zone between 23,252 and 23,240. If price dips into that range, I’m anticipating a potential move upward toward 23,294.
Your likes and support are my biggest source of motivation to keep sharing these insights.
Huge thanks to everyone backing me with a thumbs-up!
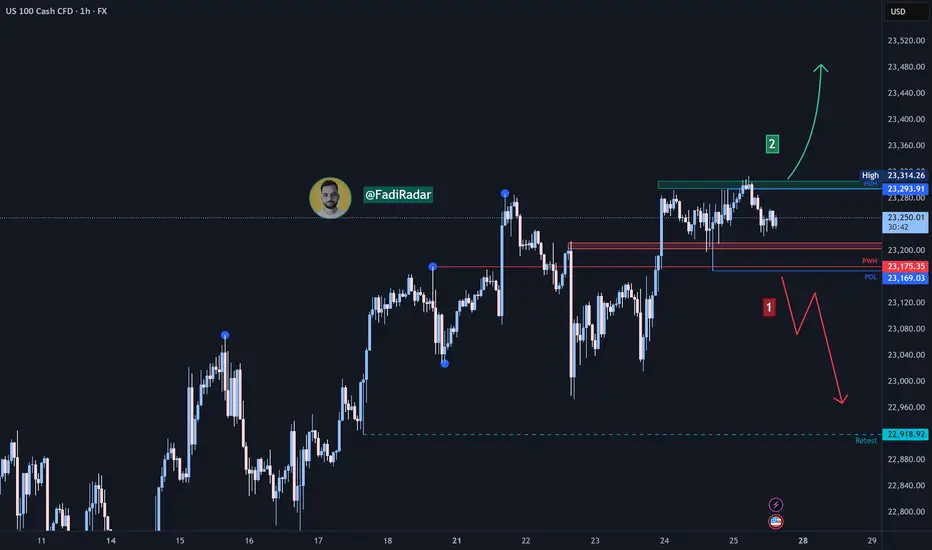
NASDAQ (CASH100) SHORT - Head and shoulders H1Risk/reward = 3.8
Entry price = 23 167.9
Stop loss price = 23 232.8
Take profit level 1 (50%) = 22 943
Take profit level 2 (50%) = 22 878
Still waiting on confirmation on some variables in checklist

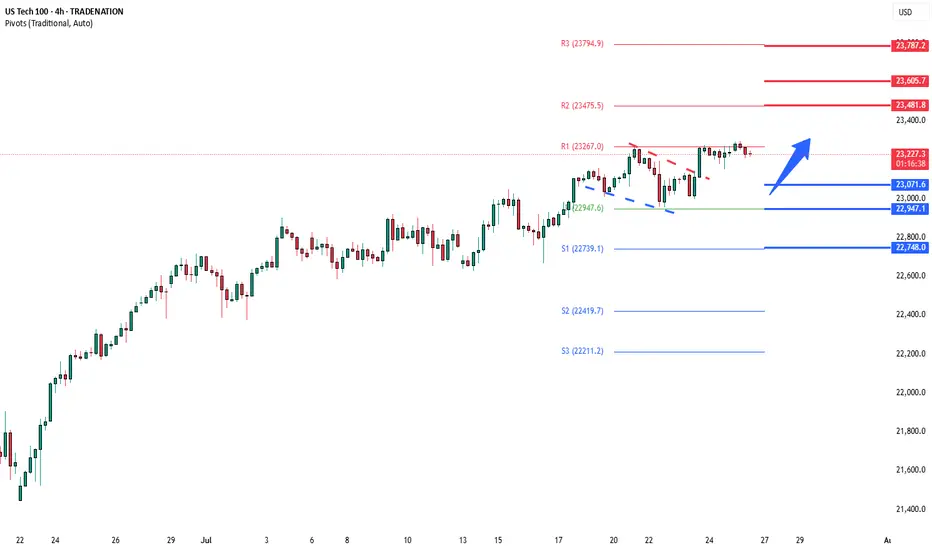
NSDQ100 pushing to new ATH?Thursday was a slightly positive session for equities, with the NASDAQ 100 rising +0.18% to close at a fresh record high, driven by strong economic data. However, overall market action was subdued, with the S&P 500’s trading range the narrowest since February (0.35%).
Notably, the equal-weighted S&P 500 fell -0.33%, highlighting underlying weakness outside mega-cap tech.
A key drag on the NASDAQ came from Tesla (-8.20%), which slumped after disappointing earnings. This weighed on the Magnificent 7, which declined -0.21% despite gains in the other six members.
On the macro front, the US dollar strengthened as Donald Trump downplayed his dispute with Fed Chair Jerome Powell, though continued to pressure the Fed on interest rates. Meanwhile, the FCC approved Paramount’s merger with Skydance, signaling a green light for M&A activity in media despite political tensions.
Conclusion – NASDAQ 100 Trading View:
The NASDAQ 100 remains technically bullish, setting new highs amid resilient economic data. However, breadth is weakening, and headline risk—especially around earnings (e.g., Tesla)—could trigger short-term volatility. Traders should stay long with caution, watching for sector rotation or profit-taking near highs, and monitor Fed-related rhetoric for macro-driven moves.
Key Support and Resistance Levels
Resistance Level 1: 23480
Resistance Level 2: 23600
Resistance Level 3: 23790
Support Level 1: 23070
Support Level 2: 22950
Support Level 3: 22750
This communication is for informational purposes only and should not be viewed as any form of recommendation as to a particular course of action or as investment advice. It is not intended as an offer or solicitation for the purchase or sale of any financial instrument or as an official confirmation of any transaction. Opinions, estimates and assumptions expressed herein are made as of the date of this communication and are subject to change without notice. This communication has been prepared based upon information, including market prices, data and other information, believed to be reliable; however, Trade Nation does not warrant its completeness or accuracy. All market prices and market data contained in or attached to this communication are indicative and subject to change without notice.
Nasdaq Index (US100 / NASDAQ):The Nasdaq index continues to move in a medium- to long-term uptrend, recently testing the 23,000 support zone and bouncing upward.
🔹 Bearish Scenario:
If the price breaks and closes below 23,000, it may lead to a decline toward 22,920, followed by a deeper move toward 22,650.
🔹 Bullish Scenario:
If the price holds above 23,200, further upside toward a new high around 23,400 is likely.
⚠️ Disclaimer:
This analysis is for educational purposes only and does not constitute financial advice. Always monitor the markets and perform your own due diligence before making any investment decisions.

US100 longLet market structure speak for itself! ;)
Looks like a clear long position... follow the trend!!!! <3
Nasdaq Index (US100 / NASDAQ) Technical Analysis:The Nasdaq index continues its medium- to long-term uptrend. Yesterday, it tested the 23,170$ level and rebounded upward, reaching 23,310$.
🔹 Bearish Scenario:
If the price breaks and closes below 23,200$, it may decline toward 23,000$, followed by 22,920$.
🔹 Bullish Scenario:
If the price holds above 23,300$, the uptrend is likely to continue toward a new high near 23,400$.
⚠️ Disclaimer:
This analysis is for educational purposes only and does not constitute financial advice. Always monitor the markets and perform your own analysis before making any trading decisions.
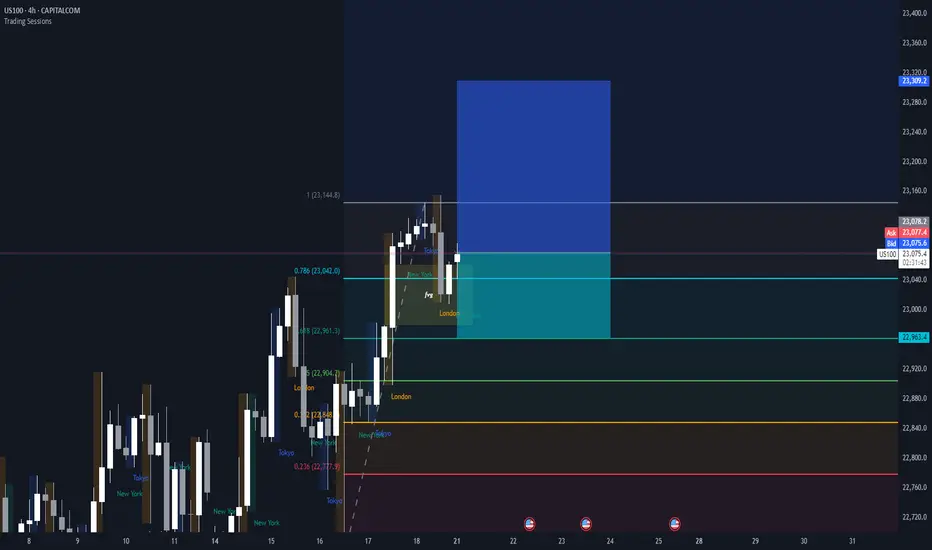
Nas Long to clear HH liquidity before correctionHTF Context – Monthly / Weekly / Daily
• Big Beautiful Bill (Trump Tax + Spending Bill)
o Passed July 4th, acting as a stimulus.
o Markets historically rally on fiscal stimulus expectations (tax cuts + spending packages).
o This fuels bullish sentiment short-term, but long-term raises debt, inflation risk, and rate hike concerns.
• Seasonality
o July is typically strong for equities, especially tech, with mid-July often marking local tops before August pullbacks.
• Monthly structure
o Strong bullish monthly candles.
o Next major fib retracements if rejected: 38.2% ~20,398, 50% ~19,625, 61.8% ~18,852.
• Weekly / Daily structure
o HH-HL sequence continues.
o Price in premium zone, approaching major supply block 23,200–23,300.
o Daily BOS not broken downwards yet.
________________________________________
Key Levels
• Major supply / liquidity magnet: 23,200–23,300 (sell-side OB in futures, uncollected liquidity above HH)
• Recent swing high: 22,900
• Daily pivot: 22,470
• Intraday demand zone: 22,450–22,350 (4H wedge base + VWAP)
• Weekly support shelf: 22,100–22,200 (if lost, major trend shift bearish)
________________________________________
My View – Most Likely Path
1. Price is likely to sweep the liquidity above recent highs into the 23,200–23,300 supply zone.
o Why? Market rarely leaves liquidity uncollected. This move traps breakout buyers and hits stops above HHs.
o Big Beautiful Bill fuels the final squeeze higher as algorithms price in fiscal stimulus.
2. After liquidity sweep above 23,200–23,300:
o Expect strong rejection from that zone.
o Institutions offload positions into trapped retail longs.
o Price pulls back towards daily and weekly support zones for reaccumulation.
3. Alternate scenario (less likely)
o Immediate sell-off from current levels without sweeping HH.
o Weak move; would still expect a revisit higher later to clear liquidity before a proper downtrend.
________________________________________
Trade Setups – Intraday & Swing
Intraday Long (Most Likely)
• Bias: Bullish continuation
• Entry Zone: 22,450–22,350 (4H demand + VWAP)
• Trigger: 5m/15m BOS up
• Stop: Below 22,300.
• Targets: First at 22,615, next at 22,845, final at 23,200–23,300.
________________________________________
Intraday Short (Countertrend / Liquidity Sweep Reversal)
• Bias: Short from supply after liquidity grab
• Entry Zone: 23,200–23,300
• Trigger: Sweep of HH with rejection wick or bearish engulfing candle
• Stop: Above 23,350 (structure invalidation).
• Targets: First at 22,845, then 22,600, extend to 22,450 if momentum accelerates.
________________________________________
Swing Long (Continuation)
• Bias: Bullish trend intact
• Entry: After retest of daily pivot (22,470) or 4H demand (22,350–22,450) with 4H CHoCH + BOS up.
• Stop: Below 22,200 (weekly support break invalidates).
• Targets: 22,845 then 23,200–23,300. Blue sky if above.
________________________________________
Swing Short (Only if structure breaks)
• Trigger: Daily close below 22,200
• Bias: Bearish trend shift
• Targets: 21,800 first, then 21,000 major fib cluster and weekly MA.
________________________________________
Summary – My Final Opinion
Price is in a strong uptrend fuelled by fiscal stimulus, rate cuts and tarrif hopes . I think it will sweep the liquidity above 23,200–23,300 before any deeper pullback or trend reversal. Any rejection from that supply zone will be the cue to short for a structural retracement. Until then, I’ll keep buying dips aligned with the HTF bullish structure.
Nasdaq Index Analysis (US100 / NASDAQ):The Nasdaq index continues its upward trend in the medium to long term. Yesterday, it tested the 23,000 USD level and bounced higher toward 23,290 USD.
1️⃣ If the price breaks below 23,100 USD and closes beneath it, we may see a decline toward 23,000 USD, followed by 22,920 USD.
2️⃣ However, if the price holds above 23,290 USD, further bullish momentum could lead to a new high around 23,400 USD.
⚠️ Disclaimer:
This analysis is not financial advice. Please monitor the markets and analyze the data carefully before making any investment decisions.
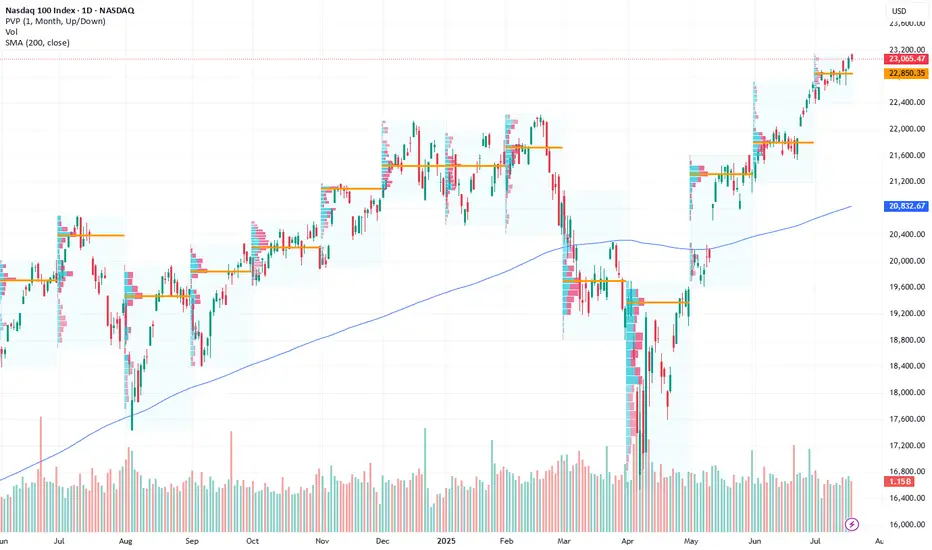
Go Long – Bullish Targets for Next Week- Current Price: $23065.47
- Key Insights: NASDAQ has exhibited resilience despite recent sentiment shifts,
showing signs of potential upside driven by a solid rebound in major tech
stocks. With earnings season approaching, improved performance in underlying
components reinforces long-term confidence in the index.
- Price Targets:
- T1: $23427.43
- T2: $23696.12
- S1: $22834.82
- S2: $22604.17
- Recent Performance: Over the past week, NASDAQ has consolidated near its
current levels, with intraday volatility driven by sector rotations and
macro concerns. While sentiment has weakened, the index remains supported by
key levels near the $23,000 mark.
- Expert Analysis: Analysts express optimism around key components such as
Apple, Microsoft, and Nvidia, which have recently seen improved outlooks.
Broader tech sector strength may drive NASDAQ higher. Caution is advised
given geopolitical uncertainties but upside opportunities dominate momentum.
- Sentiment Analysis:
- Current sentiment: 0
- Last week: 62.5
- Change: -62.5
- Total mentions: 386
- News Impact: Positive developments in semiconductor growth forecasts and
easing fears over rate hikes have supported bullish sentiment. However, last
week’s lower-than-expected inflation data and Federal Reserve signals for
"higher rates for longer" dampened sentiment overall.
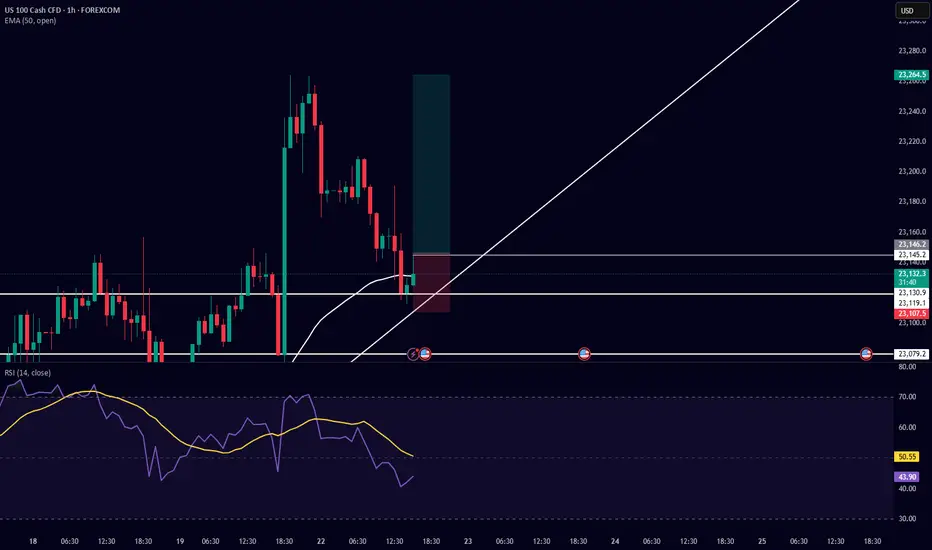
Trade Setup Description (Buy Side) – US100 (Nasdaq 100) 5-MinuteI am taking a buy-side trade on US100 based on the following confluences:
Support & Trendline Respect:
Price respected a horizontal support level near 23,079.2 and is currently bouncing from a rising trendline, showing potential for a bullish move.
Bullish Candlestick Reaction:
After testing the trendline, bullish candles formed, indicating buying interest at this zone.
EMA 50 Reclaim Potential:
Price is attempting to reclaim the 50 EMA (currently at 23,141.3). A successful break and hold above it would confirm bullish momentum.
RSI Confirmation:
RSI is currently around 47 and curving upwards, indicating a potential reversal from oversold/neutral territory. The RSI yellow moving average is also turning up.
Risk-Reward Ratio:
The setup has a favorable risk-to-reward ratio with the stop loss placed just below the trendline and recent wick low, and the target placed above the recent high around 23,264.5.
Properly navigating this ATH run in NASDAQ - No supply yetEverything is explained quickly in the video.
Main points:
1) Lows and bullish imbalances respected
2) It's very difficult to short without supply
3) May get cyclical take profit like previous years
Be sure to let me know what you think!
