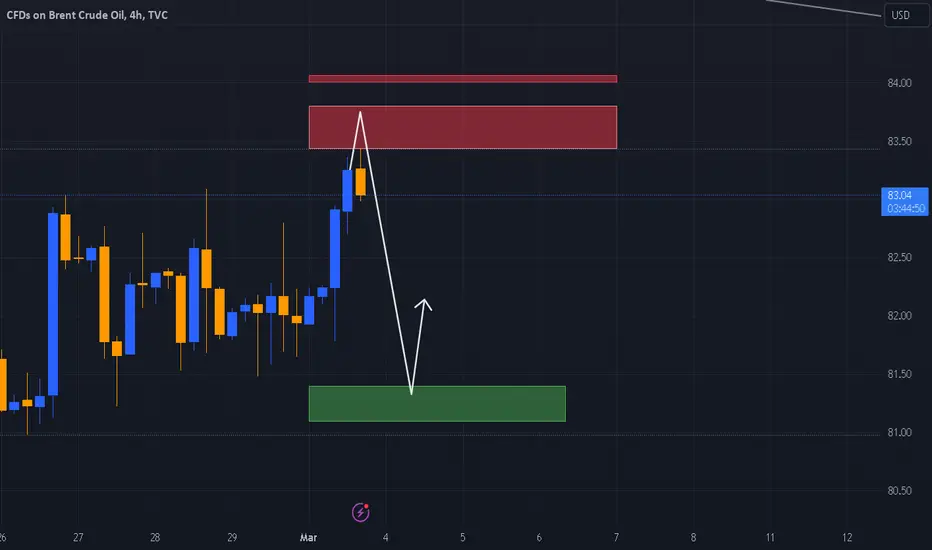
DeGRAM | UKOIL pullback tradeUKOIL reached resistance, and it pulled back from it.
The market is trading in the ascending channel, indicating the bears are running out of steam and the bulls are in control.
Price broke and closed above the resistance at 83.00.
We expect bullish move.
-------------------
Share your opinion in the comments and support the idea with like. Thanks for your support!
BRENT trade ideas

UKOIL 01.03.2024
UKOIL
Oil continues to fall amid concerns about demand and interest rates in America
The latest data confirms that US interest rates will not be reduced in March
This is negative for oil, with concerns about the demand for oil and also the cessation of the war
Between Israel and Hamas and entering into a truce at the beginning of March
Brent is on FIRE! New Bullish Momentum or Pullback?In this morning's Asian market hours, optimism about a possible interest rate cut by mid-year boosted the market sharply causing it to start unexpectedly strong, especially the oil market, including both West Texas and Brent crude oil in a tremendous price rally. Brent futures experienced a notable increase. At the start of the European session, an increase in expectations was also observed, resulting in a rise in European stocks. In a matter of hours, the price of a barrel of Brent rose from $81.64 to $82.91. The rise in Asian hours in Brent and West Texas futures contracts expiring in May was 0.4% and 0.3% respectively, being at the European opening of more than 1%.
German conflicts to receive supply with the active NordStream line may especially affect chemicals, gas derivatives and European oil prices added to the ukranian conflict. In addition, economic data from several Eurozone countries such as Italy, Spain, Portugal, Ireland, and later at the American opening, manufacturing PMIs from the United States and Canada, may have a significant impact on oil prices.
From a technical standpoint, it is unlikely that we will see the $135 per barrel seen in 2022 again in the near term. However, it is possible that the falling range has reached its low around the $71.47 seen in December, and could head towards $95.12 if the current uptrend continues. The RSI indicates an oversold level of 62.6%, which suggests that there is still room for the trend to continue, although the RSI average system marks us a value of 53.03% which is basically a strong irregularity in demand. If we look at the crosses of averages, they show us an opening that could lead to a strong move that is yet to develop.
Ion Jauregui - AT Analyst
The information provided does not constitute investment research. The material has not been prepared in accordance with the legal requirements designed to promote the independence of investment research and such should be considered a marketing communication.
All information has been prepared by ActivTrades ("AT"). The information does not contain a record of AT's prices, or an offer of or solicitation for a transaction in any financial instrument. No representation or warranty is given as to the accuracy or completeness of this information.
Any material provided does not have regard to the specific investment objective and financial situation of any person who may receive it. Past performance is not reliable indicator of future performance. AT provides an execution-only service. Consequently, any person acing on the information provided does so at their own risk.

BRENT - Interesting sell zone!Hello everyone!
The plan is still in effect; I've taken a second entry!
- Here's my view on BRENT:
- We have liquidity.
- We have an interesting zone.
- We have the optimal Fibonacci.
- We have accumulation before/on the zone.
- We are with the trend.
Fundamentally, we'll continue to monitor the evolution of conflicts in the Middle East because they can significantly impact the price of oil in case of escalating tensions! Given that we have the largest oil producers there, having conflicts nearby is concerning! So, stay cautious.
That's why I see BRENT drop in the zone and bumping!
🚀 If you liked it and want more, don't hesitate to subscribe and boost the post!

UKOIL BRENT DOWNUKOIL
Oil continues to fall amid concerns about demand and interest rates in America
The latest data confirms that US interest rates will not be reduced in March
This is negative for oil, with concerns about the demand for oil and also the cessation of the war
Between Israel and Hamas and entering into a truce at the beginning of March
We expect the downward trend for oil to continue
Selling will be in the 82.30 to 83.00 area
The targets are 80.80 and 79.80

UKOIL Brent 28.02.2024please make sure of them and do not risk, this is our analysis and ideas.
Please observe the capital carefully and do not risk more than 1% of your capital
Good luck to everyone

BRENT - Interesting sell zone!Hello everyone!
The plan is still in effect; I've taken a second entry!
- Here's my view on BRENT:
- We have liquidity.
- We have an interesting zone.
- We have the optimal Fibonacci.
- We have accumulation before/on the zone.
- We are with the trend.
Fundamentally, we'll continue to monitor the evolution of conflicts in the Middle East because they can significantly impact the price of oil in case of escalating tensions! Given that we have the largest oil producers there, having conflicts nearby is concerning! So, stay cautious.
That's why I see BRENT drop in the zone and bumping!
🚀 If you liked it and want more, don't hesitate to subscribe and boost the post!

UKOIL BRENT 27.02.2024please make sure of them and do not risk, this is our analysis and ideas.
Please observe the capital carefully and do not risk more than 1% of your capital
Good luck to everyone

BRENT - Interesting sell zone!Hello everyone!
The plan is still in effect; I've taken a second entry!
- Here's my view on BRENT:
- We have liquidity.
- We have an interesting zone.
- We have the optimal Fibonacci.
- We have accumulation before/on the zone.
- We are with the trend.
Fundamentally, we'll continue to monitor the evolution of conflicts in the Middle East because they can significantly impact the price of oil in case of escalating tensions! Given that we have the largest oil producers there, having conflicts nearby is concerning! So, stay cautious.
That's why I see BRENT drop in the zone and bumping!
🚀 If you liked it and want more, don't hesitate to subscribe and boost the post!

UKOIL LONGso I have been studying historical profiles and I have been observing quite interesting stuff there. refer the chart attached - inside it I have pasted same UKOIL profile from Q1 of 2018. almost similar profiles and movement there. there too fresh week's price opened out of value and pushed up, didn't pullback. this week same thing happened. so if this is to continue, I believe the price today will not pullback to my intended level and will keep on to the long side.
I have planned for this scenario. if price is to hold above 82.99, I will look for long entry. I will not risk anything on it as it is something that I am still testing out. I will however mark this up and journal it.

UKOIL LONG3 potential areas of interest on oil today where I will look for price to get absorbed. if it does - i will look to go long.
from weakest to strongest price levels -
1. 82.03
2. 81.76
3. 81.32 (strongest)

ukoil 8 hour short from resistance tp 72/74 usd🔸Hey guys, today let's review the 8 hour chart for UK oil . Any upside is
limited by strong overhead resistances, currently weak bounce in progress,
however most likely bears will take over from overhead.
🔸Strong resistances will cap upside at 84.00 usd / 86.00 usd. right now
locked in tight trading range, however expecting final pump to trigger overhead
stop losses before reversal and subsequent sell off event.
🔸Recommended strategy for BEARS: wait for the final pump before short selling
from strong overhead resistances at 84.00 and 86.00 SL fixes at 88.00 usd, TP1
bears is 76 usd TP2 bears is 72 usd. swing trade setup, patience required. good luck!
🎁Please hit the like button and
🎁Leave a comment to support our team!
RISK DISCLAIMER:
Trading Futures , Forex, CFDs and Stocks involves a risk of loss.
Please consider carefully if such trading is appropriate for you.
Past performance is not indicative of future results.
Always limit your leverage and use tight stop loss.

Crude Oil: Fabulous EntryAnother downtrend break, I don't think it will take more than 12 months to get to 120, it could be much less. Still better off buying spot or ATM Calls.
Oil is sitting just above monthly pivot, I think a stop at the monthly low, $77.80, is best, but a very conservative trader could probably get away with Long TP 120, SL at $80.50.

BRENT - Interesting sell zone!Hello everyone!
The plan is still in effect; I've taken a second entry!
- Here's my view on BRENT:
- We have liquidity.
- We have an interesting zone.
- We have the optimal Fibonacci.
- We have accumulation before/on the zone.
- We are with the trend.
Fundamentally, we'll continue to monitor the evolution of conflicts in the Middle East because they can significantly impact the price of oil in case of escalating tensions! Given that we have the largest oil producers there, having conflicts nearby is concerning! So, stay cautious.
That's why I see BRENT drop in the zone and bumping!
🚀 If you liked it and want more, don't hesitate to subscribe and boost the post!

UKOIL OUTLOOKUKOIL FEB WEEK 5 OUTLOOKG -
Daily - I am still long bias on oil. if it does pullback, I will not get involved in shorts this week. I will see how it plays out. significant zones to look for absorption are
80.10 - 79.43
78.63 - 77.48
Origin -looking weak here too. if price fails to hold above 80.87 - 80.77 here, next level of support comes down to 78.54 - 79.26. but if for some reason oil does pull up from here and is able to hold the zone 82.98 - 82.66 (low probability) then I will look to enter quick long entries.

Brent Crude OilTargets: 80.501
Liquidity: 82.096 or 82.403
Oil has broken the trend and is going to continue it's bearish momentum. Anything above the liquidity levels, if price breaks it to the up, will indicate bullish momentum. other than that it's bear and should continue tomorrow

DeGRAM | UKOIL short opportunity from kill zoneUKOIL has been making lower highs and equal lows, indicating bearish pressure.
Price is testing the resistance at 82.00, the fibo, and the channel's upper border, which is a dynamic resistance.
We anticipate a pullback. The market has dropped from this level before.
-------------------
Share your opinion in the comments and support the idea with a like. Thanks for your support!

Last jump before the spring?As you see on this chart:
If Brent Crude Oil is getting above the last days highs, I'll enter long and expecting a jump to the ~90th region.

UKOIL BRENT 20.02.2024 please make sure of them and do not risk, this is our analysis and ideas.
Please observe the capital carefully and do not risk more than 1% of your capital
Good luck to everyone

Oil May Buy to the 84 price, due to fundamental bullish newsAfter announcement of oil demand in the usa , oil began rising and breaking back inside the up trend line hence now i am looking for a buying opportunity at area of support once it pulls back
Please apply proper risk management and also live a comment on this idea, What do you think??

Sell OilTread line broken yesterday we are heading to the 81 zones i believe this week ,Please use proper risk management

Riding the Oil Rally: How to Play Brent Above $82 Support- Oil prices are currently trading around $82.55, up slightly on the day. This continues the stable to bullish price action seen over the past month.
- On the daily chart, Brent has held above key short-term support at $80 and is consolidating near multi-week highs above $82.
- Momentum indicators like MACD remain in positive territory, pointing to ongoing upward momentum in the near-term.
- The next upside targets are the 200-day moving average at $83.50 and the $84 resistance zone.
- Upside appears favored as long as $80 support holds on any intraday pullbacks.
In summary, the structure and positioning of key moving averages favors the bullish scenario playing out in the weeks ahead. I'd be looking to buy intraday dips toward $82 for additional gains up to $84. Let me know if any part of the analysis needs explanation.

(Sideway modification structure) like gasolineGreetings
Dear analysts and traders,
I hope you are doing well and are motivated for the week ahead. I wish you all the success in your business endeavors. Remember that success in trading lies in consistently defining and sticking to your rules.
As someone interested in the Elliott Wave Principle, I find it to be an invaluable tool for market analysis. I have developed my approach by combining this principle with my personal experience and by considering different scenarios that are likely to occur in the market. It should be noted that I do not like to be surprised in the market, and that's why I have different market prospects. I follow them to be sure and recognize the structure that is forming so that I can 100% recognize it.
I will share my analysis with you, but please note that I am not providing any buy or sell signals. My perspective on idea analysis is completely unbiased, so if the idea analysis meets your standards, you can use it as a guide to make an informed decision.
I have attached my previous analysis of the same market so that you can compare and see the differences. All the details of my analysis are clearly labeled, making it easy for you to understand. However, having a basic familiarity with the Elliott Wave Principle theory will help you understand the analytical idea more easily.
I have been studying the Elliott Wave Principle for almost three years now, and over time, my understanding of this knowledge and experience has grown. What I have achieved so far is the legacy of a genius called Ralph Nelson Eliot, and I am really happy with my progress. May peace be upon him.
Thank you for your support so far. I will always remember your kindness. Please share your comments and criticisms with me.
I hope my analysis will be useful to you in your business journey, and I wish you all the best.
Sincerely,
Mr. Nobody
