OPEC Forecasts an Increase in Oil Demand in 2024OPEC Forecasts an Increase in Oil Demand in 2024
Yesterday, the monthly oil market review was published:
→ OPEC expects global oil demand to increase by 2.25 million barrels per day (b/d) in 2024, representing a 2.2% increase compared to 2023.
→ In 2025, OPEC predicts a demand increase of 1.85 million barrels per day, reaching 106.21 million barrels per day. It is anticipated that the growth in oil consumption in 2025 will be driven by China, the Middle East, and India.
This aligns with Occidental Petroleum's perspective, where they anticipate a global oil shortage starting in 2025, as the pace of global oil demand growth is roughly four times higher than the volumes of new reserves.
However, according to Citi analysts, the price of Brent crude oil in 2025 is expected to be $60 per barrel due to oversupply.
As of today, the price of Brent crude oil is fluctuating in the consolidation zone around $77 per barrel. Market participants are closely monitoring the potential for an increase in the Brent oil price due to geopolitical tensions. For instance, Maersk has reported that escalation in the Red Sea and the Gulf of Aden will lead to disruptions in global logistics.
The Brent crude oil price chart indicates that
→ the new consolidation zone is lower than the previous one when the Brent price hovered around $81.
→ the price is near the crucial level of $73, which provided market support in 2023. At that time, OPEC+ countries announced a production cut to prevent further price decline. It is possible that they will take similar measures in 2024.
→ the rapid recovery of the price from December lows indicates the strength of demand for Brent oil below $74.
Given the provided information, if the Brent price falls below $74, it may lead to its subsequent increase.
This article represents the opinion of the Companies operating under the FXOpen brand only. It is not to be construed as an offer, solicitation, or recommendation with respect to products and services provided by the Companies operating under the FXOpen brand, nor is it to be considered financial advice.
BRENT trade ideas

Brent oil buy opportunities Brent oil now are in a 15 supply zone I expect to go down and after that there will be a buy situation.

⚡️Strifor || BRENT-18/01/2024Preferred direction: SELL
Comment: Sell-deal by oil is also relevant. Recent events in the OPEC arena did not have a positive impact on oil, and the decline continued. At the moment, the transaction has been moved to breakeven, and part of the profit has been fixed. However, on Thursday, there is a good opportunity to take a closer look at short-term short. The main trigger for this will be the continued formation of balance.
The target for the fall of such a short-term deal coincides with the medium-term deal at the level of 72.36 . It should be noted that the instrument continues to trade near the minimum of last year, which is very dangerous for buyers since today, most likely, the long-term trend will be directed exactly below this threshold of last year.
Thank you for like and share your views!

Brent (ICE) may rise to 78.60 - 79.15Pivot
77.50
Our preference
Long positions above 77.50 with targets at 78.60 & 79.15 in extension.
Alternative scenario
Below 77.50 look for further downside with 77.05 & 76.50 as targets.
Comment
The RSI calls for a bounce.
Supports and resistances
79.75
79.15
78.60
78.23 Last
77.50
77.05
76.50
Number of asterisks represents the strength of support and resistance levels.

⚡️Strifor || BRENT-11/01/2024Preferred direction: Neutral
Comment: There is no particularly interesting situation in the medium term for oil yet, but we can say that there are still more signs of sell. After all, the instrument is in a downward global trend. The current accumulation after a small downward impulse is filled with purchases (long-orders), that is, there is a resource for moving down.
As a target, we can consider the support level of 72.36, which is the minimum of the previous year. Regarding the longer term, most likely we will see updates to this low in 2023, and then an attempt to recover above this level.
Thank you for like and share your views!

BRENT CASH #ukoil 17.1.2024Please make sure of them and do not risk, this is our analysis and ideas.
Please observe the capital carefully and do not risk more than 1% of your capital.
Good luck to everyone

Brent - D1Brent
D1 - Update*
After breaking through the trend line, the price was unable to gain a foothold behind the line, which may lead to further downward movement when the lower line is broken.
For shopping, nothing changes dramatically.
Globally, the levels that the price can reach are 92.04
If a downward movement is realized, the levels can be considered at a price of 63.36
What can you expect?
Long - You can consider entering from the current levels of ~79.21 or wait for the price to fix behind the trend line and then consider entering.
Cancel if the price breaks the minimum - 75.34, if you are considering the entry from W1 and the formation of a 3-wave structure, the stop can be set at the minimum of the 1st wave at the level of 72.00
Short - When the level of 75.43 is broken, you can consider selling or wait for the price to fix behind the trend line and then consider entering.
Cancel if the price breaks the minimum - 79.33
Long
Target 81.41 - 82.78 - 85.51 - 87.98 - 92.04
Short
Target 72.36 - 70.61 - 66.79 - 63.36

USDBRO - Oil Is Not Looking GoodOil is not looking good on the chart, i'm still shorting it unless $83,83 is taken out. All major indicators are bearish for oil.

Oil brent 16/1/2024Please make sure of them and do not risk, this is our analysis and ideas.
Please observe the capital carefully and do not risk more than 1% of your capital.
Good luck to everyone

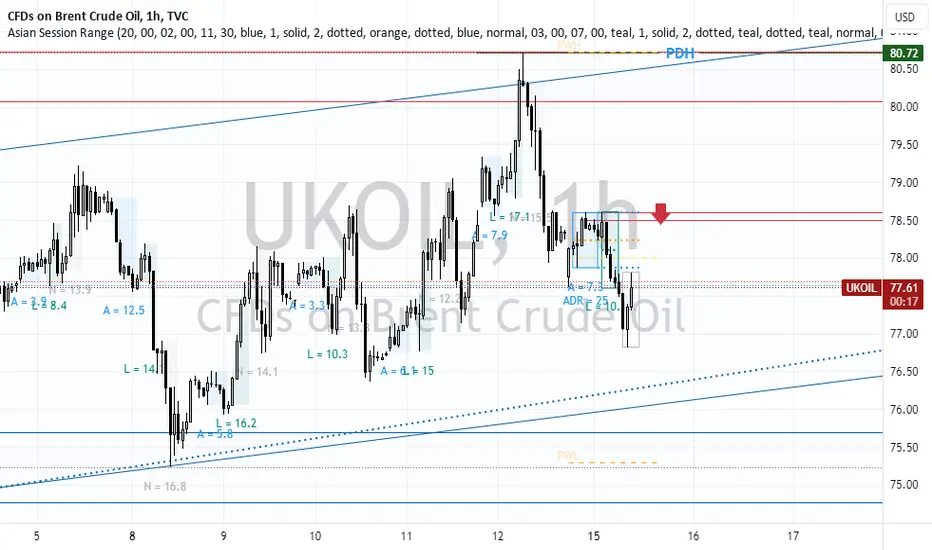
The Critical Zone for #UKOIL (#Brent_Oil_CFD)The depicted zones are critical for #UKOIL (#Brent_Oil_CFD) .The price can react to them and can be entered in short position. Up to your entry type and risk management set TP/SL. Do not forget that you cannot succeed in this market without proper risk management.01/15/2024
Brent (ICE) may rise to 78.80 - 79.35Pivot
77.85
Our preference
Long positions above 77.85 with targets at 78.80 & 79.35 in extension.
Alternative scenario
Below 77.85 look for further downside with 77.05 & 76.40 as targets.
Comment
Intraday technical indicators are mixed.
Supports and resistances
79.90
79.35
78.80
78.09 Last
77.85
77.05
76.40
Number of asterisks represents the strength of support and resistance levels.

Oil Outlook: Rising Tensions versus Saudi Price CutsConflicting Factors Cause Volatile Start to the Year
The global oil market faces a turbulent start to 2024, navigating a complex interplay of factors that have sent prices on a rollercoaster ride. Saudi Arabia's unexpected price cuts, causing a nearly 4% drop in Brent crude on January 8th, hinted at the world's largest oil exporter's commitment to maintaining market share.
Just days later, Houthi threats, coupled with US and UK military strikes in Yemen, briefly pushed oil prices above $80 a barrel on January 12th. The redirection of oil tankers from the Red Sea intensified uncertainty, challenging earlier assumptions about market stability.
Analysts are divided on the medium-term trajectory of oil prices. While some focus on softening global demand and robust US supply growth, attributing the decline since September, others underscore the geopolitical landscape's role in swiftly altering market dynamics. The recent surge, driven by Houthi threats, highlights the delicate balance between global forces and market sentiment.
Technical Backdrop: Wedge Starts to Form
In the midst of conflicting market forces, technical analysis emerges as a crucial tool to contextualise January's volatility.
The daily candle chart for Brent crude reveals a persistent downtrend, with prices remaining over 18% below their September highs. Anchored volume-weighted average prices (VWAPs) from the autumn swing highs act as dynamic resistance points as the trend continues downward.
However, having retested key support in December, we have seen prices start to carve out a small series of higher swing lows – ‘funnelling’ the market into a ‘wedge’ pattern.
We can use this consolidation pattern as a canary in the coal mine – a decisive break above the wedge could set the stage for change in trend while a break below could finally trigger long-held support to be breached.
Brent Crude Daily Candle Chart
Past performance is not a reliable indicator of future results
Disclaimer: This is for information and learning purposes only. The information provided does not constitute investment advice nor take into account the individual financial circumstances or objectives of any investor. Any information that may be provided relating to past performance is not a reliable indicator of future results or performance. Social media channels are not relevant for UK residents.
Spread bets and CFDs are complex instruments and come with a high risk of losing money rapidly due to leverage. 75% of retail investor accounts lose money when trading spread bets and CFDs with this provider. You should consider whether you understand how spread bets and CFDs work and whether you can afford to take the high risk of losing your money.

BRENT Head and Shoulders forming?This could be good deal if it come true and pattern is fully formed

Brent Cash 15/1/2024The entry, exit and stop loss points are on the chart, please make sure of them and do not risk, this is our analysis and ideas.
Please observe the capital carefully and do not risk more than 1% of your capital
Good luck to everyone

OIL - 4hDue to the inability to break the resistance of 81.5 points upwards, if the upward trend of the price breaks down and the price stabilizes below the range of 78.0 units, there is a possibility of the price falling to the range of 76.8 units and in case of strength, there is a range of 75.0 units.
Otherwise, the possibility of price increase up to the range of 81.5 units.

DeGRAM | UKOIL selling opportunityUKOIL has been making lower highs and lower lows.
Price broke and closed below the psychological level of 80.00.
We anticipate a trend continuation and a retest of the support level.
-------------------
Share your opinion in the comments, and support the idea with a like. Thanks for your support!

UKOil Bullish**Yearly Chart**
UKOil (Brent) last year's candle closed in a big range between 70 and 95 levels. While the intermediate trend suggests continuing the long-directional bias.
**Monthly Chart**
After retracing from an all-time high at around 125 level in 2022. The price retraced back to balance the move at 50% of the swing high and then remains in a range from March 2023. As far as the price does not break the swing low at around 70 (key level), I am expecting the bullish momentum to continue this year.
**Weekly Chart**
Last week candle closed as a doji candle which is an indication of indecision in the market. I would like to see the price retrace slightly lower, provides a reversal, and then move higher in the coming weeks.
**Daily Chart**
I would like to see the price tape into the demand zone and provide a confirmation to go higher.

Brent (ICE) may rise to 81.00 - 81.40Pivot
79.30
Our preference
Long positions above 79.30 with targets at 81.00 & 81.40 in extension.
Alternative scenario
Below 79.30 look for further downside with 78.60 & 78.00 as targets.
Comment
The break above 79.30 is a positive signal that has opened a path to 81.00.
Supports and resistances
82.10
81.40
81.00
80.19 Last
79.30
78.60
78.00
Number of asterisks represents the strength of support and resistance levels.

Brent above 200$ scenaerioLooking at multi year blue wedge brent could perform a massive bull move 1st target 213$
2nd tp (less likely) 260$

Brent Cash UP TO 81.46$The entry, exit and stop loss points are on the chart, please make sure of them and do not risk, this is our analysis and ideas.
Please observe the capital carefully and do not risk more than 1% of your capital
Good luck to everyone

Crude Oil Bullish Crude oil bullish Scenario
After breakout and retest will be great long opportunity.

Brent - W1\D1Brent
W1 - The price may form a potential 3-wave structure, which, if wave 1 is broken, will mean continued upward movement to the values of 95.90
D1 - You can observe the formation of a triangular structure with a breakout of the upper trend line. Globally, the levels that the price can reach are 92.04
What can you expect?
You can consider entering from the current levels of ~79.21 or wait for the price to fix behind the trend line and then consider entering.
Cancel if the price breaks the minimum - 75.34, if you are considering the entry from W1 and the formation of a 3-wave structure, the stop can be set at the minimum of the 1st wave at 72.00
Long
Target 81.41 - 82.78 - 85.51 - 87.98 - 92.04

Brent (ICE) may rise to 77.70 - 78.15Pivot
76.80
Our preference
Long positions above 76.80 with targets at 77.70 & 78.15 in extension.
Alternative scenario
Below 76.80 look for further downside with 76.45 & 75.95 as targets.
Comment
The RSI calls for a rebound.
Supports and resistances
78.70
78.15
77.70
77.35 Last
76.80
76.45
75.95
Number of asterisks represents the strength of support and resistance levels.
