RUSSELL 2000 The Week Ahead 24th March '25RUSSELL 2000 bearish & oversold, the key trading level is at 2100
This communication is for informational purposes only and should not be viewed as any form of recommendation as to a particular course of action or as investment advice. It is not intended as an offer or solicitation for the purchase or sale of any financial instrument or as an official confirmation of any transaction. Opinions, estimates and assumptions expressed herein are made as of the date of this communication and are subject to change without notice. This communication has been prepared based upon information, including market prices, data and other information, believed to be reliable; however, Trade Nation does not warrant its completeness or accuracy. All market prices and market data contained in or attached to this communication are indicative and subject to change without notice.
US2000 trade ideas

Russell 2000 INTRADAY Bearish oversold bounce back Key Support and Resistance Levels
Resistance Level 1: 2081
Resistance Level 2: 2100
Resistance Level 3: 2124
Support Level 1: 1982
Support Level 2: 1940
Support Level 3: 1896
This communication is for informational purposes only and should not be viewed as any form of recommendation as to a particular course of action or as investment advice. It is not intended as an offer or solicitation for the purchase or sale of any financial instrument or as an official confirmation of any transaction. Opinions, estimates and assumptions expressed herein are made as of the date of this communication and are subject to change without notice. This communication has been prepared based upon information, including market prices, data and other information, believed to be reliable; however, Trade Nation does not warrant its completeness or accuracy. All market prices and market data contained in or attached to this communication are indicative and subject to change without notice.

This RUT/NDX ratio may convince you to buy NASDAQ aggressively.Nasdaq (NDX) has been under heavy selling pressure in the past 30 days. This short-term pull-back however is nothing but a buy opportunity on the long-term, and this study shows you why.
The answer lies on the RUT/NDX ratio which shows that this may be the time to get heavier on tech. The use of the Russell 2000 index (RUT) is due to the fact it represents a wider array of companies. Naturally over the years (this 1M chart shows data since 2006), the ratio declines within a Channel Down as historically the riskier tech sector attracts more capital and grows more.
However there are instances where Russell gains more against Nasdaq. We are currently though at a time where this isn't the case as the ratio seems to be ready for decline following the completion of a consolidation that on previous fractals (March 2015, September 2008) was bearish, thus positive for Nasdaq.
As you can see, this movements can be grasped by the Sine Waves, though not perfectly, but still good enough to understand the cyclical pattern we're in, also with the help of the 1M RSI Triangles.
Nasdaq (which is represented by the blue trend-line) has started massive expansion Channel Up patterns following this unique signal given by the RUT/NDX ratio. The first was right after the 2009 Housing Crisis bottom and the second during the 2015/ 2016 E.U., VW and Oil crisis.
The key here is on the 1M RSI. The Triangle is about to beak to the upside and every time this happened in the last 20 years, it coincided with a pull-back on Nasdaq (blue circle) similar to the current one. What followed was massive rallies each time.
As a result, this could be an indication that even though the tariffs have rattles investor confidence lately, this is an opportunity for a strong buy position for at least the rest of the year.
-------------------------------------------------------------------------------
** Please LIKE 👍, FOLLOW ✅, SHARE 🙌 and COMMENT ✍ if you enjoy this idea! Also share your ideas and charts in the comments section below! This is best way to keep it relevant, support us, keep the content here free and allow the idea to reach as many people as possible. **
-------------------------------------------------------------------------------
💸💸💸💸💸💸
👇 👇 👇 👇 👇 👇

Russell2000 INTRADAY Oversold bounce back capped at 2081Key Support and Resistance Levels
Resistance Level 1: 2081
Resistance Level 2: 2100
Resistance Level 3: 2124
Support Level 1: 1982
Support Level 2: 1940
Support Level 3: 1896
This communication is for informational purposes only and should not be viewed as any form of recommendation as to a particular course of action or as investment advice. It is not intended as an offer or solicitation for the purchase or sale of any financial instrument or as an official confirmation of any transaction. Opinions, estimates and assumptions expressed herein are made as of the date of this communication and are subject to change without notice. This communication has been prepared based upon information, including market prices, data and other information, believed to be reliable; however, Trade Nation does not warrant its completeness or accuracy. All market prices and market data contained in or attached to this communication are indicative and subject to change without notice.

Small Cap Reversal patternAs rates persist higher as FED lowers rates, small-cap companies with limited pricing power, and high debt, needing to roll over debt are in trouble.
The chart is showing a CRACK!

Consider a Neutral Stance on Russell 2000 for Next Week- Key Insights: The Russell 2000 has shown recent instability, matching declines
across major indices. While there has been a minor rebound, continued
vigilance is advised due to ongoing volatility in small-cap stocks.
Investors should be mindful of sector-specific signals, particularly in
technology and finance.
- Price Targets: For the upcoming week, adopt a neutral trading stance given
mixed market signals.
- Next week targets (T1, T2): T1 at $207, T2 at $212
- Stop levels (S1, S2): S1 at $197, S2 at $192
- Recent Performance: The Russell 2000 is down approximately 17-18% from its
recent peak, with a brief rally showing gains around 2-2.5% alongside major
indices like the S&P 500 and NASDAQ. This reflects the index's
susceptibility amidst broader market conditions.
- Expert Analysis: Experts highlight the underperformance of small caps versus
larger caps, pointing to their vulnerability during turbulent market phases.
Mixed signals within the technology sector, particularly dependent on small-
cap innovation, emphasize the need for close observation of these domains.
- News Impact: Recent strategic fund expansions including the Russell 2000 among
key indices underscore an interest in small-cap gains despite current
hurdles. Additionally, potential tariff changes could influence sectors
intrinsically linked to trade, affecting small-cap firms operating within
these areas. Maintaining a balanced perspective on these events is crucial
for informed investment decisions.

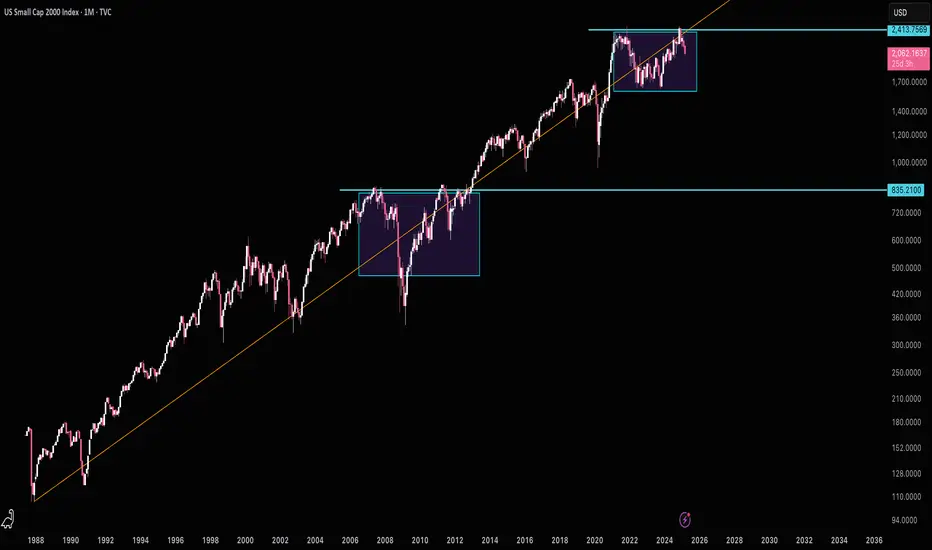
Russell 2000 Year-End Price Target and Technical Rebound OutlookIf you ahven`t bought the Double Bottom on RUT 2K:
Now the Russell 2000 Index (RUT), which tracks small-cap stocks, has recently entered oversold territory, signaling that a potential technical rebound could be on the horizon. Oversold conditions typically occur when selling pressure becomes excessive, driving the index below its fundamental value and creating an opportunity for a corrective bounce.
Several technical indicators, including the Relative Strength Index (RSI), have fallen below the 30 level — a classic oversold signal. Historically, similar setups have led to strong short-term recoveries as buying interest returns once the selling momentum exhausts itself.
Additionally, market breadth indicators suggest that the recent pullback has been broad-based, with a high percentage of RUT 2K components trading below their 50-day and 200-day moving averages. This type of widespread weakness often precedes a period of mean reversion, where prices bounce back toward key resistance levels.
Given these technical signals, my price target for RUT 2K is $2,450 by the end of the year. A rebound toward this level would represent a recovery of approximately 10-12% from current levels, aligning with previous post-oversold rallies in the index. If broader market sentiment stabilizes and small caps benefit from improving economic conditions or easing rate hike pressures, the path toward this target becomes increasingly plausible.
While downside risks remain — including ongoing macroeconomic uncertainty and geopolitical tensions — the technical setup suggests that RUT 2K is primed for a recovery in the coming months.

RUSSELL 2000 The Week Ahead 17th March '25RUSSELLL2000 INTRADAY bearish & oversold capped by resistance at 2170
This communication is for informational purposes only and should not be viewed as any form of recommendation as to a particular course of action or as investment advice. It is not intended as an offer or solicitation for the purchase or sale of any financial instrument or as an official confirmation of any transaction. Opinions, estimates and assumptions expressed herein are made as of the date of this communication and are subject to change without notice. This communication has been prepared based upon information, including market prices, data and other information, believed to be reliable; however, Trade Nation does not warrant its completeness or accuracy. All market prices and market data contained in or attached to this communication are indicative and subject to change without notice.

RUSSELL2000 INTRADAY Bearish continuation capped at 2056 Key Support and Resistance Levels
Resistance Level 1: 2097
Resistance Level 2: 2132
Resistance Level 3: 2167
Support Level 1: 2000
Support Level 2: 1981
Support Level 3: 1957
This communication is for informational purposes only and should not be viewed as any form of recommendation as to a particular course of action or as investment advice. It is not intended as an offer or solicitation for the purchase or sale of any financial instrument or as an official confirmation of any transaction. Opinions, estimates and assumptions expressed herein are made as of the date of this communication and are subject to change without notice. This communication has been prepared based upon information, including market prices, data and other information, believed to be reliable; however, Trade Nation does not warrant its completeness or accuracy. All market prices and market data contained in or attached to this communication are indicative and subject to change without notice.

Russell2000 INTRADAY Key Trading LevelsKey Support and Resistance Levels
Resistance Level 1: 2097
Resistance Level 2: 2132
Resistance Level 3: 2167
Support Level 1: 2000
Support Level 2: 1981
Support Level 3: 1957
This communication is for informational purposes only and should not be viewed as any form of recommendation as to a particular course of action or as investment advice. It is not intended as an offer or solicitation for the purchase or sale of any financial instrument or as an official confirmation of any transaction. Opinions, estimates and assumptions expressed herein are made as of the date of this communication and are subject to change without notice. This communication has been prepared based upon information, including market prices, data and other information, believed to be reliable; however, Trade Nation does not warrant its completeness or accuracy. All market prices and market data contained in or attached to this communication are indicative and subject to change without notice.

Russell 2000 D1 | Approaching a pullback resistanceRussell 2000 (US2000) is rising towards a pullback resistance and could potentially reverse off this level to drop lower.
Sell entry is at 2,083.69 which is a pullback resistance that aligns with the 23.6% Fibonacci retracement.
Stop loss is at 2,150.00 which is a level that sits above the 38.2% Fibonacci retracement and a descending trendline.
Take profit is at 1,982.94 which is a swing-low support.
High Risk Investment Warning
Trading Forex/CFDs on margin carries a high level of risk and may not be suitable for all investors. Leverage can work against you.
Stratos Markets Limited (www.fxcm.com):
CFDs are complex instruments and come with a high risk of losing money rapidly due to leverage. 63% of retail investor accounts lose money when trading CFDs with this provider. You should consider whether you understand how CFDs work and whether you can afford to take the high risk of losing your money.
Stratos Europe Ltd (www.fxcm.com):
CFDs are complex instruments and come with a high risk of losing money rapidly due to leverage. 63% of retail investor accounts lose money when trading CFDs with this provider. You should consider whether you understand how CFDs work and whether you can afford to take the high risk of losing your money.
Stratos Trading Pty. Limited (www.fxcm.com):
Trading FX/CFDs carries significant risks. FXCM AU (AFSL 309763), please read the Financial Services Guide, Product Disclosure Statement, Target Market Determination and Terms of Business at www.fxcm.com
Stratos Global LLC (www.fxcm.com):
Losses can exceed deposits.
Please be advised that the information presented on TradingView is provided to FXCM (‘Company’, ‘we’) by a third-party provider (‘TFA Global Pte Ltd’). Please be reminded that you are solely responsible for the trading decisions on your account. There is a very high degree of risk involved in trading. Any information and/or content is intended entirely for research, educational and informational purposes only and does not constitute investment or consultation advice or investment strategy. The information is not tailored to the investment needs of any specific person and therefore does not involve a consideration of any of the investment objectives, financial situation or needs of any viewer that may receive it. Kindly also note that past performance is not a reliable indicator of future results. Actual results may differ materially from those anticipated in forward-looking or past performance statements. We assume no liability as to the accuracy or completeness of any of the information and/or content provided herein and the Company cannot be held responsible for any omission, mistake nor for any loss or damage including without limitation to any loss of profit which may arise from reliance on any information supplied by TFA Global Pte Ltd.
The speaker(s) is neither an employee, agent nor representative of FXCM and is therefore acting independently. The opinions given are their own, constitute general market commentary, and do not constitute the opinion or advice of FXCM or any form of personal or investment advice. FXCM neither endorses nor guarantees offerings of third-party speakers, nor is FXCM responsible for the content, veracity or opinions of third-party speakers, presenters or participants.

Trump Rally Yet to BeginRUT has been rejected from its previous high but this is quite common (just look at the BTC chart). As a result, I expect a further pull back as end of year selling carries on. That said I do expect a powerful rally in anticipation of the new US president in early January.
Not investment advice, Please do your research.

Bitcoin Liquidity updateA quick update on Bitcoin, #MARA, and the #Russell2000 liquidity heading into the weekend. #BTC seems to be loosening quickly, with the possibility of some more downside today.
Irregular liquidity takes into account differences between lit markets, such as NYSE open hours in the Globex futures, versus the Asian and European markets ironing these out.
Time-Layered Liquidity addresses how long liquidity takes to wash through across different time periods.

Russel 2000 Compared to General MarketTVC:RUT has continued to sell off since my last couple posts and I believe we could see a huge market correction this year if price doesn't look to stop selling.
The next play on RUT I would like to see price pullback to the last breakout zone ($2,200) to confirm a continuation in trend
This play also looks very familiar to the 2022 selloff with equal highs to our current price structure. Seeing that AMEX:SPY is at a higher high tells me there is market-wide divergence and a topping pattern could be in play.
Now when we add CRYPTOCAP:BTC and $OTHER to the mix we can see bitcoin actually tops out first while Alts and SPX look to make one more leg up before crashing out.
The Trend Reader at the lower tab has topped out and has a bearish crossing in the overbought zone indicating we can see a long term play to the downside.

Russell2000 The Week Ahead 10th March '25Sentiment: Bearish INTRADAY, Price action is consolidating in a tight trading range.
Resistance: Key Resistance is at 2135, followed by 2175 and 2208.
Support: Key support is at 2020 followed by 2000 and 1900.
This communication is for informational purposes only and should not be viewed as any form of recommendation as to a particular course of action or as investment advice. It is not intended as an offer or solicitation for the purchase or sale of any financial instrument or as an official confirmation of any transaction. Opinions, estimates and assumptions expressed herein are made as of the date of this communication and are subject to change without notice. This communication has been prepared based upon information, including market prices, data and other information, believed to be reliable; however, Trade Nation does not warrant its completeness or accuracy. All market prices and market data contained in or attached to this communication are indicative and subject to change without notice.

The Russell 2000 is cornered🟢 The Russell 2000 is cornered
The American index Russell 2000 is at a crucial point for its future development.
The price is near the marked double top and is also using the 2024 upward trendline as support.
If the 2024 upward trendline is lost, the price could see drops of at least 7% in a few days.
If it breaks the double top , it means we have nothing to worry about, and the price will continue with the current upward trend, without the need for a sideways market that offers a pause for investors.
✅ What pattern is unfolding in TVC:RUT ?
It is showing a double top, which, if it breaks the $1600 area, would put the index in serious trouble. For now, we should focus on the blue trendline, as breaking and losing the $2,170 area would lead to corrections down to the next support, implying rapid drops of an additional 7%.
We should wait and buy at the trendline, and sell if it's broken. Always follow the money management strategy explained in all other ideas to create risk-free trades.
✴️ Do you want me to analyze any market? Just comment below which market you want!!
ENJOY AND FOLLOW for more 😊

Russell 2000 INTRADAY ahead of US Non Farm PayrollsSentiment: Neutral, Price action is consolidating in a tight trading range.
Resistance: Key Resistance is at 2100, followed by 2113 and 2123.
Support : Key support is at 2054 followed by 2035 and 2026.
This communication is for informational purposes only and should not be viewed as any form of recommendation as to a particular course of action or as investment advice. It is not intended as an offer or solicitation for the purchase or sale of any financial instrument or as an official confirmation of any transaction. Opinions, estimates and assumptions expressed herein are made as of the date of this communication and are subject to change without notice. This communication has been prepared based upon information, including market prices, data and other information, believed to be reliable; however, Trade Nation does not warrant its completeness or accuracy. All market prices and market data contained in or attached to this communication are indicative and subject to change without notice.

Russell 2000 H4 | Pullback resistance at 61.8% Fibo retracementRussell 2000 (US2000) is rising towards a pullback resistance and could potentially reverse off this level to drop lower.
Sell entry is at 2,133.07 which is a pullback resistance that aligns close to a 61.8% Fibonacci retracement.
Stop loss is at 2,202.00 which is a level that sits above the 50.0% Fibonacci retracement and a swing-high resistance.
Take profit is at 2,047.95 which is a swing-low support.
High Risk Investment Warning
Trading Forex/CFDs on margin carries a high level of risk and may not be suitable for all investors. Leverage can work against you.
Stratos Markets Limited (www.fxcm.com):
CFDs are complex instruments and come with a high risk of losing money rapidly due to leverage. 63% of retail investor accounts lose money when trading CFDs with this provider. You should consider whether you understand how CFDs work and whether you can afford to take the high risk of losing your money.
Stratos Europe Ltd (www.fxcm.com):
CFDs are complex instruments and come with a high risk of losing money rapidly due to leverage. 63% of retail investor accounts lose money when trading CFDs with this provider. You should consider whether you understand how CFDs work and whether you can afford to take the high risk of losing your money.
Stratos Trading Pty. Limited (www.fxcm.com):
Trading FX/CFDs carries significant risks. FXCM AU (AFSL 309763), please read the Financial Services Guide, Product Disclosure Statement, Target Market Determination and Terms of Business at www.fxcm.com
Stratos Global LLC (www.fxcm.com):
Losses can exceed deposits.
Please be advised that the information presented on TradingView is provided to FXCM (‘Company’, ‘we’) by a third-party provider (‘TFA Global Pte Ltd’). Please be reminded that you are solely responsible for the trading decisions on your account. There is a very high degree of risk involved in trading. Any information and/or content is intended entirely for research, educational and informational purposes only and does not constitute investment or consultation advice or investment strategy. The information is not tailored to the investment needs of any specific person and therefore does not involve a consideration of any of the investment objectives, financial situation or needs of any viewer that may receive it. Kindly also note that past performance is not a reliable indicator of future results. Actual results may differ materially from those anticipated in forward-looking or past performance statements. We assume no liability as to the accuracy or completeness of any of the information and/or content provided herein and the Company cannot be held responsible for any omission, mistake nor for any loss or damage including without limitation to any loss of profit which may arise from reliance on any information supplied by TFA Global Pte Ltd.
The speaker(s) is neither an employee, agent nor representative of FXCM and is therefore acting independently. The opinions given are their own, constitute general market commentary, and do not constitute the opinion or advice of FXCM or any form of personal or investment advice. FXCM neither endorses nor guarantees offerings of third party speakers, nor is FXCM responsible for the content, veracity or opinions of third-party speakers, presenters or participants.

Russell 2000 Very UndervaluedJust wanted to share this to help people keep calm during this tariff everything sell off. Small caps have been crushed well below their longterm trend. I'd suggest holding on for the rebound above resistance.
Russell 2000 Key levels ahead of US OpenBearish Scenario:
The Russell 2000 index remains in a shorter-term downtrend, signaling continued bearish momentum. The key resistance level to watch is 2208. If an oversold rally occurs but faces rejection at this level, the index could resume its decline, targeting 2078, followed by 2015 and the psychological 2000 level over a longer timeframe.
Bullish Scenario:
A confirmed breakout above 2208 and a daily close above this level would invalidate the bearish outlook. This could trigger further upside movement, with resistance targets at 2230, followed by 2278.
Conclusion:
The near-term sentiment remains bearish, with 2208 as the key pivot level. A rejection from this resistance would reinforce downside risks, while a breakout above it could indicate a shift toward renewed bullish momentum. Traders should closely monitor price action around this level to assess the next move.
This communication is for informational purposes only and should not be viewed as any form of recommendation as to a particular course of action or as investment advice. It is not intended as an offer or solicitation for the purchase or sale of any financial instrument or as an official confirmation of any transaction. Opinions, estimates and assumptions expressed herein are made as of the date of this communication and are subject to change without notice. This communication has been prepared based upon information, including market prices, data and other information, believed to be reliable; however, Trade Nation does not warrant its completeness or accuracy. All market prices and market data contained in or attached to this communication are indicative and subject to change without notice.

RUSSELL capped by 200DMA, The Week Ahead 03rd March '25The Russell 2000 (US2000) index exhibits bearish sentiment as the long-term uptrend is under threat, with price action closing below the psychologically significant 200-day moving average (2209). Since reaching an all-time high on November 25, 2024, the index has started to show weakness, suggesting a potential continuation of its corrective consolidation.
Bullish Scenario:
The 2209 level (200-day moving average) serves as a critical support zone.
A bullish rebound from this level could restore upward momentum.
Potential upside targets include:
2257 (initial resistance)
2324 (next major resistance)
2360 (longer-term target)
A strong bounce from 2209 could signal a recovery and reaffirm the broader uptrend, attracting renewed buying interest.
Bearish Scenario:
A confirmed break below 2141 support, followed by a daily close under this level, would indicate further weakness.
This could accelerate the downside momentum, leading to potential targets at:
2093 (next key support)
2023, if selling pressure intensifies
A sustained move below 2141 would invalidate the bullish outlook, suggesting the corrective phase could deepen, with the potential for an extended pullback.
Market Outlook:
The 2209 level remains the key pivot—holding above it could support a recovery, while a decisive break lower would confirm a deeper correction. Traders should monitor price action closely for confirmation signals to assess the next directional move in the market.
This communication is for informational purposes only and should not be viewed as any form of recommendation as to a particular course of action or as investment advice. It is not intended as an offer or solicitation for the purchase or sale of any financial instrument or as an official confirmation of any transaction. Opinions, estimates and assumptions expressed herein are made as of the date of this communication and are subject to change without notice. This communication has been prepared based upon information, including market prices, data and other information, believed to be reliable; however, Trade Nation does not warrant its completeness or accuracy. All market prices and market data contained in or attached to this communication are indicative and subject to change without notice.

RUT - Russle signals a drop to 1900ishThe white Pitchfork was guiding us to the Center-Line. As so often, price is turning at this level, just to reach the opposite side.
It's the same game every time.
Just follow the rules, apply a good risk and money management.
The down-sloping red Fork projects the current most probably path of price to the downside. And of course our profit target, which is the red Center-Line.
The signal is the break, the close below the shelf, the tiny support, marked by the petrol horizontal line.
Trade wisely, trade without attaching your emotions. It just is what it is, whatever the outcome will be. Knowing this, you can embrace inner freedom in trading.

US2000 - Potential Buy Opportunity at Key Support LevelPEPPERSTONE:US2000 has reached a significant demand zone, highlighted by previous price reactions and strong buying interest. This area has historically acted as a key support level, suggesting the potential for a bullish reversal if buyers step back in.
The current market structure suggests that if the price confirms a rejection from this support zone, there is a high likelihood of an upward move. I anticipate that if rejection occurs, the market may head higher toward the 2,260 level, which represents a logical target within the current market structure.
If you agree with this analysis or have any additional thoughts, feel free to share them in the comments!
