US30 Short Trump Tariffs/ Inflation and FEDBad Data! Recession,inflation! That says it all.
Enties exits:See the chart please!
US30 trade ideas

Stocks likely to dip lowerStocks likely to drop lower, inflation is still hot. Trade Safe - Trade Well.

XAUUSD 1HFollowing the previous analysis ...
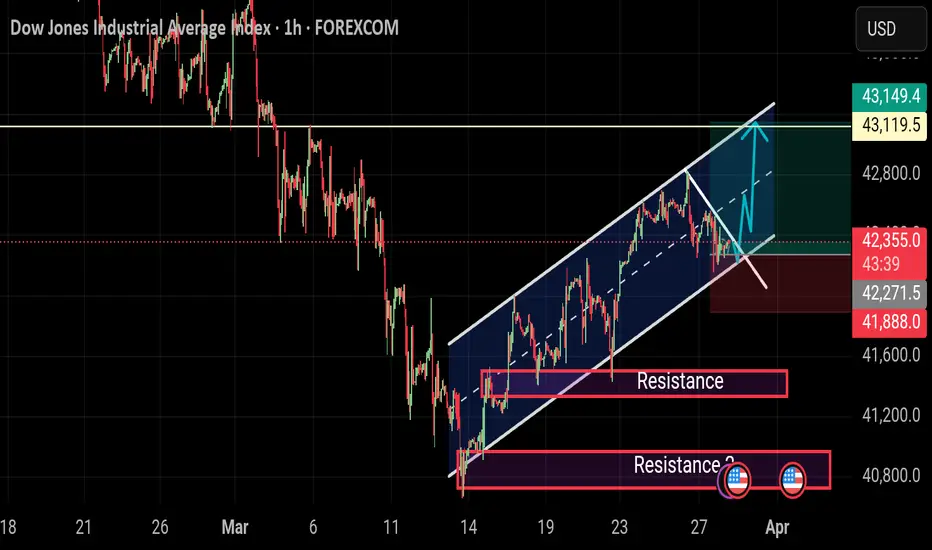
#DowJones Analysis
As long as 41825 holds, an upward move is expected with potential resistance at 42200.
The market movement is anticipated to follow the sketched schematic.

Falling towards pullback support?Dow Jones (US30) is falling towards the pivot which has been identified as a pullback support and could bounce to the overlap resistance.
Pivot: 42,056.64
1st Support: 41,442.18
1st Resistance: 42,990.
Risk Warning:
Trading Forex and CFDs carries a high level of risk to your capital and you should only trade with money you can afford to lose. Trading Forex and CFDs may not be suitable for all investors, so please ensure that you fully understand the risks involved and seek independent advice if necessary.
Disclaimer:
The above opinions given constitute general market commentary, and do not constitute the opinion or advice of IC Markets or any form of personal or investment advice.
Any opinions, news, research, analyses, prices, other information, or links to third-party sites contained on this website are provided on an "as-is" basis, are intended only to be informative, is not an advice nor a recommendation, nor research, or a record of our trading prices, or an offer of, or solicitation for a transaction in any financial instrument and thus should not be treated as such. The information provided does not involve any specific investment objectives, financial situation and needs of any specific person who may receive it. Please be aware, that past performance is not a reliable indicator of future performance and/or results. Past Performance or Forward-looking scenarios based upon the reasonable beliefs of the third-party provider are not a guarantee of future performance. Actual results may differ materially from those anticipated in forward-looking or past performance statements. IC Markets makes no representation or warranty and assumes no liability as to the accuracy or completeness of the information provided, nor any loss arising from any investment based on a recommendation, forecast or any information supplied by any third-party.

DJI - channel retest, hidden bearish divergenceI think DJI will retest the broken channel at 0.5 fib retracement and will be rejected from it. There is also 4h hidden bearish divergence (1d on US30). I expect SPX and NDX to fall simultaneously with DJI.


SHORT ON US30US30 Has given a change of character (choc) on the 4hr TF indicating the end of its uptrend pullback on its overall downtrend.
I will be selling US30 to the next level of demand looking to capture over 1000 points.

The possibility of the upward correction ending and the decline Considering the zone marked on the chart and considering that the price has seen a lower low, it seems that the upward correction in the price will end soon and we should wait for a new downward movement. Targets and stop loss of my position are marked on the chart.

i will go short on DOW for short term...im in buy long term!!!we can sell dow now in short term...trade wid sl and tp guys...do not forget to use money management...trade safe and well

DOW JONES (US30): Bullish Reversal Confirmed?!
Dow Jones finally looks strong.
I see a high momentum bullish candle after
a confirmed liquidity grab below the underlined demand zone.
I expect up move at least to 41750 resistance.
❤️Please, support my work with like, thank you!❤️
I am part of Trade Nation's Influencer program and receive a monthly fee for using their TradingView charts in my analysis.

US30 bullish LongWall Street goes full bull with tariffs and payrolls looming
I buy the correction
Price closed at low on Friday,for me:Time to buy the correction
Also non farm payrolls looming coming this Friday.
I dont use price action,because it is worthless to use past gone data,on future movements.
Instead I use my favourite commercial analysis
Big commercials buying US30, hedgefunds taking profit and selling it.It means its time to BUY!!!

US 30 daily time frame US30 (Dow Jones) Daily Chart Analysis – Bearish Breakdown Ahead?
Market Structure & Trend Analysis:
The chart shows a Head and Shoulders (H&S) pattern, which is a bearish reversal formation.
Neckline break confirmed, suggesting further downside movement.
The large blue arrow points to the next key support area near 38,731, representing a potential drop of about -9.51%.
Key Levels to Watch:
Resistance: 42,500 - 43,000 (previous support turned resistance).
Support: 38,731 (historical demand zone & target from the H&S breakdown).
RSI & Volume Analysis:
RSI at 36.82, nearing oversold territory but still has room for further downside.
Volume increased on the breakdown, confirming selling pressure.
Trade Considerations:
📉 Bearish Scenario: If price stays below the broken trendline, we could see a continuation towards 38,731.
📈 Bullish Scenario: If price reclaims 43,000, the bearish pattern could be invalidated.
⚠️ Wait for Retest: A potential retest of the neckline (around 42,500) before further decline.

US30 - Catch The Next Wave!US30 is currently in an uptrend, with price action respecting a well-defined ascending channel. We anticipate another bounce from channel support.
In Wave 2, price was rejected at the 38.2% Fibonacci retracement level, and we expect a similar reaction for Wave 4.
Our strategy is to wait for price to enter the buy zone, between the 38.2% and 50% Fibonacci retracement levels, and look for bullish reversal signals before entering a position.
Potential Bullish Reversal Signals:
Trendline break
Break of structure (BOS)
Other confirmation patterns
Trade Plan:
- Monitor price movement into the buy zone, aligning with channel support.
- Enter long positions upon confirmation of bullish price action, placing stop-loss below the established low formed after bullish confirmation.
Target levels: 45,000 and 48,500, with the remainder held for a potential extended swing trade.
Goodluck and as always, trade safe!

US30 Update - Potential TargetsI calibrated the analysis a little:
It seems like stocks have some bullish strength.
We'll have to wait and see if the imbalance will be filled in
the short term.
Feel free to ask if anything is unclear.
Thank you for taking the time to study my analysis

TECHNICAL AND FUNDAMENTAL ANALYSIS FOR LONGBuying US30 from 42,300 to 42,200 with a target of 43,100 appears to be a bullish strategy. To justify this move, let's break down the fundamental analysis.
*Market Trend*
The Dow Jones Industrial Average (US30) has been on an upward trend, with a 13.7% increase over the last six months ¹. This suggests a strong bullish momentum.
*Technical Indicators*
- *MACD (Moving Average Convergence Divergence)*: Although the MACD lines remain in bullish territory, the histogram has started to tick lower, indicating a potential weakening of the bullish momentum ¹.
- *RSI (Relative Strength Index)*: The RSI is approaching overbought territory, a level often associated with trend exhaustion ¹.
*Economic Factors*
- *Strong Labor Market*: The US labor market has shown resilience, with strong payroll data and wages growing at 4% ².
- *Interest Rates*: The Federal Reserve's interest rate decisions will impact the US30. A rate cut could boost the index, while a rate hike might lead to a correction ².
*Trading Strategy*
Given the bullish trend and strong labor market, buying US30 from 42,300 to 42,200 with a target of 43,100 seems reasonable. However, keep a close eye on technical indicators and economic factors, as they can impact the index's movement.
*Risk Management*
- *Stop-Loss*: Set a stop-loss at 42,000 to limit potential losses.
- *Position Sizing*: Manage your position size to maintain a risk-reward ratio of 1:1.5.
By considering both technical and fundamental analysis, you can make an informed decision about your trading strategy.
Keep your best wishes to the Travis 👍
US30 3D IdeaPotential for a bearish pullback on the US30 3D which could lead to a price movement towards the support level at 38400. SELL levels from 41900

Us30 sell market technicals Us30 sell market technicals. Looking like a nice drop from trend lines. Signal was sent to GTE vip.

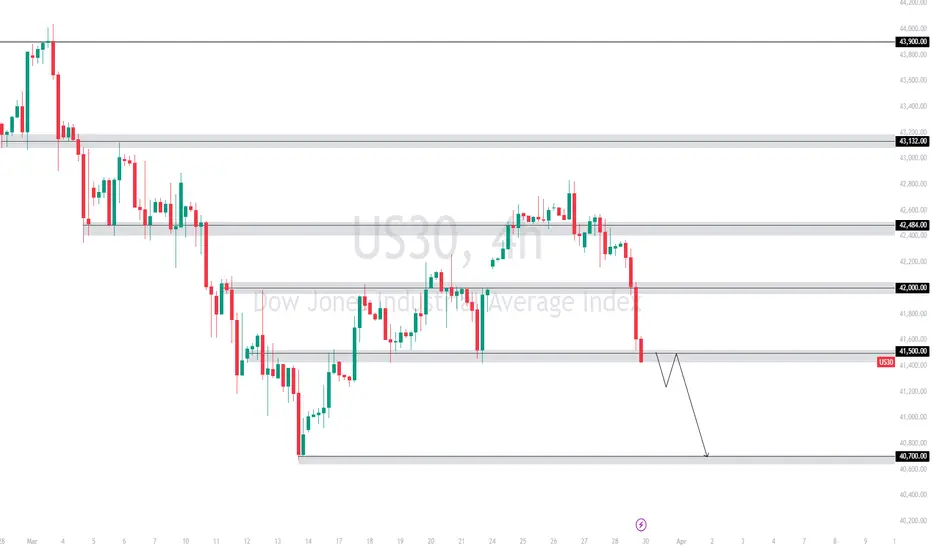
US30 Technical Analysis🔹 Trend Overview:
US30 is in a strong bearish trend after breaking key support levels. The price has dropped significantly and is currently testing the 41,500.00 support zone. If this level fails to hold, further downside is expected.
🔹 Key Levels:
📈 Resistance: 42,000.00 – 42,484.00
📉 Support: 41,500.00 – If broken, price may drop further to 40,700.00
🔹 Market Structure:
⚠️ Bearish scenario: Price could retest 41,500.00 before continuing its downtrend towards 40,700.00
🚀 Bullish scenario: If 41,500.00 holds as support, a short-term pullback toward 42,000.00 is possible.
📌 Risk Management:
-Wait for a confirmation of breakout or rejection before entering trades.
-Monitor for potential fake-outs at 41,500.00 before committing to a position.
Do Or Die!The past few weeks have caught out many bulls as Trump tariffs wreck the markets.
41K support today may just be the bottom, this area must hold, otherwise we are heading not just for a correction but a bear market.
The falls have been consistent and steady, no real plunges which points to a correction, although we do have a double top from the Dec highs and early Feb highs.
Gold and silver have been the standout performers, 3000 gold will be blown away.
A mix of Trump threats of tariffs and many beginning to wake up to media attention in PM's....a hedge against turmoil.
Any close below the Dow low is a short, from here bottom fishing just may produce a rally of significance, perhaps a rally to sell.
Appreciate a thumbs up and God Bless you all!

US30 Dow Jones Trade Idea📉 The US30 (Dow Jones) is currently overextended! In this video, we analyze the price action 🔍 and go over my trading plan for a potential short 📊—if the setup plays out as discussed. 🚨 Not financial advice! 🚫e.

US30 Dow Jones Possible RetraceThe US30 Dow Jones is showing bullish momentum and is currently overextended. In this video, we explore a trade idea that involves a retracement to the 50% equilibrium level of the previous price swing. This is not financial advice.

Bearish reversal off pullback resistance?Dow Jones (US30) is rising towards the pivot which is a pullback resistance and could drop to the 1st support.
Pivot: 42,476.16
1st Support: 41,442.18
1st Resistance: 43,185.84
Risk Warning:
Trading Forex and CFDs carries a high level of risk to your capital and you should only trade with money you can afford to lose. Trading Forex and CFDs may not be suitable for all investors, so please ensure that you fully understand the risks involved and seek independent advice if necessary.
Disclaimer:
The above opinions given constitute general market commentary, and do not constitute the opinion or advice of IC Markets or any form of personal or investment advice.
Any opinions, news, research, analyses, prices, other information, or links to third-party sites contained on this website are provided on an "as-is" basis, are intended only to be informative, is not an advice nor a recommendation, nor research, or a record of our trading prices, or an offer of, or solicitation for a transaction in any financial instrument and thus should not be treated as such. The information provided does not involve any specific investment objectives, financial situation and needs of any specific person who may receive it. Please be aware, that past performance is not a reliable indicator of future performance and/or results. Past Performance or Forward-looking scenarios based upon the reasonable beliefs of the third-party provider are not a guarantee of future performance. Actual results may differ materially from those anticipated in forward-looking or past performance statements. IC Markets makes no representation or warranty and assumes no liability as to the accuracy or completeness of the information provided, nor any loss arising from any investment based on a recommendation, forecast or any information supplied by any third-party.

Trendline break The price has broken out of a bearish trendline and made a pullback, now the price looks to make a higher high and go long
WE ONLY TRADE PULLBACKS
