Wall Street sellWe hit the Wall Street sell signal with our friends in the sales channel and so far we have achieved the target of one to nine.
@SEED_G88
US30 trade ideas

DOW-US30 time to go long on DOWTeam, i wish i could show you my real account
time to go long on DOW - double bottom - retested
looking at 120-200 points recover

DJIAnticipating news to become increasingly worse over the next few weeks.
The bigger the crash, the greater the search for news, the more news to be printed.
US30 Short - Broke Ascending TrendUS30 has broke ascending trendline. I'm monitoring FVG's to fill orders. US30 currently trading below Daily Open price which is also in favor for a short.

High Probability or Nah?Is this setup justified, or is it just a seen Gap that SMT default settings had us spot?

Dow Jones Industrial Average ($US30): Market Mover or Stumbling?(1/9)
Good afternoon, everyone! ☀️ Dow Jones Industrial Average ( BLACKBULL:US30 ): Market Mover or Stumbling Block?
With the Dow at $42,407.80, is this blue-chip index a steady climber or a shaky step? Let’s chart the course! 🔍
(2/9) – PRICE PERFORMANCE 📊
• Current Price: $ 42,407.80 as of Mar 24, 2025 💰
• Recent Move: Up 0.8% from $41,985.35 on Mar 21, per data 📏
• Sector Trend: Mixed with tech, aerospace gains 🌟
It’s a bumpy climb—let’s see what’s driving it! ⚙️
(3/9) – MARKET POSITION 📈
• Composition: 30 U.S. blue-chip firms, all sectors but transport, utilities 🏆
• Trend: Volatile but up 1.2% weekly as of Mar 21, per data ⏰
• Sentiment: Cautious optimism amid trade tensions 🎯
Firm but tested by macro winds! 📊
(4/9) – KEY DEVELOPMENTS 🔑
• Fed Update: Rates steady, economic uncertainty up, per data 🌍
• Sector Gains: Boeing up 7% on Air Force deal, per data 📋
• Market Reaction: Dow up after tariff reprieve hopes 💡
Navigating a stormy market! 🌪️
(5/9) – RISKS IN FOCUS ⚡
• Trade Tensions: U.S.-China tariffs spark inflation fears 🔍
• Economic Slowdown: Consumer sentiment at 2022 lows 📉
• Policy Shifts: Trump tariffs add uncertainty ❄️
It’s a rocky path—watch the curves! 🛑
(6/9) – SWOT: STRENGTHS 💪
• Blue-Chip Base: 30 industry leaders 🥇
• Sector Gains: Tech, aerospace lift index 📊
• Resilience: Up 12.7% from 52-week low 🔧
Got a sturdy engine under the hood! 🏦
(7/9) – SWOT: WEAKNESSES & OPPORTUNITIES ⚖️
• Weaknesses: Volatility, 5.9% off peak 📉
• Opportunities: Rate cut hopes, tech rebound 📈
Can it climb higher or stall out? 🤔
(8/9) – POLL TIME! 📢
Dow at $42,407.80—your take? 🗳️
• Bullish: $44,000+ soon, rally resumes 🐂
• Neutral: Steady, risks balance out ⚖️
• Bearish: $40,000 looms, correction deepens 🐻
Chime in below! 👇
(9/9) – FINAL TAKEAWAY 🎯
Dow’s $42,407.80 price shows cautious gains 📈, but volatility’s in the air 🌿. Dips are our DCA fuel 💰—buy low, ride high! Gem or bust?

US30/DJI "Dow Jones" Index CFD Market Heist Plan (Day or Swing)🌟Hi! Hola! Ola! Bonjour! Hallo! Marhaba!🌟
Dear Money Makers & Robbers, 🤑 💰💸✈️
Based on 🔥Thief Trading style technical and fundamental analysis🔥, here is our master plan to heist the US30/DJI "Dow Jones" Index CFD Market. Please adhere to the strategy I've outlined in the chart, which emphasizes long entry. Our aim is the high-risk Red Zone. Risky level, overbought market, consolidation, trend reversal, trap at the level where traders and bearish robbers are stronger. 🏆💸Book Profits Be wealthy and safe trade.💪🏆🎉
Entry 📈 : "The heist is on! Wait for the MA breakout (42200) then make your move - Bullish profits await!"
however I advise to Place Buy stop orders above the Moving average (or) Place buy limit orders within a 15 or 30 minute timeframe most recent or swing, low or high level.
📌I strongly advise you to set an alert on your chart so you can see when the breakout entry occurs.
Stop Loss 🛑:
Thief SL placed at the recent/swing low level Using the 1H timeframe (41400) swing trade basis.
SL is based on your risk of the trade, lot size and how many multiple orders you have to take.
🏴☠️Target 🎯: 43100 (or) Escape Before the Target
🧲Scalpers, take note 👀 : only scalp on the Long side. If you have a lot of money, you can go straight away; if not, you can join swing traders and carry out the robbery plan. Use trailing SL to safeguard your money 💰.
US30/DJI "Dow Jones" Index CFD Market Heist Plan (Swing/Day) is currently experiencing a bullishness,., driven by several key factors.
📰🗞️Get & Read the Fundamental, Macro, COT Report, Geopolitical and News Analysis, Sentimental Outlook, Intermarket Analysis, Index-Specific Analysis, Positioning and future trend targets.. go ahead to check 👉👉👉
📌Keep in mind that these factors can change rapidly, and it's essential to stay up-to-date with market developments and adjust your analysis accordingly.
⚠️Trading Alert : News Releases and Position Management 📰 🗞️ 🚫🚏
As a reminder, news releases can have a significant impact on market prices and volatility. To minimize potential losses and protect your running positions,
we recommend the following:
Avoid taking new trades during news releases
Use trailing stop-loss orders to protect your running positions and lock in profits
💖Supporting our robbery plan 💥Hit the Boost Button💥 will enable us to effortlessly make and steal money 💰💵. Boost the strength of our robbery team. Every day in this market make money with ease by using the Thief Trading Style.🏆💪🤝❤️🎉🚀
I'll see you soon with another heist plan, so stay tuned 🤑🐱👤🤗🤩

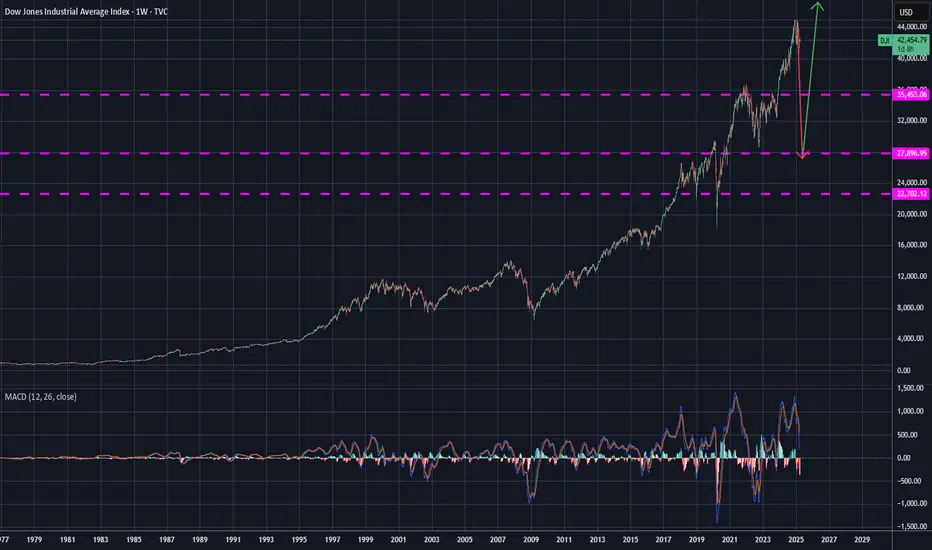
Recession searches spike on Google!!Good day traders and investors.,
The term recession has had a few spikes over the years since Google has been around, but what does it mean? These searches are typical made by the common folks.
Did the herd get it right this time?? Probably not, I have generally bet against them. The Google search trends has the data to back the information. Generally this means the bottom is either in or close. Also on two occasions there have been a couple of back to back spikes. Almost like one was a precursor.
You can see very clear in this naked chart of the DOW JONES, that only includes the GOOGLE TRENDS search of the term “RECESSION”. I have time aligned the GOOGLE TRENDS data to the DOW JONES it really shows a clear picture. The herd is always a day late and a dollar short. By the time they are searching it most of the pain is gone and the market is at or near a bottom. The only question that remains is, how long? If it lasts too long it could hurt any forward movement.
Let me know what you think
Kind regards,
WeAreSat0shi

US30 new update, bearish at allhi mates, I'm here with something new. US30 4h timeframe. i think its still bearish, what's your opinion. lets talk about it


Trade Idea : US30 Sell ( MARKET)1. Technical Analysis
Daily Chart
• Trend: The index is in a broader downtrend, with a recent pullback from highs around 42890 to 42060.
• MACD: Deep in negative territory, suggesting bearish momentum.
• RSI: 43.01 — indicating it’s closer to oversold but still has room to fall further before a reversal.
15-Minute Chart
• Trend: Short-term uptrend, showing a rally from a dip around 40900 to 42060, but nearing resistance near 42145.
• MACD: Positive, but momentum appears to slow down.
• RSI: 61.29 — heading toward overbought territory, indicating a potential pullback.
3-Minute Chart
• Trend: Micro uptrend, but showing signs of consolidation after the recent strong push.
• MACD: Positive but flattening, suggesting momentum is fading.
• RSI: 60.10 — also near overbought.
⸻
2. Fundamental Analysis
• Market Sentiment: Recent rallies seem more like a technical rebound rather than a fundamentally-driven bullish push.
• Geopolitical/Economic Factors: If the broader market sentiment remains uncertain (e.g., interest rate worries, inflation data), the US30 could face further downward pressure.
• Dollar Strength: A strong USD typically weighs on US equities, which aligns with the bearish technical outlook.
⸻
3. Trade Setup: Short Position (Sell)
• Entry: 42080 (near current price, just under resistance)
• Stop Loss (SL): 42150 (just above the last 15-min resistance level)
• Take Profit (TP): 41700 (previous support on the 15-min chart) FUSIONMARKETS:US30

The bear setup into Late March is still intactNo change in the analysis from yesterday. The pump today is just another attempt to breakout of the range and I don't think they will do it. More traps.

US30My opinion
Unspoken truth: The 3rd touch on #US30 can make or break your trading strategy. Don't underestimate its impact. Stay focused and stay informed with our expert market analysis. #tradingtips #stockmarket #investing

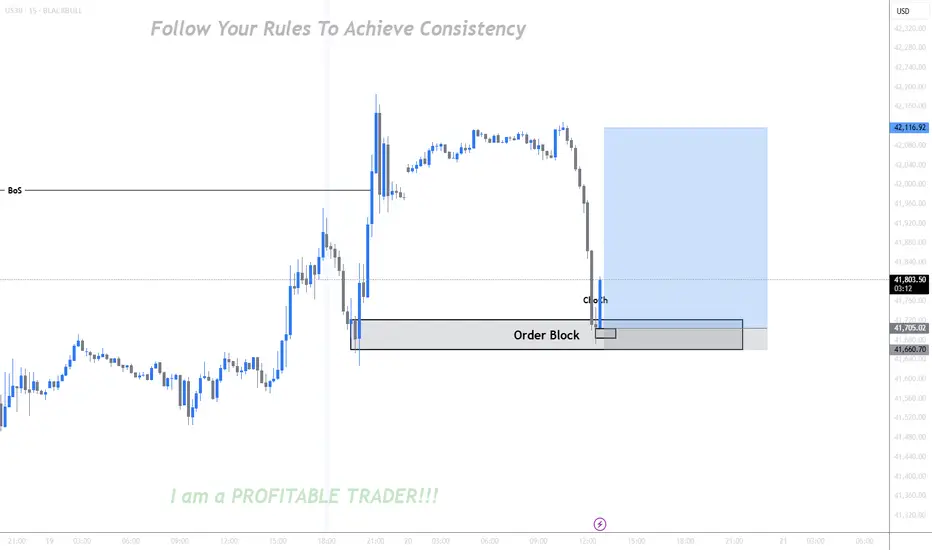
Order Block @41721 |Buy SignalPrice gave us a break of structure and came back to mitigate the order block that lead to the break of structure. It gave us confirmation on a lower timeframe upon mitigating the order block. So now I am waiting for price to come back to my 1m timeframe for an entry.
Long term outlook of Dow jones US 30Break of sec trendline may take US30 to Primary trendline. Due to Economic Uncertainty Dow jones is consolidating with bearishness. But we expecting recovery in last quarter of the year.

Bearish drop?Sow Jones (US30) is rising towards the pivot which acts as a pullback resistance and could drop to the 1st support which has been identified as a pullback support.
Pivot: 42,198.94
1st support: 41,416.44
1st Resistance: 43,014.27
Risk Warning:
Trading Forex and CFDs carries a high level of risk to your capital and you should only trade with money you can afford to lose. Trading Forex and CFDs may not be suitable for all investors, so please ensure that you fully understand the risks involved and seek independent advice if necessary.
Disclaimer:
The above opinions given constitute general market commentary, and do not constitute the opinion or advice of IC Markets or any form of personal or investment advice.
Any opinions, news, research, analyses, prices, other information, or links to third-party sites contained on this website are provided on an "as-is" basis, are intended only to be informative, is not an advice nor a recommendation, nor research, or a record of our trading prices, or an offer of, or solicitation for a transaction in any financial instrument and thus should not be treated as such. The information provided does not involve any specific investment objectives, financial situation and needs of any specific person who may receive it. Please be aware, that past performance is not a reliable indicator of future performance and/or results. Past Performance or Forward-looking scenarios based upon the reasonable beliefs of the third-party provider are not a guarantee of future performance. Actual results may differ materially from those anticipated in forward-looking or past performance statements. IC Markets makes no representation or warranty and assumes no liability as to the accuracy or completeness of the information provided, nor any loss arising from any investment based on a recommendation, forecast or any information supplied by any third-party.

US30USD - 5 year old analyse Letting my 5 year old chart :)
Looks like we have a consensus that the market is "poo poo" and there is a lot of crying, rainbows and storms arising.
The elephant could be interpreted as "Trump"

US30 SHORT IDEA Short idea for US 30 with the probability of price taking out the level 40668.0 But currently would target 41236.4 for TP and SL just above 41894.0 .. Drop me a comment and tell me what you think ..

US30 (Dow Jones) Technical Analysis – Bullish Scenario to 42300The US30 (Dow Jones) 1-hour Heikin Ashi chart suggests a potential bullish continuation. Based on technical analysis, the price has shown resilience after a pullback and is currently positioned for a potential climb towards the 42,300 level.
Key Technical Levels:
Current Price: ~41,741
Immediate Support: 41,600 – 41,739
Major Support: 41,420 – 41,400 (Break of this level invalidates the bullish outlook)
Target Resistance: 42,300
Technical Indicators & Market Structure:
Price Action & Structure:
The price is currently consolidating around 41,750, forming higher lows, which indicates bullish pressure.
A clear breakout above 41,800 could trigger further upside momentum.
Failure to hold above 41,420 – 41,400 will shift momentum bearish.
MACD Indicator:
The MACD histogram shows a recovery, with a shift towards positive momentum.
The signal line is turning upwards, supporting a bullish outlook.
Support & Resistance Levels:
41,600 – 41,739 acts as a key support zone, where buyers have defended price recently.
42,300 is the next significant resistance, aligning with a prior supply zone.
Risk Management – Invalidation Level:
If US30 declines to 41,400 or below, this analysis will be considered invalid, as it would indicate increased bearish momentum.
Conclusion & Projection:
Bullish Case: If price maintains above 41,600 and breaks 41,800 with strong momentum, a rally towards 42,300 is expected.
Bearish Risk: A drop below 41,400 will invalidate the bullish setup and suggest further downside.
This analysis remains valid unless the price breaks below 41,400, which would signal a potential trend reversal.

Bearish outlook, followed by a bullish longUS30 broke through a bearish channel last week and has continued to show bullish pressure. However, as long as the price is under 42,000, the indice may correct a bit, towards the 41,550, 41,200, and 41,000 barriers.
Price action is currently oscillating between 42,000 and 40,600. A break of either side, will be the intended direction from a long term perspective.

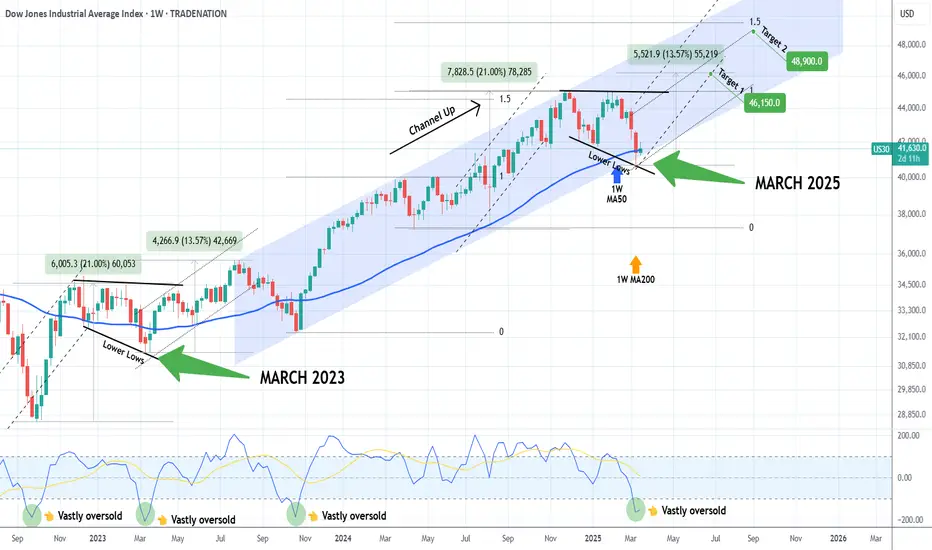
DOW JONES This is why chances of a brutal rebound are so high.Dow Jones (DJIA) has been trading within a Channel Up since the July 31 2023 High and last week it hit (marginally breached) its 1W MA50 (blue trend-line) for the first time since the week of October 30 2023. The price went on to test the bottom of the Channel Up and rebounded back above the 1W MA50.
This is an incredibly strong long-term bullish signal and it is not the only one. The market also made a Lower Low rebound on the 3-month trend-line while the 1W CCI got oversold below -150.00 and is rebounding. The last time we got these conditions fulfilled was exactly 2 years ago on the March 13 2023 Low.
That was when the index made a similar Megaphone Lower Low rebound on oversold 1W CCI that initiated a +13.57% rally. Both Megaphone fractals emerged after Dow rose by +21.00%.
In fact, every oversold 1W CCI rebound has produced very aggressive rallies. Based on those similarities with the March 2023 fractal, we expect the index to hit 46150 (+13.57%) minimum by July. If the more aggressive scenario of the November 25 2024 rally that made a Channel Up Higher High on the 1.5 Fibonacci extension prevails, then our more optimistic scenario is 48900 (Target 2) by September, which could technically be the end/ Top of the current Bull Cycle.
-------------------------------------------------------------------------------
** Please LIKE 👍, FOLLOW ✅, SHARE 🙌 and COMMENT ✍ if you enjoy this idea! Also share your ideas and charts in the comments section below! This is best way to keep it relevant, support us, keep the content here free and allow the idea to reach as many people as possible. **
-------------------------------------------------------------------------------
Disclosure: I am part of Trade Nation's Influencer program and receive a monthly fee for using their TradingView charts in my analysis.
💸💸💸💸💸💸
👇 👇 👇 👇 👇 👇
DowJones INTRADAY Volatility ahead Fed Rate decisionAs the Federal Reserve wraps up its two-day meeting today, investors will be paying close attention to Chair Jerome Powell’s comments, as they could spark market volatility.
Although Powell recently stated that “the economy’s fine,” traders will closely examine his remarks and the updated forecasts (the dot plot) for any signs of concern. The Fed’s projections are expected to show slower economic growth while acknowledging persistent inflation. Typically, the Fed waits for clear changes in the data before taking more decisive action.
Key Support and Resistance Levels
Resistance Level 1: 42488
Resistance Level 2: 43067
Resistance Level 3: 43575
Support Level 1: 40657
Support Level 2: 40109
Support Level 3: 39584
This communication is for informational purposes only and should not be viewed as any form of recommendation as to a particular course of action or as investment advice. It is not intended as an offer or solicitation for the purchase or sale of any financial instrument or as an official confirmation of any transaction. Opinions, estimates and assumptions expressed herein are made as of the date of this communication and are subject to change without notice. This communication has been prepared based upon information, including market prices, data and other information, believed to be reliable; however, Trade Nation does not warrant its completeness or accuracy. All market prices and market data contained in or attached to this communication are indicative and subject to change without notice.

Buy the dip: US30 (Dow Jones industrial average Index)Hello,
The stock market remains a compelling investment option despite a two-month correction. Recently, U.S. equities have experienced heightened volatility as investors navigate the uncertainties surrounding trade tariffs and regulatory policies. President Trump’s unpredictable stance—announcing tariffs only to retract them at the last minute—has added to market instability, making it challenging for businesses to plan with confidence.
While many analysts anticipated higher inflation due to tariffs, deregulation, and deportations, the combination of a declining stock market and falling interest rates suggests a potential deflationary environment. Given these conditions, Federal Reserve Chair Jerome Powell has signaled a cautious stance, acknowledging that inflation remains contained. However, if fears of an economic slowdown driven by trade tensions escalate, the Fed may implement the first of a series of rapid rate cuts as early as June.
The next Federal Reserve rate decision is scheduled for today March 19, 2025. As shown in the chart here
The stock market has remained resilient over the long term always recovering from corrections and achieving new highs. Since the current president (Trump) is pro markets, we expect the same trend to continue over the long run. This can be reinforced by the fact that he has gone to an extent of buying a Tesla car in support of Tesla company owned by Musk. At the right time, Trump or the FED shall move to save the stock market from a crash.
Disclosure: I am part of Trade Nation's Influencer program and receive a monthly fee for using their TradingView charts in my analysis.
