Weekly Forex Outlook Sun.March.16.2025 - Fri.March.21.2025Like and Comments would be appreciated :D Not Financial Advice, Just my outlook/opinion
US30 trade ideas

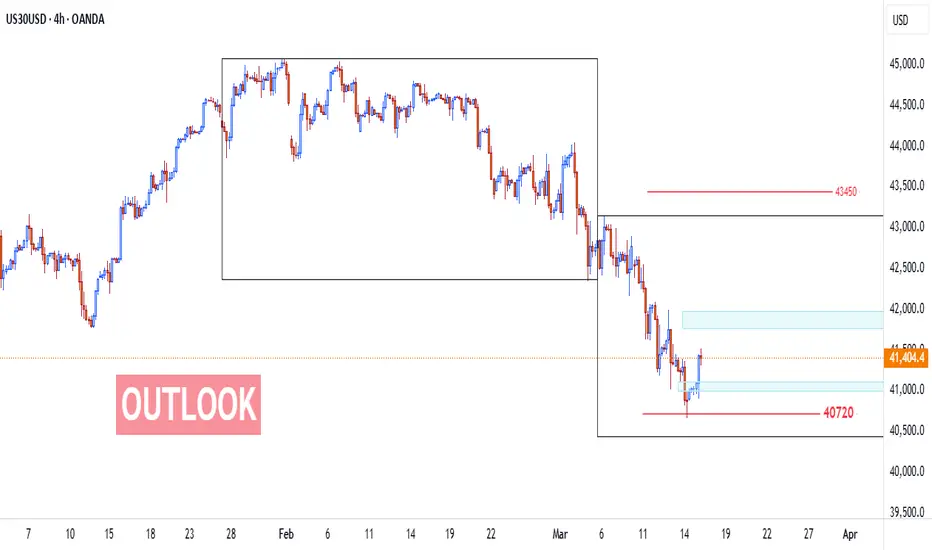
Will the Dow Jones index fall?If you see reversal patterns within the BTBE zone, you can enter a sell trade.
May your trades be profitable!

US30 TodayAs long US30 is below41570 is still bearish
I expect today my pattern on H1 to entry sell with TP new LOW

US30 Trade Outlook – 17/03/2025🚨 US30 Trade Outlook – 17/03/2025 🚨
📊 Market Structure & Key Levels
US30 remains in a downtrend, but price is currently consolidating near the EMAs. The market is at a decision point, with a potential breakout or rejection looming.
🔍 Key Observations:
✅ Bearish Trend – Price still below major EMAs.
✅ Key Resistance – 41,255 - 41,400 is a crucial supply zone.
✅ Support Holding? – 41,000 is acting as a short-term floor.
🎯 Trade Plan:
🔻 Short if rejection at 41,255, targeting 40,800 - 40,600.
🔹 Long if breakout & retest above 41,400, targeting 41,600 - 41,800.
⚡️ Patience is key. Wait for confirmations! 🔥

Dow Holds Steady Above 41,000Unlike the Nasdaq and SP500, Dow did not trace the full potential of its double top formation between 2024 and 2025 peaks, yet in a similar manner to the US indices, it rebounded from the 0.618 Fibonacci retracement of the May 2024-Jan 2025 uptrend, coinciding with oversold levels on the 3-Day RSI previously seen in October 2023.
The Dow’s rebound from the 40,660 low aligns with the bottom end of the duplicated channel of its respected up-trend between May 2024 and Jan 2025, strengthening positive rebound opportunities in tandem with the broader market sentiment.
Should the Dow hold above the 41,000-mark, levels 41,700, 42,600, and 43,400 may come back to play. From the downside, a clean close back below the 40,600-mark can extend losses in the direction of the double top formation’s target, aligning with possible support levels at 40,200, 39,500, and 38,700.
Key Events to Watch:
- Trade war Developments
- FOMC Meeting on Wednesday
Written by Razan Hilal, CMT

US30 (Dow Jones) 4H Analysis – Bearish Outlook Ahead?Trend Analysis:
🔸 The market is in a downtrend since early February.
🔸 Lower highs and lower lows indicate strong bearish momentum.
🔸 A recent break below support suggests further downside pressure.
📌 Key Support & Resistance Zones:
🟣 Resistance Zone (~41,500 - 41,300):
🔺 Price tried to retest but failed = Bearish signal 🚫
🟣 Support Zone (~40,000 - 39,800):
🔻 A minor support area before the next big level.
🔵 Major Target (38,821):
👉 If price keeps falling, it could reach this level 🔽
📊 Price Action & Prediction:
✅ Pullback to resistance → 🚀 Bears defending!
❌ If rejection holds → 📉 Drop expected towards 38,821.
🚦 A break above resistance? Trend might shift!
📌 Trading Idea:
🛑 Short below resistance if rejection holds.
🚀 Long only if resistance breaks convincingly.
⚠️ Stay cautious! Watch for confirmations 📊🔍

downtrendGiven the breakdown of the support range, it is expected that the continuation of the downward trend will form after the pullback to the resistance range.
If the green resistance range is broken, the above scenario will be invalidated.

US30 1HR // 17 March AnalysisWe can see that BLACKBULL:US30 is in a downtrend on the 1HR timeframe.
The price is near the our trendline and has touched our area of resistance around the 41500.00 once. Looking for the price to approach the area of resistance as well as trendline and show a good rejection for potential sells.
A good target would be the 40750.00 area.
DISCLAIMER: This analysis is purely for personal reference and record keeping and should be taken as educational material only, NOT FINANCIAL ADVISE. I will not be responsible for profits or loses due to this analysis.

sell then buyThis is the last downward wave that it does, at the specified price, the dollar printing machine will probably be launched and you will pocket some money

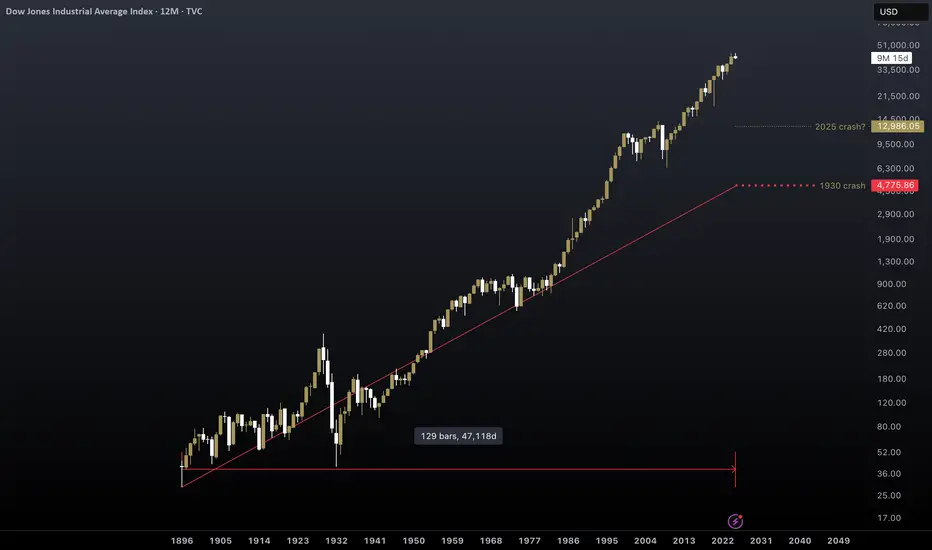
The Great Short of 2025I genuinely hope this doesn't happen, but we are squaring price at around 12.9k, 72 years after the half century bull market began.
Us30 Scenario 17/03/2025English : According to our analysis, we anticipate a BEARISH scenario.
Morocan Darija : kanchofo d'apres l'analyse dyalna antsanaw HBOOT
ATENTION : I only share my ideas, not signals.

Bullish bounce?Dow Jones (US30) has bounced off the pivot and could rise to the 1st resistance which is a pullback resistance.
Pivot: 40,928.39
1st Support: 40,177.61
1st Resistance: 42,282.48
Risk Warning:
Trading Forex and CFDs carries a high level of risk to your capital and you should only trade with money you can afford to lose. Trading Forex and CFDs may not be suitable for all investors, so please ensure that you fully understand the risks involved and seek independent advice if necessary.
Disclaimer:
The above opinions given constitute general market commentary, and do not constitute the opinion or advice of IC Markets or any form of personal or investment advice.
Any opinions, news, research, analyses, prices, other information, or links to third-party sites contained on this website are provided on an "as-is" basis, are intended only to be informative, is not an advice nor a recommendation, nor research, or a record of our trading prices, or an offer of, or solicitation for a transaction in any financial instrument and thus should not be treated as such. The information provided does not involve any specific investment objectives, financial situation and needs of any specific person who may receive it. Please be aware, that past performance is not a reliable indicator of future performance and/or results. Past Performance or Forward-looking scenarios based upon the reasonable beliefs of the third-party provider are not a guarantee of future performance. Actual results may differ materially from those anticipated in forward-looking or past performance statements. IC Markets makes no representation or warranty and assumes no liability as to the accuracy or completeness of the information provided, nor any loss arising from any investment based on a recommendation, forecast or any information supplied by any third-party.

US30 Rebounds from Key Support – Bulls Eyeing New HighsKey Support & Trendline Confluence:
The price recently bounced off the long-term ascending trendline, which has been a strong support level since late 2023.
The 38.2% Fibonacci retracement level ($40,205) provided additional confluence for a potential reversal.
Resistance Levels & Breakout Potential:
Immediate Resistance: $42,000 – A break above this level could confirm a bullish continuation.
Major Target: $45,065 – If momentum sustains, this all-time high could be tested soon.
Bullish Scenario:
A successful breakout above $42,000 could lead to an accelerated move toward $45,065 and beyond.
The trendline’s support indicates that bulls remain in control, and the recent rebound suggests renewed buying interest.
Risk Management & Confirmation:
Bullish confirmation: Sustained price action above $41,500 with strong volume.
Invalidation level: A breakdown below $40,000 could indicate a potential trend reversal.
Conclusion & Strategy:
Short-Term: Monitor price action around $42,000 for breakout confirmation.
Mid-Term: Expect a bullish move toward $45,000+ if the trendline holds.
Long-Term: If price breaks all-time highs, further upside potential is possible.
🚀 Bullish Confirmation Above $42,000 | ⚠️ Caution Below $40,000

US30US30 isn't ready for us to go back up yet, we need small correction before last drop and then we will look for buys.
Disclosure: We are part of Trade Nation's Influencer program and receive a monthly fee for using their TradingView charts in our analysis.

US30 Falling Wedge Breakout Setup – Bullish Momentum Building?📊 US30 (Dow Jones) Falling Wedge | Bullish Breakout Incoming? 🚀
🔍 Chart Analysis:
US30 is currently trading within a falling wedge pattern on the 1-hour timeframe. This formation typically signals a potential bullish breakout as selling pressure weakens.
📈 Key Levels to Watch:
✅ Breakout Zone: ~41,600 (upper wedge resistance)
✅ Next Resistance: 42,830 (100 SMA on 4H timeframe)
✅ Support: 40,800 (lower wedge support)
🎯 Trade Idea:
A confirmed breakout above 41,600 with strong volume could push price toward 42,830 and beyond.
Failure to break out may result in further consolidation within the wedge before a breakout attempt.
📢 What’s Your Take?
Do you see a breakout happening soon, or will US30 remain stuck in this wedge a bit longer? Drop your thoughts in the comments!

SMC. Long term buy pattern. -25%The order block below the liquidity level its a high probability point of interest for the buyers to take control of the market. Therefore, to execute we have to break down to the lower time frame and wait for the price to change the character for confirmation.

Dow JonesDOW JONES SPOT PRICE
MTF Analysis Price Time Frame Trend
Dow JonesYearly Demand 37,779 HTF UP
Dow Jones 6 Month Demand 36,952 HTF UP
Dow JonesQtrly Demand BUFL 40,077 HTF UP
38,269
Dow JonesMonthly Demand 40,077 MTF Down
Dow JonesWeekly Demand 39,628 MTF Down
Dow JonesDaily Demand DMIP 40,077 MTF Down
39,927
Dow Jones 240 M 39,027 LTF Down
Dow Jones 180 M 38,704 LTF Down
Dow Jones 120 M LTF Down
Dow Jones 60 M LTF Down
38,866
39,021
ENTRY -1 Long 39,628
SL 39,021
RISK 607
Target as per Entry 44,575
RR 8
Last High 44,575
Last Low 37,612

US30; Heikin Ashi Trade IdeaPEPPERSTONE:US30
In this video, I’ll be sharing my analysis of US30, using my unique Heikin Ashi strategy. I’ll walk you through the reasoning behind my trade setup and highlight key areas where I’m anticipating potential opportunities.
I’m always happy to receive any feedback.
Like, share and comment! ❤️
Thank you for watching my videos! 🙏

Short buy retrace to 42420 areaShort buy as the recession is increasing. I like the profit take at 42420 and sell at 42425 area

US30 BULLS WILL DOMINATE THE MARKET|LONG
US30 SIGNAL
Trade Direction: long
Entry Level: 41,378.4
Target Level: 43,046.4
Stop Loss: 40,263.5
RISK PROFILE
Risk level: medium
Suggested risk: 1%
Timeframe: 1D
Disclosure: I am part of Trade Nation's Influencer program and receive a monthly fee for using their TradingView charts in my analysis.

US3O 4H #DOWJONES – Key Levels & Trade Setups
🔻 Sell Setup: If price fails to hold above resistance, targeting 39400.
🔹 Risky Buy: If no lower low forms, possible buy with reduced size.
🚀 Bullish Confirmation: Break & retest of 41760 activates 42800 → 43000 → 44300.
⚡ Market conditions favor quick reactions—stay sharp!
Major Correction $DJI 2027Using previous dates of major market corrections to try and determine the next market correction (crash). Using major crashes I concluded the amount of bars it took from one correction to the next, and created a regression equation to conclude the next predicted market crash.
660/258 = 2.55
258/132 = 1.95
132/x = x
2.55
1.95
≈0.7647
1.95×0.7647≈1.49
132/x = 1.49
x≈88.59
x= 88 Bars +-1
= Monday May 3rd 2027
This is just an idea, does not hold much weight, just thought I would publish to keep a record of my idea.
appreciate any thoughts or comments.
