Bearish MovementThere is a huge dragon fly doji currently,but if price moves to 16927.4 and fails to break through that price zone,it will continue downwards until 14121.6
USTEC trade ideas

It's A Buying Opportunity...Not much exciting to say here other than it's corrected extremely fast and reached a historically oversold level you can just throw a brainless buy at it and win long term while the majority panic and doom themselves out of an easy win.

NAS100 vs Russell2000 ShortNAS100 vs Russell2000 is now net short on the regression break.
This is just for market measurements purposes

NAS100The NAS100, also known as the Nasdaq 100, is a stock market index that includes 100 of the largest non-financial companies listed on the Nasdaq Stock Market. It primarily represents technology and innovation-driven companies, such as those in sectors like technology, healthcare, consumer services, and industrials. The index is often used to gauge the performance of the tech-heavy part of the stock market. It reflects how well these companies are performing overall, but unlike other indexes, it excludes financial companies like banks and insurance firms. Investors and analysts often look at the NAS100 to track trends in the tech sector and its influence on the broader economy.

NQ: Upcoming Weekly Analysis!FA Analysis:
ST/MT/LT Outlook: Sell
1- Tariffs came into effect on April 2nd and market reacted badly to it. This was completely expected.
2- NFP data came green but market ignored it and continued the sell-off. This tells you the fundamental change in market expectations vis-a-vis US market! So bad data will be bad for equities and good data will be also bad.
3- This week, we've CPI, PPI and Consumer sentiment as major key data. They'll be fuel to the current fire.
4- The FED was tacit and still data related. The FED is running a risk of a late intervention!
5- Additional retaliations from the rest of the world are also expected. USA is isolating itself from the world economy; the damage is here to stay even if Trump cancel those tariffs or deregulate or cut taxes.
TA Analysis:
Weekly TF:
We got a strong bearish weekly close. A gap down should be added to the weekly candle.
A continuation down is expected.
Daily TF:
NQ provided one of the largest daily candle. Market was down until the last minute Friday! There is no interest to buy the dip at all!
A gap down is expected.
In the case of a gap, price might close the gap and continue down.
Hope we get some retrace to join the sell side during NY session.
Happy week with a lot of green pips!

Nasdaq drawing back for for a mini 'bull run' I'm no professional trader, so please don't quote me on this. But I've been doing this for 5 years now, and one thing that i notice time and time again is how just before a big push up there's always a low created first. Almost like the draw of a bow and arrow. So with that theory as well as my strategy applied, this is what i think Nasdaq is preparing to do.

US100 (NDQ): Trend in daily time framePlease pay special attention to the very accurate trends, channels, and colored levels.
Its a very sensitive setup, please be careful.
BEST,
MT

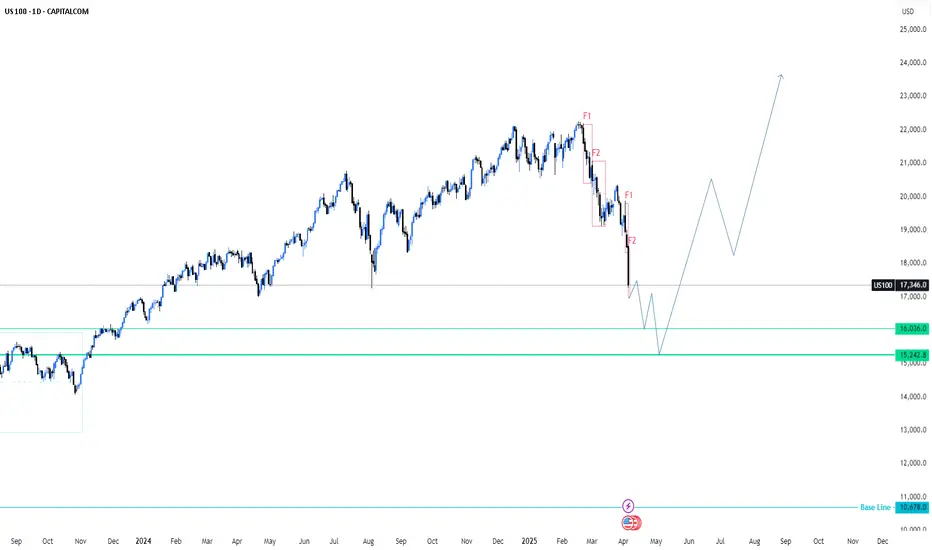
US100 (NASDAQ) Trade Idea 📊 US100 (NASDAQ) Trade Idea: Critical Support Test & Potential Reversal Setup
🔍 Key Levels & Context:
The US100 is currently testing a significant support zone between 16,000–17,000, which has historically acted as a springboard for rallies (see 2023 bounce). A breakdown below 16,000 would suggest a deeper correction toward 15,242 (next support) or even 14,000, while holding above 17,000 could keep the bullish structure intact.
🎯 Profit Targets (If Bullish Reversal Confirmed):
Initial Target: 19,000 (Previous resistance → now potential support-turned-resistance)
Secondary Target: 20,000–21,000 (Psychological level & measured move from consolidation)
Stretch Target: 23,000–24,000 (All-time high retest, Fibonacci extension confluence)
📉 Bearish Scenario (If Support Fails):
A close under 16,000 opens the door to 15,242 (2023 swing low)
Short-term rallies into 17,500–18,000 could then become sell opportunities.
So I think the US100 pursues the following projection, and I'd be happy if you share your thoughts 🫡
#Trading #NASDAQ #US100
Nasdaq what to expect next?The Nasdaq has declined approximately 23% from its all-time high, positioning us near a notable discount on a global timeframe. In my professional assessment, this presents a compelling opportunity to begin constructing a diversified portfolio. However, I anticipate further downward movement in the near term, so I recommend a measured approach—allocate capital gradually rather than deploying all available cash at once. Consider initiating positions through Contracts for Difference (CFDs) or Exchange-Traded Funds (ETFs), focusing on high-quality, blue-chip equities such as Microsoft (MSFT), Apple (AAPL), NVIDIA (NVDA), Nike (NIKE), and Walmart (WMT), among others.
That said, I advise against overcommitting capital at this juncture. The potential for an economic recession remains, and the market could trade sideways for an extended period—potentially one to two years. Prudence is warranted.
Additionally, the Fear and Greed Index for U.S. stocks currently stands at 6, a level strikingly close to the 5 recorded during the COVID-19 market crash. Those familiar with market history will recall the significant rebound that followed. This historical parallel suggests a potential inflection point.
Personally, I am actively participating in this market, incrementally rebuilding long-term positions within my investment account. Opportunities of this magnitude are infrequent, occurring perhaps once every few years. However, this does not preclude further declines—markets can always test lower levels. From a statistical perspective, though, the current environment supports initiating long-term investment positions with a disciplined strategy.
Let me know if you’d like a deeper analysis of specific assets or portfolio allocation tactics!
NOT FA!


NASDAQ: Wave Analysis & Forecast for April-MayHello, traders! Let’s analyze the current wave structure of the NASDAQ index.
At the moment, there is a high probability that the index is forming wave C of a correction. Most likely, this is a horizontal expanded correction.
✅ Sub-wave 1 of wave C has already formed.
✅ Sub-wave 2 is also likely completed.
On Friday, the index showed a strong decline and closed at the day’s lows, indicating a high probability of further downside movement next week.
What’s next?
We expect the formation of the third sub-wave within wave C. Most likely:
🔻 The index will continue to decline toward 17,700, where the 38% Fibonacci level is located.
🔻 The key support zone is 17,300.
🔻 After a short correction, the decline may extend to 16,300.
🔻 In a deeper scenario – down to 15,700-15,000.
Technical factors
⚡ The price failed to break above the 200-day moving average, bounced off it, and started declining.
⚡ The next major support is the 200-week moving average, around 16,200.
⚡ Throughout April – May, the market is likely to remain in a correction phase.
Once key levels are reached, we expect a potential reversal and new highs in the second half of 2025.
Stay tuned and share your thoughts in the comments!

NASDAQ 1D IdeaPotential for a bearish pullback on the NASDAQ 1D which could lead to a price movement towards the support level at 18300. SELL levels from 19400

US100 Downtrend Analysis & Key LevelsAfter analysing the US100 chart, the index has been trading within a downtrend channel since Friday, February 21, 2025. After dropping to 19,131, it attempted a recovery but faced strong resistance at 19,957, leading to a decline. As the saying goes, “ Follow the trend—the trend is your friend. ” Given the ongoing downtrend, US100 may continue to decline toward the next strong support level at 18,489.
Ensure you adhere to proper risk management for long-term success.
Happy Trading

Potential Bearish SetupThe chart indicates that the US100 index has broken below a strong ascending trendline, signaling a possible shift from bullish to bearish momentum.
📊 Trade Idea:
Entry: On a pullback to the 18,300–18,350 zone (look for bearish confirmation like a reversal candlestick).
Target: 15,500–16,000 area
Stop-loss: Above 18,350 (above the resistance/pullback zone)
Risk/Reward: Favorable setup if confirmed
This setup is based on classic price action: trendline break + pullback + continuation.

US Technology Companies at Great Risk #NDX US Technology Companies at Great Risk
Let's take a look from a fundamental and technical perspective;
If the protests against Trump, who has been in the presidential seat for 3 months, gain strength and reach a level that disrupts economic activity, uncertainty pricing increases in the markets .
Technology-weighted indices such as NASDAQ sell faster in such periods of uncertainty because they are in the ‘risky asset’ class.
The FED's interest rate cut expectations were first postponed, and now the possibility of cancellation is on the table. This creates negative pressure for technology stocks.
2025 Q1 balance sheets have not yet been fully announced. However, growth rates are slowing in many major technology companies, which means an extra threat to NASDAQ.
Let's take a look at the scenarios that could happen this week;
🔴 Protests increase, if the security problem grows:
NDX may fall below 16,700 again.
If panic sales come into play, there may be a decline to around 15,000.
🟢 If protests are quickly brought under control:
Buying comes from 17,000 level, reaction rise starts.
18.500 - 19.000 band can be retested.
🔸This week there was a very sharp decline of -9.77
🔸It is currently at 17.397 , which corresponds to the middle band of the logarithmic channel (black dashed line).
🔸 16,764 - Persistence below this level may lead to sharper selling.
🔸If the price closes weekly below 17,000 , stronger support around 15,000 may be tested.
🔸This decline may also cause large investors to switch to ‘risk off’ mode.

Us100 updateHi traders what is your opinion this week a sell or a buy,according to the strategy n my view,the target is 168 which is likely to hit n am expecting bull run to take over from this 2023 highs soo note that am positioning my self for big move,first thing this market is n uptrend market with weird n normal pull back this one was abnormal do to trade war which it's still going on,soo guys this all sell off is not a threat it is giving you a chance to ride long trades what you have to do is to generate liquidity into position n make sure you hold your trades for big rewards,before you overthink I identify the trend n find the really trend beside pull back understand what is moving n why I am going to buy,note that we are 6% away to recession do me favour invest in knowledge soo that you can be in high level of thinking and seeing things n not overthinking everything knowledge is power,I wish you all profitable week ahead.

NDX multiple channels, Which one is correct?Channels can be drawn in many ways because of fractal nature of markets. Every one could draw different channels and they all could be valid, So I prefer to draw a few likely ones some short term and others long term and find a cluster of convergence for high probability. No one is perfect
So just presenting what I see in NDX, mot likely ones
I expect Vix to reach 70, levels reached in 2008-GFC and 2020-covid. The tariff is a significant event in American history

Tariff news push down market, V sharp recovery still possibleDisclaimer: The following reflects personal opinions only and does not constitute investment advice. Please exercise your own judgment before making any decisions.
From Monday to Wednesday this week, the Nasdaq experienced a notable rebound, briefly climbing to 19,898 prior to the release of tariff-related news. However, the actual tariff figures and calculation methods far exceeded market expectations, causing a sharp sell-off once the announcement was made. On Friday, markets dropped further after China, the EU, and other countries announced retaliatory tariff measures. The VIX surged to 45.61 on Friday.
On Friday, Federal Reserve Chair Jerome Powell commented that the Fed remains in a wait-and-see mode regarding the future of tariffs. He noted that while tariffs could have short-term inflationary effects, current data shows inflation has significantly declined and the underlying U.S. economy remains strong. While this provided some support to the market, it was not enough to spark a meaningful rebound.
Key market concerns include:
1. Higher tariffs could lead to rising inflation, potentially delaying Fed rate cuts.
3. Tariff hikes and retaliatory measures may negatively impact multinational companies such as Apple and Nike that rely heavily on global markets and supply chains, resulting in lower revenues and increased operational costs.
3. Escalation of the trade war and more retaliatory measures may further dampen sentiment.
In the week ahead, markets will likely remain sensitive to policy developments.
A. If the Trump administration manages to reach agreements with certain countries to lower tariffs in exchange for concessions. Market sentiment could shift quickly, with investors viewing the tariff hike as a negotiation tactic with only short-term implications. - Vshape recovery
B. On the other hand, if the trade war continues to escalate, it would pose a clear negative for the markets.
Another potential headwind is the threat of U.S.-Iran conflict.
The Trump administration has repeatedly warned of possible military action against Iran. If such a conflict breaks out, markets may fear that Iran could block oil and gas shipments through the Strait of Hormuz, pushing up energy prices and triggering a broad risk-off move.
From a technical perspective, the market has broken below the upward trendline that has been in place since 2022, and continued to decline after retesting that level this week. Without a swift rebound, further downside is possible. Key support levels to watch are 16,962, 16,127, and 15,163.
That said, the tariff news has been priced in to some extent, and the VIX has already spiked above 45. The U.S. economy remains fundamentally solid, making it difficult for bearish sentiment to persist over the long term. Given Trump's negotiating style, some positive developments on tariffs are likely in the coming weeks. Meanwhile, the Fed has further reduced its balance sheet runoff in April, with QT now nearing its end.
In my view, short-term bearish sentiment may be near a turning point. There is a high probability of a rebound, but it’s essential to wait for further confirmation — either for negative news to subside or for a technical rebound signal to emerge.
At current levels, shorting the market carries high risk. Unless new negative catalysts or fundamental deterioration arise, I personally would not consider initiating short positions at this time.

Death Cross forming now on NDX weekly chartHi Renny here back with a chart for you guys to check out.
50 dma can be seen to be crossing below the 200 dma.
Look what happened after the last time that happened in 2022...
You would have done well to take money off the table the last time the 50 dma crossed below the 200 dma.
What's your take? Is there more downside from here?

NASDAQ Elliott Wave Analysis – Wave 4 Pullback in PlayNASDAQ is currently reacting to a major support zone, aligning with the Elliott Wave structure. Based on this analysis, we are in the midst of a Wave 4 pullback, which is expected to complete soon. Once Wave 4 finds its base, we anticipate a strong impulsive move to the upside—Wave 5—pushing us toward a new all-time high (AHT).
📉 Watching for confirmation of support holding before entering long.
📈 Targeting a continuation toward new highs following the completion of this corrective phase.

NASDAQ tanks below key levels amid new Trump tariffs!The market free-falls as Trump's new tariffs send shockwaves through global sentiment.
Sellers are piling in — but it's the fear of economic fallout that's truly fuelling this drop.
The NAS100 has broken through major support zones with strong bearish momentum.
Sellers are clearly in control, and price action shows little sign of slowing down.
Structure around 18,324 failed to hold. Next major support zone: 16,968.5.
Will the bleeding stop there?
⚠️ Reminder:
No one can predict what will happen next.
Markets react to collective psychology, news flow, and big players—not forecasts.
✅ Focus on:
-Key Levels 🔎
-Market Structure 📐
-Risk Management 🛡️
❌ Don’t trade based on emotion or prediction.
🎯 Trade based on probability, not certainty.
👉 Let price confirm your bias — watch for clear breakouts, retests, or rejections before jumping in.
Stay patient, stay disciplined. 📈📉

NASDAQ Bearish, What's Next?Price respected Weekly's bearish imbalance to continue lower. Still price is within the weekly's context area to which is suitable to look for entries in lower timeframes targeting weekly's swing low (POI).
Once, the Weekly POI get's tagged we might look to continue to the next POI (Point of Interest). Likely, the daily swing lows.
What's Next?
Pontetial target price is 18,537.88.

