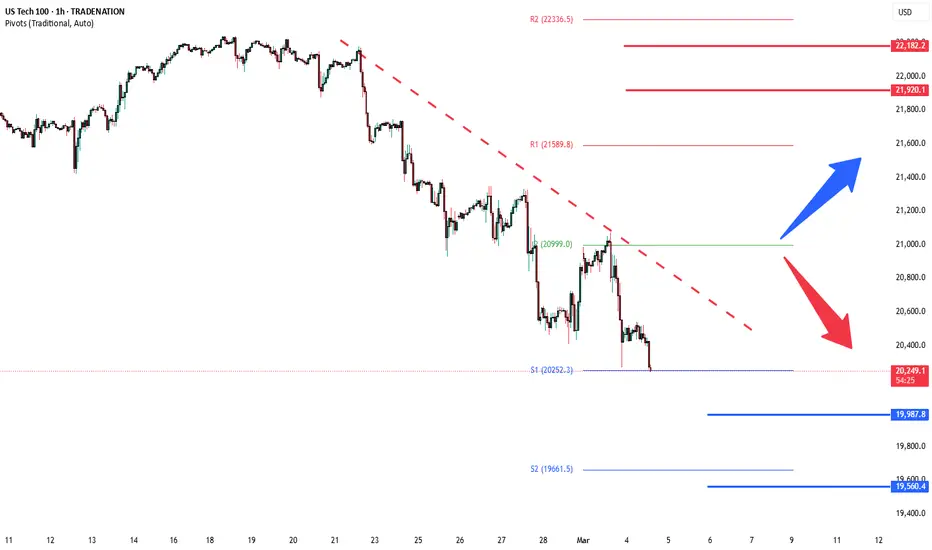
Long US100, NAS100, NASDQ, NQ - Swing PositionLong, it will hit tp in 1 week, great risk to reward trade, swing trade.
Please Note: I have BE the other trade I have open on this, I want to close it on BE and keep this position running for long.
Use proper risk management
Looks like good trade.
Lets monitor.
Use proper risk management.
Disclaimer: only idea, not advice
USTEC trade ideas

NSDQ China & Canada trigger “tariffs retaliations selloff”The tech-heavy NASDAQ dropped yesterday, underperforming the market, while the Mag-7 fell 3.09%, now down over 10% in the past two weeks. Nvidia led the decline, plunging 8.69%. The Nasdaq 100 (USTec) index maintains a long term bullish outlook supported by its long-term uptrend. However, recent price action suggests a corrective pullback following the all-time high, bringing the index to a key technical support zone.
Bullish Scenario:
The 20280 level (200-day moving average) serves as a critical support zone, aligning with the long-term rising trendline.
A pullback towards this level, followed by a bullish bounce, could reaffirm the prevailing uptrend.
Upside targets include:
21200 (key resistance)
21450 (50-day moving average)
21620 (20-day moving average)
A strong rebound from 20280 could reinforce bullish momentum and set the stage for further gains.
Bearish Scenario:
A confirmed breakdown below 20280 with a daily close beneath this level would weaken the bullish structure.
This could trigger a deeper retracement, leading to downside targets at:
19990 (next key support)
19560, if bearish pressure intensifies
A sustained loss of 20280 may indicate a broader correction, potentially shifting sentiment in favor of sellers.
Market Outlook:
The 20280 level is pivotal—holding above this support will sustain the bullish trend, while a decisive break below it could signal extended downside risks. Traders should monitor price action and volume at this critical level to gauge the market’s next move.
This communication is for informational purposes only and should not be viewed as any form of recommendation as to a particular course of action or as investment advice. It is not intended as an offer or solicitation for the purchase or sale of any financial instrument or as an official confirmation of any transaction. Opinions, estimates and assumptions expressed herein are made as of the date of this communication and are subject to change without notice. This communication has been prepared based upon information, including market prices, data and other information, believed to be reliable; however, Trade Nation does not warrant its completeness or accuracy. All market prices and market data contained in or attached to this communication are indicative and subject to change without notice.
NASDAQ SELLS Bearish Breakout (Most Probable): The price breaks down from the ascending triangle. This could involve:
Rejection at 20,486.0 followed by a break below the lower trendline of the ascending triangle.
Direct break below the lower trendline without significantly testing 20,486.0 again.
This would signal a continuation of the downtrend established by the bearish BOS.
Continued Consolidation (Less Probable, but Possible): The price might continue to trade within the ascending triangle for a bit longer. However, even in this case, the underlying bearish pressure would still favor a bearish resolution eventually.
Unexpected Bullish Breakout (Least Probable): While less probable given the bearish BOS, an unexpected bullish breakout above 20,486.0 is always possible in markets. However, for this to happen, there would need to be a significant shift in market sentiment and buying pressure to overcome the established bearish momentum. This would be considered a lower probability scenario given the current chart context.

NAS100USD Will Fall! Sell!
Here is our detailed technical review for NAS100USD.
Time Frame: 9h
Current Trend: Bearish
Sentiment: Overbought (based on 7-period RSI)
Forecast: Bearish
The market is approaching a significant resistance area 20,454.4.
Due to the fact that we see a positive bearish reaction from the underlined area, I strongly believe that sellers will manage to push the price all the way down to 19,860.0 level.
P.S
Please, note that an oversold/overbought condition can last for a long time, and therefore being oversold/overbought doesn't mean a price rally will come soon, or at all.
Like and subscribe and comment my ideas if you enjoy them!

NASDAQ Index Analysis – Daily TimeframeThe NASDAQ Index is currently in a corrective wave, and for now, it may remain range-bound in terms of time.
🔹 The key support level in the long-term timeframe is 19,800. Once the correction phase is over, the index could resume its upward movement toward 23,300.
🔹 In the medium-term, the critical level to watch is 21,200.
📈 If the correction completes, the expected growth is approximately 20%.

NAS100 - How Overbought is NASDAQ ?How I see it:
I just felt it necessary to share the bigger picture.
1) NAS100 Has been overbought since JUNE 2023.
2) Price has broken a very significant 7 Month Bullish Trend a week ago.
3) Severe 1W TF Divergence!
Keynote:
I am not stating that NAS100 will fall all the way as indicated.
It is however very peculiar if you take your FIB from where the
divergence began @ 14050.00 up to the ATH @ 22237.00.
The indicated re-balancing of the divergence falls right between
71-79% retracement.
Thank you for taking the time to study my analysis.

Nasdaq market analysis: 04-Mar-2025Good morning, traders! Welcome to today's Nasdaq market analysis. Compare my price action insights with your own charts and enhance your trading skills.

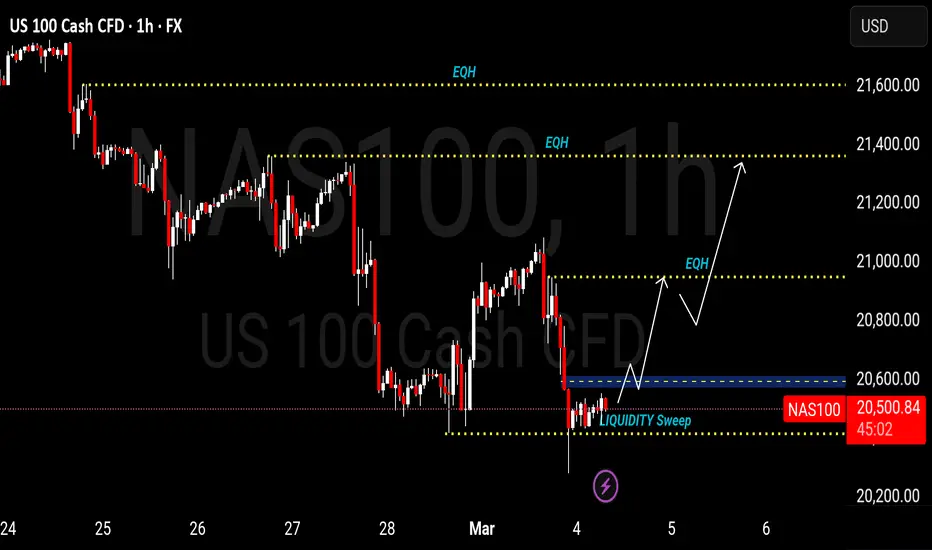
Nas100 -SMC Whether you're going short or long, these key price levels provide you with a unique advantage, helping you navigate the market with precision and make more informed decisions based on real liquidity zones and institutional activity.
Long US100, NQ, NAS100Long, it will tp in 1 week, great risk to reward trade, swing trade.
Use proper risk management
Looks like good trade.
Lets monitor.
Use proper risk management.
Disclaimer: only idea, not advice.

Technical and digital analysisWe notice that we are in a price decline and there is an increase in momentum and we are in a small correction of the price decline

Nasdaq | Long | 3HrsThis technical analysis is for informational and educational purposes only. It does not constitute financial advice. Remember to always research and consult with a professional before making investment decisions. Good luck! 📈💼🚀


Long Idea at 1h Time Frame (US100)At one hour market is making HL.
market has touched fib level 0.618
Buy at cutrent price. (20719)
Stoploss at last HL. (20426)
R:R=1:1
TP: (21012)
_____
Market is now very close to SL you can enter here as well

NAS100 Bearish (Descending Trend, DOW LLs)NAS100 Unable to sustain above previous daily high. Overall indexes are seeing sell pressure with RISK ON instruments such as AUD and NZD showing sell off. Technically, bearish trend is not broken and DOW Lower Lows (LLs) still intact. Fundamentally Indexes will remain bearish.
Trade Setup:
Entry at Previous Day High (CMP)
SL at previous LH.
TP at 1:1 and 1:2
Short IDEA for US100 At 15 Minute Time FrameMarket has touched the 0.618 Fib Level and there are chances that it goes down further.
This is a risky trade as there is no trend but chances of trend.
0.15% R:R
SL:21074
Entry: Current Price: 20852
TP: 20630

TP FILLED ON NASDAQCouple minutes ago, I posted to sell NASDAQ, and now the market reached our TP.
Follow for more trades!

SELL NASDAQGood morning Traders
I'm sharing with you one of the trades I'm taking today, we sold after that the Minor BUYSIDE LQ got swept and based on the IFVG. And our target is the Daily LQ.
Follow for more!

NasdaqMy technical analyse tell me we have a big chance to turn going back up, As we hope for the same from on our weekly fundamentals

Nasdaq 100 Analysis: February Pushes Index Below January’s OpenNasdaq 100 Analysis: February Pushes Index Below January’s Opening Price
The Nasdaq 100 (US Tech 100 mini on FXOpen) chart shows:
→ January’s opening price was around 21,085.
→ February’s closing price was around 20,867.
This marks a 1% decline since the start of the year.
A report from Goldman Sachs, published on Friday, reinforces bearish sentiment, stating that global hedge funds sold more stocks than they bought at the end of February—the largest net selling in a year, according to Reuters.
Possible reasons for market pessimism:
→ AI-related stocks may be highly overbought. For instance, the "Magnificent Seven" tech stocks have underperformed the broader market in 2025.
→ Trump’s tariff policies on global trade could have negative economic consequences.
Technical Analysis of Nasdaq 100 (US Tech 100 mini on FXOpen)
Bullish perspective: Breaking January’s low did not trigger a strong downward trend.
Bearish perspective: The price has fallen below the support line (lower blue line), which had held since autumn last year.
The market’s next move could depend on how Nasdaq 100 (US Tech 100 mini on FXOpen) behaves around the 21,030 level. Previous rebounds from this support line were weak, and bears managed to break through with effort. This suggests they may still control this zone.
Trade on TradingView with FXOpen. Consider opening an account and access over 700 markets with tight spreads from 0.0 pips and low commissions from $1.50 per lot.
This article represents the opinion of the Companies operating under the FXOpen brand only. It is not to be construed as an offer, solicitation, or recommendation with respect to products and services provided by the Companies operating under the FXOpen brand, nor is it to be considered financial advice.

Potential pullback and bearish continuationNasdaq is ranging between 22000 and 20500, and price action is currently bouncing off the 20500 support. As long as price action is above the 20500 barrier, price action may try to reignite a bullish rise towards the established highs.
Failure to continue up and settling under 20500, the indice may now be in a bigger bearish phase. However, if the price action manages to stabilise above the 21300, the indice will probably aim the 22000 barrier.

NAS100 - Nasdaq, won't it go below 20k?!The index is below the EMA200 and EMA50 on the four-hour timeframe and is trading in its medium-term ascending channel. If the index rises towards the suggested zones, we can look for the next Nasdaq sell-off.
The composition of investors’ financial assets from 1990 to 2025 reveals shifts in the allocation of equities, bonds, and cash. Currently, the share of equities in investment portfolios has reached an all-time high of 54%, indicating a growing preference for the stock market among investors.
Conversely, the share of bonds and cash has declined to 18% and 13%, respectively, suggesting reduced interest in holding fixed-income assets and liquidity. At present, more than half of investors’ financial assets are concentrated in equities, which could reflect optimism about the market’s future growth.
This situation calls for increased caution from the Federal Reserve and the Trump administration, as a significant portion of American households’ surplus income is now directed toward stocks. As a result, any downturn in the U.S. stock market could have more severe consequences for the public than before.
Scott Bassett, the U.S. Treasury Secretary, responded to a recent survey indicating that Americans want President Donald Trump to focus more on reducing inflation. He stated that he is confident consumer price inflation in the United States will decline throughout the year.
In an interview with CBS and Face the Nation, Bassett defended Trump’s economic policies, emphasizing that the president is pursuing a comprehensive approach that includes tariffs, deregulation, and a gradual reduction in energy costs.
Meanwhile, following weaker-than-expected preliminary Purchasing Managers’ Index (PMI) data for February and a decline in the University of Michigan’s Consumer Sentiment Index, investors are now pricing in approximately 60 basis points of rate cuts by the Federal Reserve for this year. This projection is 10 basis points higher than the forecasts from the December dot plot.
Market pricing indicates that traders still expect the Federal Reserve to cut interest rates in June, particularly after the release of Personal Consumption Expenditures (PCE) data. However, with Trump ramping up tariff threats against key U.S. trading partners such as China, Canada, and Mexico, outlining a clear economic roadmap has become more challenging. Tariff impositions pose a serious risk of reigniting inflation, prompting many Federal Reserve officials who have recently expressed their views to adopt a “wait and see” approach.
This week, market attention will once again turn to employment data, as investors eagerly anticipate the release of the February Non-Farm Payrolls (NFP) report. Other key events include the preliminary Consumer Price Index (CPI) estimates for the Eurozone and the ISM U.S. Manufacturing PMI on Monday, the ADP Employment Report and ISM Services PMI on Wednesday, and the weekly jobless claims data on Thursday. Additionally, the European Central Bank’s monetary policy decision on Thursday will be closely watched, with economists expecting another interest rate cut.

2022 repeating itself With all the activities taking place with Donald Trump in the USA, the war between Russia and Ukraine are we having a repeat of 2022 market downtrend.
