USTEC trade ideas
NAS100The NAS100, also known as the Nasdaq 100, is a stock market index that includes 100 of the largest non-financial companies listed on the Nasdaq Stock Market. It primarily represents technology and innovation-driven companies, such as those in sectors like technology, healthcare, consumer services, and industrials. The index is often used to gauge the performance of the tech-heavy part of the stock market. It reflects how well these companies are performing overall, but unlike other indexes, it excludes financial companies like banks and insurance firms. Investors and analysts often look at the NAS100 to track trends in the tech sector and its influence on the broader economy.
NASDAQ: Wave Analysis & Forecast for April-MayHello, traders! Let’s analyze the current wave structure of the NASDAQ index.
At the moment, there is a high probability that the index is forming wave C of a correction. Most likely, this is a horizontal expanded correction.
✅ Sub-wave 1 of wave C has already formed.
✅ Sub-wave 2 is also likely completed.
On Friday, the index showed a strong decline and closed at the day’s lows, indicating a high probability of further downside movement next week.
What’s next?
We expect the formation of the third sub-wave within wave C. Most likely:
🔻 The index will continue to decline toward 17,700, where the 38% Fibonacci level is located.
🔻 The key support zone is 17,300.
🔻 After a short correction, the decline may extend to 16,300.
🔻 In a deeper scenario – down to 15,700-15,000.
Technical factors
⚡ The price failed to break above the 200-day moving average, bounced off it, and started declining.
⚡ The next major support is the 200-week moving average, around 16,200.
⚡ Throughout April – May, the market is likely to remain in a correction phase.
Once key levels are reached, we expect a potential reversal and new highs in the second half of 2025.
Stay tuned and share your thoughts in the comments!
Us100 updateHi traders what is your opinion this week a sell or a buy,according to the strategy n my view,the target is 168 which is likely to hit n am expecting bull run to take over from this 2023 highs soo note that am positioning my self for big move,first thing this market is n uptrend market with weird n normal pull back this one was abnormal do to trade war which it's still going on,soo guys this all sell off is not a threat it is giving you a chance to ride long trades what you have to do is to generate liquidity into position n make sure you hold your trades for big rewards,before you overthink I identify the trend n find the really trend beside pull back understand what is moving n why I am going to buy,note that we are 6% away to recession do me favour invest in knowledge soo that you can be in high level of thinking and seeing things n not overthinking everything knowledge is power,I wish you all profitable week ahead.
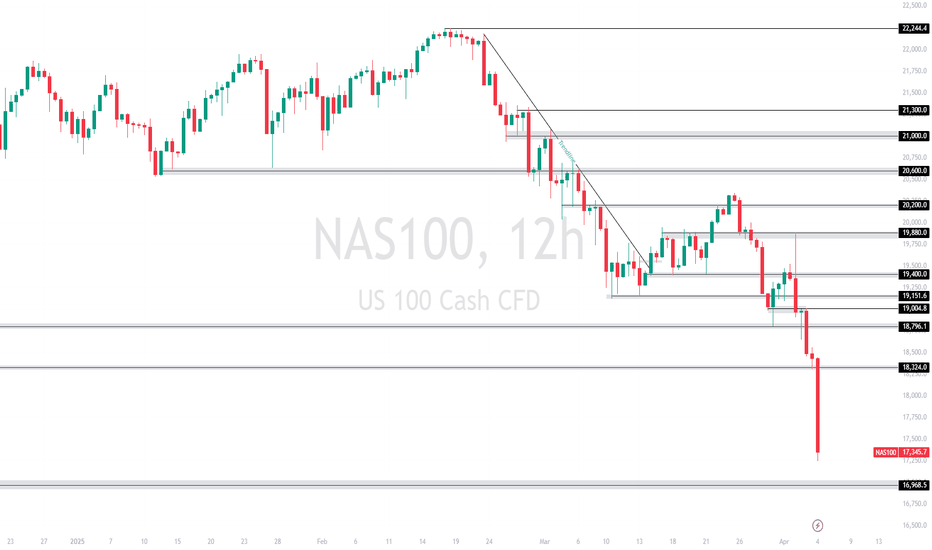
NASDAQ tanks below key levels amid new Trump tariffs!The market free-falls as Trump's new tariffs send shockwaves through global sentiment.
Sellers are piling in — but it's the fear of economic fallout that's truly fuelling this drop.
The NAS100 has broken through major support zones with strong bearish momentum.
Sellers are clearly in control, and price action shows little sign of slowing down.
Structure around 18,324 failed to hold. Next major support zone: 16,968.5.
Will the bleeding stop there?
⚠️ Reminder:
No one can predict what will happen next.
Markets react to collective psychology, news flow, and big players—not forecasts.
✅ Focus on:
-Key Levels 🔎
-Market Structure 📐
-Risk Management 🛡️
❌ Don’t trade based on emotion or prediction.
🎯 Trade based on probability, not certainty.
👉 Let price confirm your bias — watch for clear breakouts, retests, or rejections before jumping in.
Stay patient, stay disciplined. 📈📉
NASDAQ 100 SIMILARITIES WITH THE 2008 MARKET CRASH (2008 MARKET CRASH CHART )
As shown in the chart, we may now see a relief rally in equities in case Trump decides to take a step back regarding tariffs, while at the same time, the FED decides to give markets a break by messaging possibly more rate cuts this year. Although I think a relief rally is coming after this correction, we may end up in a similar technical pattern to 2008. By summer ( June-July ), equities may have a final push before breaking further below.
USTEC Sell Limit Trade Idea⏳ Expires: 02/04/2025 - 12:00
Market Outlook
A 5-wave bearish count has completed at 18,818, indicating potential downside.
The 261.8% Fibonacci extension from 20,363 to 19,765 is located at 18,796, reinforcing bearish momentum.
Equities opened higher due to an overnight positive theme, but previous support at 19,423 has now turned into resistance.
Trade Details
Entry (Sell Limit): 19,415
Stop Loss: 19,555 (-140 points)
Take Profit: 19,125 (+290 points)
Risk/Reward Ratio: 2.07:1
Key Levels
Resistance:
R1: 19,415 (Bespoke Resistance)
R2: 19,423 (Previous Support Turned Resistance)
R3: 20,636
Support:
S1: 19,157
S2: 19,124
S3: 18,796 (Fibonacci Extension Target)
Technical & Fundamental Factors
✅ Bearish 5-Wave Count Completed – Suggests potential for further downside.
✅ Fibonacci Resistance at 18,796 – Aligns with key technical levels.
✅ Previous Support Turned Resistance – 19,423 may act as a rejection zone.
⚠️ ISM Manufacturing PMI Release (01/04/2025 at 15:00) – Potential market-moving event to watch.
Disclosure: I am part of Trade Nation's Influencer program and receive a monthly fee for using their TradingView charts in my analysis.
Market Review: Full Higher Time Frame Review of NASDAQ bear runI hope this get's featured 🎯
The simplest macroeconomic review of NASDAQ you may see this year.
It's all a fib retracement. That's all I have to say for now 🔪 Share this with someone looking for a good review 💰
**Video was cut short by a minute or two but the general idea was complete
NAS100 I Potential Gap Fill and More Growth to 21,000Welcome back! Let me know your thoughts in the comments!
** NAS100 Analysis - Listen to video!
We recommend that you keep this pair on your watchlist and enter when the entry criteria of your strategy is met.
Please support this idea with a LIKE and COMMENT if you find it useful and Click "Follow" on our profile if you'd like these trade ideas delivered straight to your email in the future.
Thanks for your continued support!Welcome back! Let me know your thoughts in the comments!
NAS100 Is Bullish! Long!
Take a look at our analysis for NAS100.
Time Frame: 9h
Current Trend: Bullish
Sentiment: Oversold (based on 7-period RSI)
Forecast: Bullish
The market is on a crucial zone of demand 19,181.5.
The oversold market condition in a combination with key structure gives us a relatively strong bullish signal with goal 19,921.0 level.
P.S
We determine oversold/overbought condition with RSI indicator.
When it drops below 30 - the market is considered to be oversold.
When it bounces above 70 - the market is considered to be overbought.
Disclosure: I am part of Trade Nation's Influencer program and receive a monthly fee for using their TradingView charts in my analysis.
Like and subscribe and comment my ideas if you enjoy them!
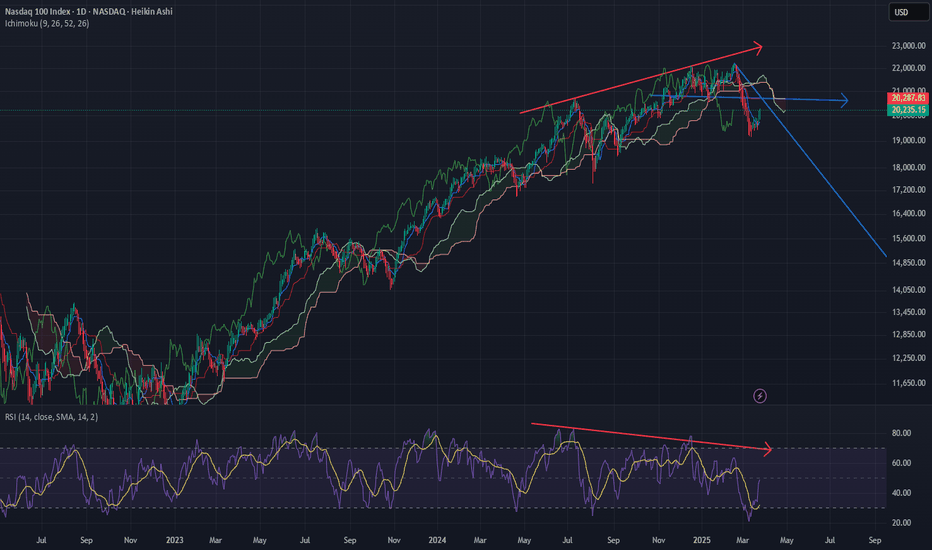
I’m keeping an eye on a potential global recession NASDAQ 100Hey everyone, here’s my quick take on the NASDAQ 100 (NDX) and why I’m keeping an eye on a potential global recession:
1. Bearish Divergence on the Chart
We’ve got the price pushing higher while the RSI is sloping lower—classic bearish divergence. It’s a big red flag that momentum isn’t matching price action. Sure, it doesn’t guarantee a drop, but it definitely makes me cautious about chasing new highs.
2. Rising Wedge / Channel
The trendlines I’ve drawn suggest a rising wedge or narrowing channel. Those often break to the downside if buyers can’t keep the momentum going. I’m watching that lower boundary like a hawk—if we close below it, that’s usually a bearish signal.
3. Ichimoku Cloud Levels
We’re still hanging around the top of the Cloud, which means the longer-term trend isn’t totally broken yet. But if price falls into the Cloud or below it—and the Tenkan-sen crosses under the Kijun-sen—that’s another sign that sellers might be taking control.
4. RSI Confirmation
The RSI is showing that classic lower high pattern, which means the market’s losing steam. A drop below typical support ranges on the RSI (like 40-50) would back up the idea of a deeper pullback or correction.
5. Macro Picture & Recession Risks
The NASDAQ 100 is a pretty good indicator of market sentiment, especially for big tech. If we see a bigger breakdown here, it might hint at broader economic weakness. Combine that with ongoing concerns about inflation, interest rates, and global supply issues, and we have a recipe for recession chatter to get louder. I’m not saying it’s a done deal, but the chart is telling me to stay on my toes.
Bottom Line
Yes, the chart is flashing bearish signals, and the macro environment is still uncertain. If we break below key support levels, it could be the start of a bigger downtrend—potentially lining up with a global economic slowdown.
Bulls shouldnt fight this fallI have explained everything on the chart....can't be bullish for the time being, except for some rallies in a downfall....Whales will step where JPow said the famous words, Inflation is no longer transitory....Honestly the sooner we get here, the better....but it could take a few weeks or by the middle of this year.....if the market goes again back up for a double top, the fall will be even more painful.....but markets are all about creating maximum pain for bulls and bears....


