NAS100 Will Move Lower! Sell!
Here is our detailed technical review for NAS100.
Time Frame: 45m
Current Trend: Bearish
Sentiment: Overbought (based on 7-period RSI)
Forecast: Bearish
The market is trading around a solid horizontal structure 18,546.2.
The above observations make me that the market will inevitably achieve 18,341.2 level.
P.S
Please, note that an oversold/overbought condition can last for a long time, and therefore being oversold/overbought doesn't mean a price rally will come soon, or at all.
Disclosure: I am part of Trade Nation's Influencer program and receive a monthly fee for using their TradingView charts in my analysis.
Like and subscribe and comment my ideas if you enjoy them!
USTEC trade ideas

Hanzo | Nas100 15 min Breaks – Will Confirm the Next Move🆚 Nas100 – Hanzo’s Strike Setup
🔥 Timeframe: 15-Minute (15M)
———————
☄️ Main Focus: Bullish Breakout at 18700
We are watching this zone closely.
📌 If price breaks with high volume, it confirms Smart Money is in control, and a strong move may follow.
☄️ Main Focus: Bearish Breakout at 18400
We are watching this zone closely.
📌 If price breaks with high volume, it confirms Smart Money is in control, and a strong move may follow.
———
Analysis
👌 Bearish Signs (15M TF):
• Liquidity Grab + CHoCH at 18700
• Liquidity Grab + CHoCH at 18400
• Strong Rejections seen at:
➗ 18400 – Major support
➗ 19000 – Proven resistance
———
🩸 Key Zones to Watch:
• 18700 – 🔥 Bearish breakout level
• 19130 – Strong resistance (tested 6 times)
• 18400 – Equal lows
• 3245 – Equal highs
———
🩸No rush. Only precision.
Hanzo moves in silence—then strikes with force.
🔻 Every warrior needs a tribe.
Follow Hanzo. Support the path.

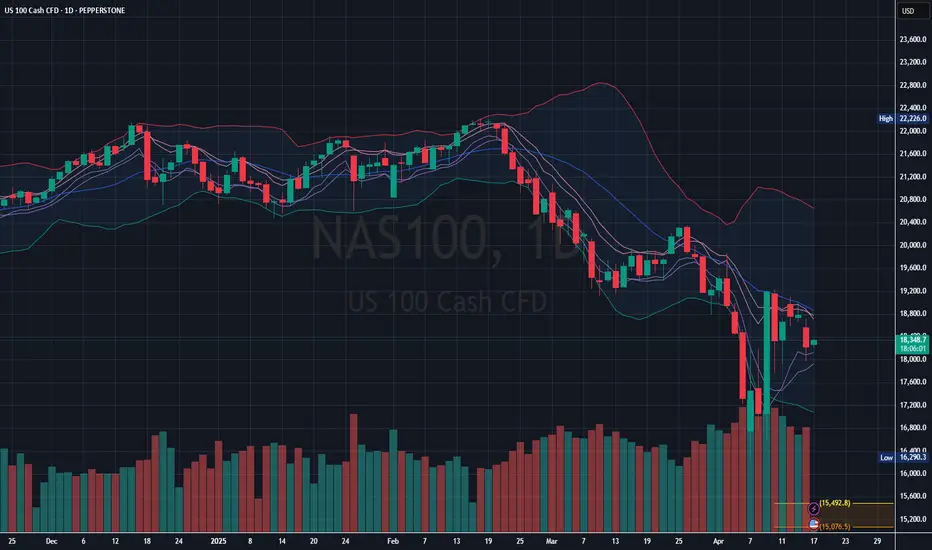
Oversold but Not Safe – NAS100 Bears Still in Control
Currently trading below the 20-day SMA (middle of Bollinger Bands), indicating bearish momentum.
Support zone: ~17,600 (recent lows and high volume area)
Resistance zone: ~18,800–19,200 (middle Bollinger Band & recent highs)
Failure to break above 18,800 and another test of 17,600 could lead to continuation downward, possibly toward 17,000–16,800.
Nas100 Buyside Rally Towards target is Pending.Nasdaq is looking to target the buyside and it will rally soon within a 2 days and it will target it faster than anything

Exclusive Analysis: Key Reversal Zones & Time Targets for NAS100Dear Trader,
I’m excited to share my latest analysis of $Subject with you! This report uses advanced mathematical strategies to pinpoint potential market reversals—both in price and timing—to help you trade smarter.
What’s Inside?
✅ Price Targets: Clear horizontal lines mark key support/resistance levels (north/south targets).
✅ Timing Tools: Vertical lines highlight potential reversal times (UTC+4 time zone) with +/- 1-2 candle accuracy.
✅ Actionable Tips: Monitor the 5M/15M charts for high-probability reversal signals like:
Doji
Double Top/Bottom
Bullish/Bearish Engulfing
Hammer/Inverted Hammer
Morning/Evening Star
Shooting Star
Triple Top/Bottom
Want to Level Up?
Join Shunya Trade’s Mentoring Program to master these strategies and sharpen your technical analysis skills.
Your Feedback Matters!
Let me know how this analysis works for you—your insights will shape future reports!
Let’s navigate the markets together—wisely and proactively.
Best regards,
Shunya Trade
Stay Connected for More:
👉 Follow me on TradingView “shoonya0000” for daily charts, tips, and live market updates.
On the chart numbers are printed those are for Reversal of Time
328, 391, 400, 463, 424, 472, 535, 295, 520, 319, 544
And these are Key price levels
Bear. Bull
18694.55 18733.46
18679.82 18748.22
18645.66 18782.46
18577.45 18851.05
18509.36 18919.76
18441.40 18988.60
18373.56 19057.56
18305.85 19126.65
18238.27 19195.86
18170.80 19265.20
17902.21 19543.79
17635.61 19824.39
17371.01 20106.99
17108.41 20391.59
16847.81 20678.19
16589.21 20966.79
16332.62 21257.38
16078.02 21549.98
⚠️ Disclaimer: This post is educational content and does not constitute investment advice, financial advice, or trading recommendations. The views expressed here are based on technical analysis and are shared solely for informational purposes. The stock market is subject to risks, including capital loss, and readers should exercise due diligence before investing. We do not take responsibility for decisions made based on this content. Consult a certified financial advisor for personalized guidance.

Nasdaq insights: 16-APRIL-2025Good morning, traders! As a seasoned price action trader, I'll share my Nasdaq insights to help you improve your trading skills.

NASDAQ H9 IdeaPotential for a bullish pullback on the NASDAQ H9 which could lead to a price movement towards the resistance level at 20100. BUY levels from 18550


NASDAQ Best 2 Places For Buy Cleared Now , Don`t Miss It !Here is my opinion on NASDAQ And for who want to buy it , here is my best 2 places for buy , First One if we have a 4H Closure Above This Strong Res that pushed the prices yesterday 500 pips , and second place will be the support that clear in the chart , but i prefer the first one cuz it will be a strong confirmation if we have a good closure above .
This Is An Educational + Analytic Content That Will Teach Why And How To Enter A Trade
Make Sure You Watch The Price Action Closely In Each Analysis As This Is A Very Important Part Of Our Method
Disclaimer : This Analysis Can Change At Anytime Without Notice And It Is Only For The Purpose Of Assisting Traders To Make Independent Investments Decisions.

Bearish StructureThe NASDAQ price action shows a clear bearish Elliott Wave structure, currently unfolding a 1-2-3-4-5 pattern. Price is in the corrective wave 4, potentially reversing around the 19,371.9 area, which overlaps with a previous supply zone.
From the local high at 19,508.1, bearish momentum has increased, and we expect one final leg down toward wave 5, targeting the 19,053.1 level or even the extended 18,920 (200% Fibonacci) zone.
Key levels:
Resistance: 19,371.9
Support: 19,053.1 and 18,920
Potential strategy:
Watch for a clear rejection around 19,370–19,400 to enter short positions targeting 19,050 or 18,920. Confirm with price action.

NASDAQ Potential UpsidesHey Traders, in today's trading session we are monitoring NAS100 for a buying opportunity around 19250 zone, NASDAQ is trading in an uptrend and currently is in a correction phase in which it is approaching the trend at 19250 support and resistance area.
Trade safe, Joe.
NQ: Crumbs left to the upsideGood day!
Following the weekly analysis, here are possible movements for the next few sessions.
As I mentioned few times now, there is still small room left to the upside followed by a consolidation before resuming the down trend with the beginning of Wave 3 and its Initial Swing.
Price has already made a new HH. Price might continue up without making a new HL. But I see a HL first. GL!

It's all about TIME FRAME.For some, this seems a concept to understand...
Yes, you can be BOTH bullish and bearish stock markets at the same time.
It's all about TIME FRAME.

Lesson 10: Nas-Daq100 Wick trading analysisAnalyzing Nas 100 trading strategy using wicks as a point of entry.

Technical Breakdown on US100 | 1H TimeframeHere’s the detailed breakdown of the US100 1H Chart based on Volume Profile, Gann analysis, and custom indicators (CVD + ADX):
1. Key Observations (Volume, Gann & CVD + ADX Focused)
a) Volume Profile Insights:
Value Area High (VAH): 19,383
Value Area Low (VAL): 19,220
Point of Control (POC): 19,291.79
High-volume nodes: Clustered around 19,220 to 19,300 (heavy acceptance).
Low-volume gaps: Above 19,400 and below 19,200 — price can accelerate through these zones.
b) Liquidity Zones:
Stop clusters likely at: Above 19,400 (recent swing highs). Below 19,200 (recent breakout area).
Order absorption zones: Around 19,291 (POC) and 19,220 (high bid absorption).
c) Volume-Based Swing Highs/Lows:
Swing High: 19,382 (testing resistance with moderate volume).
Swing Low: 19,220 (breakout launch pad).
d) CVD + ADX Indicator Analysis:
Trend Direction: Uptrend
ADX Strength: ADX > 20 and DI+ > DI-, confirming strong bullish momentum.
CVD Confirmation: Rising CVD + bullish candles = Strong demand and genuine buying pressure.
2. Support & Resistance Levels
a) Volume-Based Levels:
Support: 19,291.79 (POC) 19,220 (VAL & previous demand zone)
Resistance: 19,382-19,400 (current tested highs and potential breakout point)
b) Gann-Based Levels:
Recent Gann Swing High: 19,382
Recent Gann Swing Low: 19,220
Key retracements: 1/2 level: 19,301 1/3 level: 19,274 2/3 level: 19,328
3. Chart Patterns & Market Structure
a) Trend:
Strong Bullish (confirmed by rising ADX and CVD).
b) Notable Patterns:
Ascending Channel: Clear uptrend with higher highs and higher lows inside the purple channel.
Breakout retest: POC retest around 19,291 before moving higher.
No major topping signals yet — still holding structure.
4. Trade Setup & Risk Management
a) Bullish Entry (If CVD + ADX confirm uptrend):
Entry Zone: 19,290–19,310 (near POC support zone)
Targets: T1: 19,400 (swing high breakout) T2: 19,500 (measured move from channel)
Stop-Loss (SL): 19,220 (below VAL and previous swing low)
RR: Minimum 1:2
b) Bearish Entry (If CVD + ADX confirm downtrend):
Entry Zone: 19,380–19,400 (at resistance failure)
Target: T1: 19,290 (POC retest)
Stop-Loss (SL): 19,450 (above resistance breakout trap)
RR: Minimum 1:2
c) Position Sizing:
Risk only 1-2% of trading capital per trade.

Nasdaq market analysis: 28-APRIL-2025Good morning. Welcome to today's Nasdaq market analysis and educational insights for price action traders.

Gold Vs. Nasdaq, since 2022Fairly clear here that Gold and Nasdaq correlated in direction until December 2024, at which time the equities market peaked. The two continued to correlate in trend direction until February, where, after several years divergence finally occurred.
Gold continues upward, equities continue lower. This seems to be a clear indication that equities, in this case the Nasdaq, will continue into downward correctional territory while Gold continues into a positive trending direction.

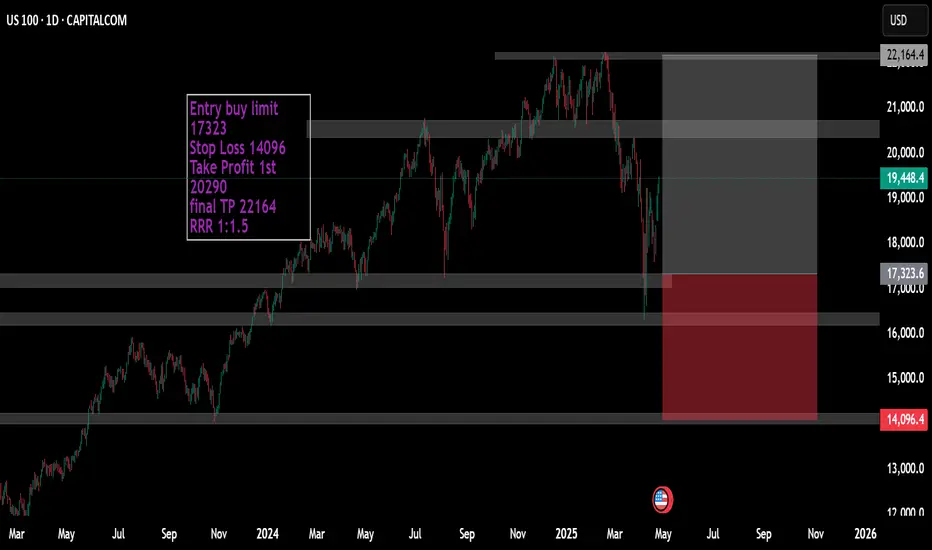
Is a reversal about to happen?Hello, traders
Orange circles highlight repeated price rejection and the formed doji that suggests a slowdown in a bullish wave and potential reversal. The confluence of the descending trendline and horizontal supply/resistance zone creates a high-probability reversal or breakout from this triangle.
If the price rejects again from the current supply zone and triangle, short setup toward the Fibonacci retracements or demand zones (18300 and below).
If the price breaks above the descending trendline, bullish continuation will likely target 20,000+ (Swing H).
Trend remains down.
Entry 19300
TP 18300 below
Target 14k.

Nas 100 outlookBullish overall for the price to create a new weekly high this week. How the monthly candle will close will dictate terms as to the outlook of the next month's PA

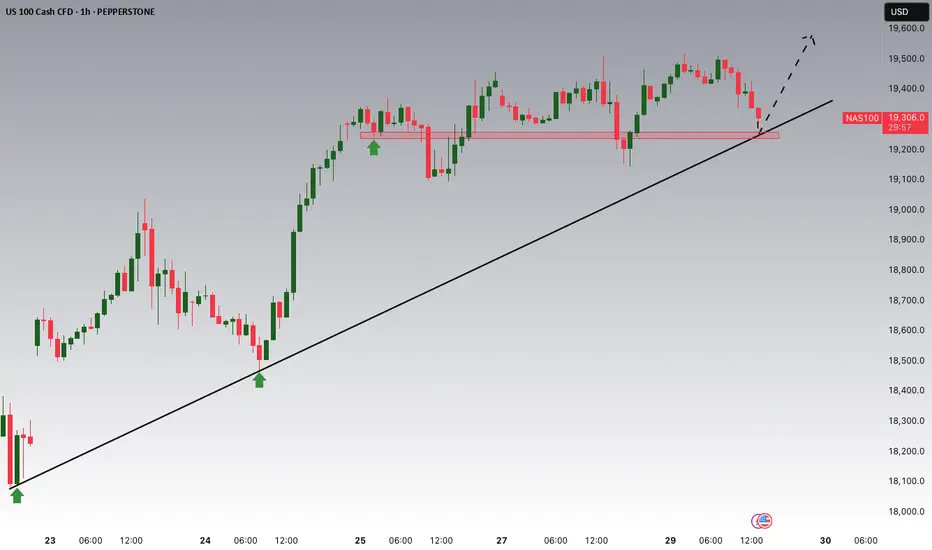
Trendline break out NAS100## Entry
- Enter on 4H confirmed trendline breakout
- Look for retest of broken trendline as support
- Ensure price remains above key MAs on 4H
- Verify with increased volume on breakout
## Risk
- Stop below recent swing low/structure
- Risk 1-2% capital
- Size position accordingly
## Targets
1. 20000- 20200 as psychological level
2. 200 MA on daily timeframe
3. 1.5x risk-reward ratio
## Management
- Wait for clean 4H breakout confirmation
- Move stop to breakeven after momentum continues
- Trail stop as price advances toward targets
- Scale out at major resistance levels

NQ: Upcoming Weekly Analysis!FA Analysis:
1- Earnings season: In my view, it's irrelevant in terms of the data itself! It reflects the pre-tariffs era. Market is always looking forward. However, it gives market the opportunity for a relief, consolidation and rebalancing. So beside the kneejerk reaction, uncertainty is in the driver seat.
2- Trump's policies: The 90-day pause has a big chance to become an Eternity pause. Cracks inside Trump's team about the impacts of these tariffs on their own corporations will make them fleeing Trump's boat. Hence, the rational supporting the Eternity pause. This said, we'll see many tweets highlighting how much Trump is winning to feed his mindset.
3- Key economic data: Economic data will take over the driver seat. Recession and Inflation are the key data for market. Bad data is bad for Equities and vice-versa.
4- FED: Rate cut has increased probability during the next meeting, but for the wrong reasons. Both Trump and market will continue their pressure on the FED. This pressure is translated via Sell-off of stocks and equities.
5- Risk: Beside the uncertainty context, I think agreements between Iran-USA and Ukraine-Russia are underway. This is positive for equities. Gold is your indicator in this front.
TA Analysis:
Weekly TF:
- Not much to update from two weeks ago analysis! Price is in its way to complete Wave 2. Crumbles left.
- Price broke out and closed above the 90-day pause weekly/daily candle. This tells you a continuation up is expected but not too much left in the upper side.
- Economic Data will drive the move. This might last 1-2 weeks.
Daily TF:
- Green daily close with a small size candle.
- A consolidation period is expected to end this Wave 2. So there is no rush to jump in the sell side to catch the top of Wave 3. Here is a good opportunity for swing position that you can build incrementally as the price creates LL from lower TF up to Daily and Weekly TF.
GL!

Price breaking out of a wyckoff balance to go unbalanceMy approach the market was pointing out market had found a balance zone starting on April 9th- today. Today I notice high volume on the bull side towards one of the resistance points which it broke and retraced. One it started to retrace I went to the smaller time frame to look for a sniper entry( 5min bullish and strong delta candle stick rejecting of a low volume node and the session vwap ). The balance zone was $1450 wide so it should go imbalance for the same amount or close. This trade is really a 25rr but im going for 8rr to pass my 2nd phase in my challange. This trade will not hit instill like Wednesday maybe even to the end of next week.
