US CRUDE OIL(WTI): Price Action Trading📈USOIL may experience a reversal from an important daily support level.
The formation of a cup & handle pattern and a breakout above its neckline on a 4-hour chart suggest that the price is likely to rise.
The target price is 68.50.
WTI trade ideas

USOIL at Critical Support – Rebound Toward 73$?TVC:USOIL has reached a major demand zone, an area that has historically acted as strong support. This region has previously triggered sharp rebounds, making it a key level to watch for a potential bullish reaction.
The recent sell-off has pushed the price deep into this zone, and early signs of rejection could indicate that buyers are stepping in. If support holds, we could see a recovery toward $73, aligning with a corrective move.
However, if price fails to hold and breaks decisively below this zone, it would signal continued weakness, opening the door for further downside, possibly targeting the next support area.
Traders should wait for confirmation, such as bullish price action, increased buying volume, or key reversal patterns before committing to long positions.

OIL Testing 6 Month LowOIL Testing 6 Month Low
OIL Analysis Yesterday, OIL tested a very strong area dating back six months to September 10, 2024. OIL reached $65 per barrel after a long time.
The market reaction was strong, pushing the OIL price up again to $67.3, an increase of nearly 1.7%.
Impact of U.S. Tariff Policy The uncertainty around U.S. tariff policy is creating concerns about demand growth, while major producers are set to increase output. However, this is not pushing oil prices down at the moment.
It looks like we could see a short-term bullish recovery before it moves down again. The liquidity near $65 should have been high as long as it is rising.
You may find more details in the chart!
Thank you and Good Luck!
❤️PS: Please support with a like or comment if you find this analysis useful for your trading day❤️

USOIL Bearish Momentum - Will It Reach 64.40?TVC:USOIL has broken below a key support zone, which has now flipped to resistance, aligning with a potential bearish continuation. The recent retest of this level held successfully, indicating strong seller interest and reinforcing the bearish outlook.
With momentum favoring the downside, the next logical target is 64.40, aligning with the prevailing bearish trend. As long as the price remains below the resistance zone, the bearish bias stays intact.
If you have anything to add or a different perspective, I’d love to hear from you in the comments!

Hellena | Oil (4H): SHORT to the area of 64.00 (Wave C).Colleagues, at the moment we see a situation where it is difficult to determine the end of the movement. Wave “C” is not completed and I believe that we should expect the continuation of the downward movement. I do not set distant targets, so I expect the price to reach the area of 64.00.
A correction to the area of 67.884 shift is possible.
Manage your capital correctly and competently! Only enter trades based on reliable patterns!

$CL_F: Oil forecastIt looks like energy is going to get cheaper after all, over time this can result in stimulus for the economy as prices fall, once they've fallen enough. The effect will be felt with some lag lasting a few months though.
Best of luck!
Cheers,
Ivan Labrie.

Oil bullish scenarioOil is on a big test in the $68.50 zone. With a break above, the chances for a retest of the $70.00 level increase. A little higher in the $71.00 zone, the EMA 200 moving average is approaching, which was an obstacle to further oil price recovery on the previous two occasions.

USOIL Potential UpsidesHey Traders, in today's trading session we are monitoring USOIL for a buying opportunity around 66 zone, USOIL is trading in an uptrend and currently is in a correction phase in which it is approaching the trend at 66 support and resistance area.
Trade safe, Joe.

USOIL Potential DownsidesHey Traders, in today's trading session we are monitoring USOIL for a selling opportunity around 68 zone, USOIL is trading in a downtrend and currently is in a correction phase in which it is approaching the trend at 68 support and resistance area.
Trade safe, Joe.

OIL DOWN TREND SOONThe chart shows WTI Crude Oil (CFDs) on a 1-hour timeframe. The price is currently facing resistance near 67.50, with a recent pullback towards the support level at 65.82. An order block is indicated around the 67.00 mark, suggesting a potential move down to the target of 65.82. Traders may look for confirmation of a downward movement for potential short entries.

WTI OIL Massive 4-year Support hit. Bullish reversal ahead??WTI Oil (USOIL) hit on last week's 1W candle the 1M MA100 (red trend-line), a massive long-term Support level that has been holding since the week of April 26 2021, i.e. almost 4 years.
At the same time, the price entered the 2-year Support Zone, which has produced all major Bullish Phases (green Rectangles) during this time span. The last one got rejected twice on the 1W MA200 (orange trend-line).
Given the fact that this most recent rejection formed the current 2-month Bearish Phase (red Rectangle), which even based on 1W RSI terms, is similar to all previous Bearish Phases that found Support on the 2-year Support Zone, we have a massive long-term Support Cluster in front of us.
Naturally, until the 1W MA200 breaks, that should be the first Target of any buy attempts. As a result, we expect $80.00 to be tested by June 2025 the earliest.
-------------------------------------------------------------------------------
** Please LIKE 👍, FOLLOW ✅, SHARE 🙌 and COMMENT ✍ if you enjoy this idea! Also share your ideas and charts in the comments section below! This is best way to keep it relevant, support us, keep the content here free and allow the idea to reach as many people as possible. **
-------------------------------------------------------------------------------
Disclosure: I am part of Trade Nation's Influencer program and receive a monthly fee for using their TradingView charts in my analysis.
💸💸💸💸💸💸
👇 👇 👇 👇 👇 👇

WTI CRUDE OIL: 4H Channel Down targeting 64.00WTI Crude Oil is almost oversold on its 1D technical outlook (RSI = 33.014, MACD = -1.680, ADX = 27.887) but on the lower 4h timeframe its formed a Channel Down that just completed a peak formation. This indicates that it is ready for its next bearish wave, with the previous two registering -6.55% declines. The trade is short, TP = 64.00.
## If you like our free content follow our profile to get more daily ideas. ##
## Comments and likes are greatly appreciated. ##

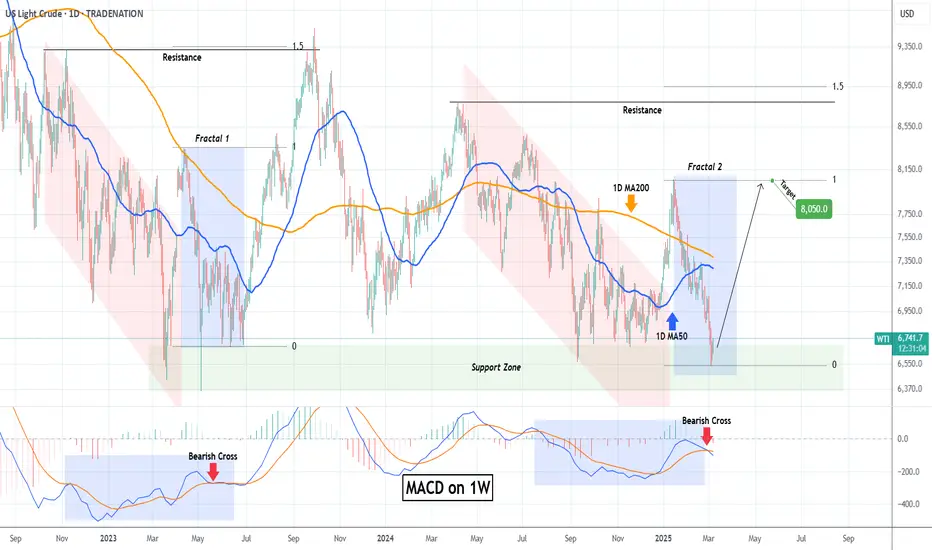
WTI OIL hit its 2-year Support. Major rebound possible.WTI Oil (USOIL) didn't fail us on our last bearish idea (February 20, see chart below), where we called the 1D MA50 rejection:
The decline didn't just hit our $69.00 Target but also broke below the medium-term Channel Up and entered the 2-year Support Zone.
The long-term dynamics should gradually start emerging now and the principle parameter is that every time this Support Zone gets hit, WTI starts strong medium-term rallies.
Technically (even on 1W MACD terms), the decline since mid January is very similar with the one of mid April 2023. Both were produced after another Support Zone rebound and before that a long-term Channel Down (red) preceded them.
As a result, we expect a strong rebound for at least the next 2 months, which (as in the case of Fractal 1) should initially target at least January's High at $80.50.
-------------------------------------------------------------------------------
** Please LIKE 👍, FOLLOW ✅, SHARE 🙌 and COMMENT ✍ if you enjoy this idea! Also share your ideas and charts in the comments section below! This is best way to keep it relevant, support us, keep the content here free and allow the idea to reach as many people as possible. **
-------------------------------------------------------------------------------
Disclosure: I am part of Trade Nation's Influencer program and receive a monthly fee for using their TradingView charts in my analysis.
💸💸💸💸💸💸
👇 👇 👇 👇 👇 👇
USOIL RETEST TRADE READ CAPTIONhellloo traders what do you think about USOIL
current price 66.20
USOIL work in support area and USOIL nothing breakout low and resistance (3 time) he rejected support area and pump upside I think USOIL again touching support area and taking support to jump upside when USOIL breakout 68.00 then he more go to upside to touching demand zone
Support area 66.00-65.400
Resistance 68.00
Target 70.30
Please don't forget to like comments and follow thank you

WTI Price Analysis: Key Insights for Next Week Trading DecisionMarket Overview:
📉 WTI at $66.00: Trading defensively near a three-year low amid tariff concerns and OPEC+ output hikes.
📊 Inventory Build: A larger-than-expected US crude inventory build (up by 3.614M barrels vs. a forecasted decline) is adding pressure on prices.
⚖️ Tariff Uncertainty: Despite Trump's recent executive order exempting goods from Canada and Mexico under USMCA, overall tariff uncertainty remains a key concern.
🔺 OPEC+ Output Increase: For the first time since 2022, OPEC+ has ramped up production, weighing further on WTI.
Technical Insights:
📉 Descending Channel: The 4H chart shows a clear descending channel. Watch for the potential break of the channel's resistance line to the upside.
🎯 Key Level: Next week, the critical level to monitor is $66.50 – consider a buy if prices break above, and sell if they remain below.
Upcoming Catalysts:
⏰ US Employment Data: Keep an eye on the Consumer Price Index, Producer Price Index, Michigan Consumer Sentiment Index, EIA and API report. A weaker-than-expected report could lift the USD and boost oil prices.
Stay Tuned:
I'll provide a detailed update at the beginning of next week. Follow along for more insights and actionable trading strategies!
#WTI #CrudeOil #OilTrading #OilMarket #CommodityTrading #EnergyMarket #OilPrice #MarketAnalysis #TradingInsights #OPEC
Happy trading!
Disclaimer:
Forex and other market trading involve high risk and may not be for everyone. This content is educational only—not financial advice. Always assess your situation and consult a professional before investing. Past performance doesn’t guarantee future results.

USOIL BUY PositionChart and lines talk to you...
Manage your risk...
R/R4 or more...
Do you think does it worth to risk on this position??

WTI, Double Bottom with Bullish DivergenceDouble Bottom Formation
Taking Support and Major Support Level
Bullish Divergence
Today US CPI data is IMP to trigger this Bullish Move
Entry @ CMP
SL Below Double Bottom
Tp at mentioned area

USOIL BUY!!!Hello friends
Given that the price has reached good support, we now see that the price has made a good comeback...
We can enter the trade with capital and risk management and move towards the specified goals.
*Trade safely with us*

USOIL: Will oil prices continue to fall? Can I buy it?Dear trader friends, are you still curious whether you can buy USOIL or continue to short USOIL? Listen to Jack's opinion.
USOIL: At present, oil prices have rebounded slightly under the situation that the United States has restricted Iraq's oil exports. The current price is 66.7. At present, the New York market has not opened. It is expected that after the opening of the market, the oil price will further increase. The demand for oil in the market has increased, and the supply is insufficient. Therefore, it is expected that oil prices will rise in the short term. So it is my idea to go long on USOIL now.
Buy at 66-66.5. tp67.5-68. sl65.5
Personal thoughts, for reference only. If you follow my signals or refer to my suggestions, remember to pay attention to the real-time notifications within the analysis circle. Convenient for subsequent operations or closing positions.

WTI CRUDE OIL: Major bullish signal on 1W.WTI Crude Oil turned oversold on its 1D technical outlook (RSI = 30.839, MACD = -1.280, ADX = 30.692) as it entered the 2 year S1 Zone. This is where all major rebounds took place. In the meanwhile a 1W RSI below 40.000 (like now) has been the strongest buy signal in the same period of time. Buy and target the LH Zone (TP = 76.00).
## If you like our free content follow our profile to get more daily ideas. ##
## Comments and likes are greatly appreciated. ##

Trump Goes "The Peacemaker", as Crude Oil Turns Gradually LowerThe notion that crude oil prices might decrease due to an abatement of the Ukraine's war not seems to be counterintuitive, as the conflict has historically led to increased oil prices due to supply disruptions and geopolitical tensions.
There are several factors that could contribute to a decrease in oil prices if tensions were to ease.
Factors Contributing to Decreased Oil Prices:
Easing of Sanctions on Russia: If tensions between the U.S. and Ukraine were to ease, it might lead to a relaxation of sanctions on Russia, potentially allowing more Russian oil to enter the global market. This increase in supply could help reduce prices.
Market Perception of Reduced Conflict: The market might perceive a decrease in conflict as a sign of reduced risk to global oil supplies, leading to lower prices. This perception could be influenced by expectations of increased oil availability from Russia and other regions.
OPEC Production Increases: If OPEC decides to increase production, as it has recently done, this could add more oil to the market, further pressuring prices downward.
Global Economic Concerns: Economic slowdowns or concerns about global growth can reduce demand for oil, leading to lower prices. The Ukraine conflict has contributed to economic uncertainty, and its abatement might not necessarily increase demand if global economic concerns persist.
Fundamental considerations
Well, in early March 2025, oil prices fell due to a combination of factors, including tensions between the U.S. and Ukraine and OPEC's decision to gradually increase output. Brent crude fell to around $71.08 per barrel, and WTI to about $68.01 per barrel.
Impact of Sanctions: Despite sanctions not directly targeting Russian oil, they have affected its exports by limiting financing and causing some buyers to avoid Russian crude. Easing these sanctions could increase Russian oil exports, potentially lowering global prices.
Market Dynamics: The war in Ukraine initially caused oil prices to surge due to supply concerns. However, if the conflict were to abate, market dynamics could shift, leading to decreased prices as supply risks diminish and global economic factors come into play.
Post war challenge
Crude oil and gasoline prices today are moderately lower, but crude oil tends to breakthrough a long-term 3 - to - 4 years low.
Crude oil prices are under pressure as US tariff uncertainty weighs on the outlook for energy demand.
Also, ramped-up Russian oil exports boost global supplies and are negative for prices.
In addition, crude prices have some negative carryover from Wednesday when weekly EIA crude inventories rose more than expected to a 7-month high.
Conclusion
In summary, while the Ukrainian war has historically driven oil prices up due to supply disruptions and geopolitical tensions, an easing of tensions could lead to decreased prices through increased supply, reduced market risk, and global economic factors.
--
Best 'Peacemaking' wishes,
@PandorraResearch Team 😎

OIL Could Test 66, Bearish Trend Is IntactOIL Could Test 66, Bearish Trend Is Intact
Technical Analysis: The price may rise to test the broken structure zone near 68.70 before potentially moving downward again. The first support zone is anticipated at 67.10, with a lower support level at 66.00.
Oil prices declined for a third consecutive session as major producers' plans to increase output in April, along with concerns over U.S. tariffs on Canada, Mexico, and China, dampened investor sentiment and raised fears of slowed economic and fuel demand growth. - as reported by Reuters.
You may find more details in the chart!
Thank you and Good Luck!
❤️PS: Please support with a like or comment if you find this analysis useful for your trading day❤️

WTI Oil H4 | Overhead pressures remain in place?WTI oil (USOIL) is rising towards an overlap resistance and could potentially reverse off this level to drop lower.
Sell entry is at 68.46 which is an overlap resistance that aligns with the 38.2% Fibonacci retracement.
Stop loss is at 70.70 which is a level that sits above the 61.8% Fibonacci retracement and a multi-swing-high resistance.
Take profit is at 65.20 which is a swing-low support.
High Risk Investment Warning
Trading Forex/CFDs on margin carries a high level of risk and may not be suitable for all investors. Leverage can work against you.
Stratos Markets Limited (www.fxcm.com):
CFDs are complex instruments and come with a high risk of losing money rapidly due to leverage. 63% of retail investor accounts lose money when trading CFDs with this provider. You should consider whether you understand how CFDs work and whether you can afford to take the high risk of losing your money.
Stratos Europe Ltd (www.fxcm.com):
CFDs are complex instruments and come with a high risk of losing money rapidly due to leverage. 63% of retail investor accounts lose money when trading CFDs with this provider. You should consider whether you understand how CFDs work and whether you can afford to take the high risk of losing your money.
Stratos Trading Pty. Limited (www.fxcm.com):
Trading FX/CFDs carries significant risks. FXCM AU (AFSL 309763), please read the Financial Services Guide, Product Disclosure Statement, Target Market Determination and Terms of Business at www.fxcm.com
Stratos Global LLC (www.fxcm.com):
Losses can exceed deposits.
Please be advised that the information presented on TradingView is provided to FXCM (‘Company’, ‘we’) by a third-party provider (‘TFA Global Pte Ltd’). Please be reminded that you are solely responsible for the trading decisions on your account. There is a very high degree of risk involved in trading. Any information and/or content is intended entirely for research, educational and informational purposes only and does not constitute investment or consultation advice or investment strategy. The information is not tailored to the investment needs of any specific person and therefore does not involve a consideration of any of the investment objectives, financial situation or needs of any viewer that may receive it. Kindly also note that past performance is not a reliable indicator of future results. Actual results may differ materially from those anticipated in forward-looking or past performance statements. We assume no liability as to the accuracy or completeness of any of the information and/or content provided herein and the Company cannot be held responsible for any omission, mistake nor for any loss or damage including without limitation to any loss of profit which may arise from reliance on any information supplied by TFA Global Pte Ltd.
The speaker(s) is neither an employee, agent nor representative of FXCM and is therefore acting independently. The opinions given are their own, constitute general market commentary, and do not constitute the opinion or advice of FXCM or any form of personal or investment advice. FXCM neither endorses nor guarantees offerings of third-party speakers, nor is FXCM responsible for the content, veracity or opinions of third-party speakers, presenters or participants.
