Silver USM2 Projections: 2032As we see USM2 Expand along this exponential line we can project around $33 trillion USDM2 around 2032. Silver, which is currently undervalued relative to many assets may fall again against M2, or rise. It seems to have hit resistance currently. Here I have outlined three scenarios:
Red: Silver falls against M2, but is nominally higher by 2032 at $43 an ounce.
Orange: Silver meets resistance again along this line at $72 an ounce.
Green: Silver reaches 2011 resistance at $294 an ounce.
Projecting the 1980 peak onto 2032 M2 supply gives $1746.
Of course we may see any range in between here, but buying at $33 and it being worth $43 in 2032 still outperforms 4% compounding on cash by about 10%.
XAGUSD trade ideas

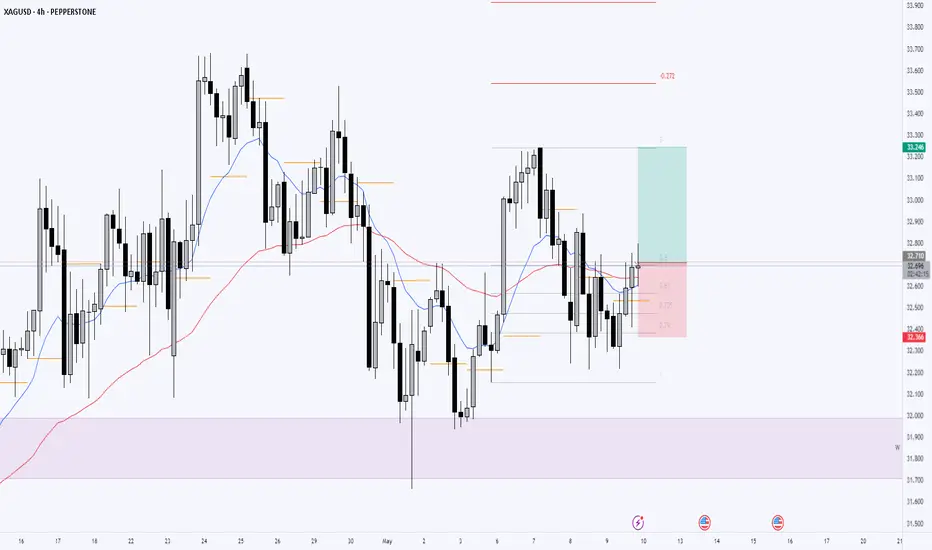
Silver Shines Again! | XAGUSD Long Trade IdeaXAGUSD is showing bullish potential as price rebounded strongly from a key support zone, forming a higher low structure. On the 4H chart, price has broken above the descending trendline and is now trading above the 50 EMA – a classic bullish confirmation for trend continuation.
With bullish momentum building, a pullback to the breakout zone or the 50EMA could offer an attractive entry opportunity for long positions. Look for confirmation with bullish candlestick patterns or strong volume push.
🎯 Potential Target: Previous swing high / Pivot resistance
🛑 Stop Loss: Below recent higher low or 50EMA support zone
📚 Educational Note: In metals like silver, trendline breaks coupled with EMA alignment often provide high-probability setups. Always wait for confirmation to avoid fakeouts.
XAG/USD For Bearish as pull-backwait for pull-back near by entry point and then go short
general trend i up trend
current phase is pull-back
Silver under pressure
have fun :)

4 hour Triangle patternThe price has formed a triangle pattern followed by a false breakout and now if the price makes a higher high, we might get a bullish impulse
WE ONLY TRADE PULLBACKS

Silver Slips as Fed Holds RatesSilver rose more than 1% to approach the $33 mark on Thursday, supported by renewed interest on precious metals with ongoing trade and economic uncertainty. The Federal Reserve left interest rates unchanged, with Chair Powell citing heightened risks while dismissing the need for early rate cuts. Sentiment was also influenced by President Trump’s announcement of an imminent trade deal, reportedly with the UK, and his firm stance on maintaining tariffs against China ahead of upcoming negotiations.
Technically, resistance is seen at $33.80, followed by $34.20 and $34.85, while support levels are noted at $32.00, $31.40, and $30.20.

Silver is Again in the Bullish directionHello Traders
In This Chart XAGUSD HOURLY Forex Forecast By FOREX PLANET
today XAGUSD analysis 👆
🟢This Chart includes_ (XAGUSD market update)
🟢What is The Next Opportunity on XAGUSD Market
🟢how to Enter to the Valid Entry With Assurance Profit
This CHART is For Trader's that Want to Improve Their Technical Analysis Skills and Their Trading By Understanding How To Analyze The Market Using Multiple Timeframes and Understanding The Bigger Picture on the Charts

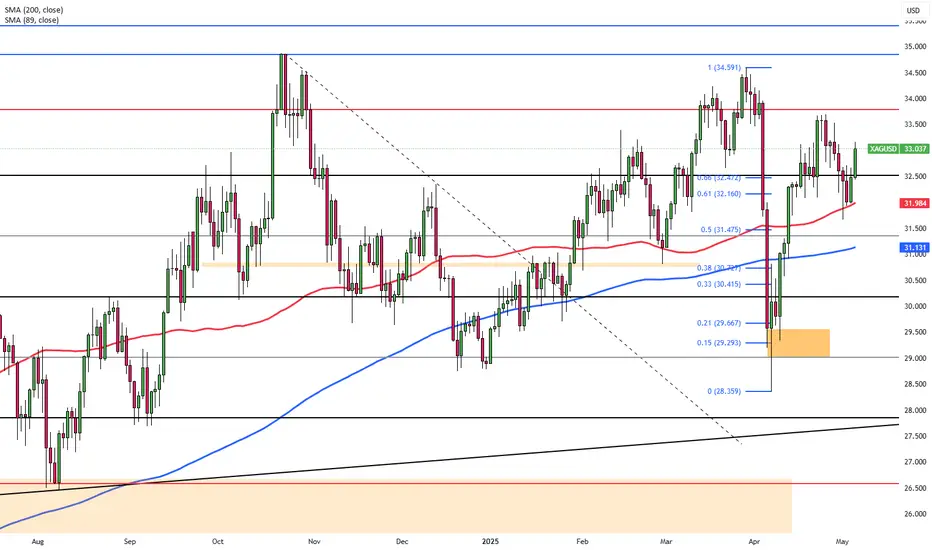
Silver (XAG/USD) Bullish Breakout Toward $34.40 Target Key Observations:
Support Zone (Around $32.00 - $32.50):
Price has respected this zone multiple times (green arrows indicate successful bullish reactions).
EMA 50 and 200 are aligned beneath current price, acting as dynamic support (bullish signal).
Resistance / Target 1 (~$33.40 area):
Price is approaching this area again, previously acting as a resistance.
Short-term traders might consider this a partial take-profit zone.
Target 2 (~$34.40 area):
If the resistance/Target 1 zone is broken and confirmed (as the black arrow suggests), the price could rally toward Target 2.
There's room for bullish continuation based on prior momentum and structure.
📈 Technical Outlook:
Trend: Bullish (higher lows, EMA crossover)
Bias: Bullish continuation if price breaks and retests the $33.40 zone.
Risk: Rejection at resistance could push price back toward the $32.00–$32.50 support.

XAG/USD For Bullishwait for pull-back near by entry point and then go long
general trend is up trend
General rule: buy at the bottom
have fun :)

SILVER XAGUSD
Silver Demand Trends in 2025
Global silver demand is forecast to remain broadly stable in 2025 at around 1.20 billion ounces, with industrial use hitting a new record high. This is driven by ongoing growth in green technologies (solar panels, EVs), electronics, and AI-related products.
Industrial demand is expected to surpass 700 million ounces for the first time, while demand for coins and bars is rebounding in Western markets after a sharp drop in 2024.
Despite stable demand, the silver market remains in a structural deficit for the fifth year, with a 2025 shortfall projected at 117.6 million ounces-though this deficit is narrowing due to increased mine supply, especially from Mexico and Poland.
Which Country is Stockpiling Silver?
China is aggressively stockpiling silver in 2025.
China is purchasing large quantities of unrefined silver concentrate directly from Latin American refiners and miners, securing supply before it reaches the global spot market.
This strategy is driven by surging domestic industrial demand (especially for solar panels) and declining Chinese mine output.
How the China–Taiwan Conflict Affects Silver
Geopolitical tensions between China and Taiwan-and broader US-China trade frictions-are major drivers of silver price volatility and demand in 2025:
Safe-haven demand: Investors are turning to silver (alongside gold) as a hedge against geopolitical risk, trade war escalation, and potential supply disruptions.
Industrial risk: Tariffs and potential conflict threaten global electronics and solar manufacturing supply chains, both of which are major consumers of silver.
Strategic stockpiling: China’s accumulation of silver is partly a defensive measure in case of sanctions, trade blockades, or conflict with Taiwan and the US, ensuring access to critical industrial inputs.
Market impact: These factors have led to sharp price swings, with silver rallying nearly 4% in a single day during recent trade war escalations. Physical shortages are emerging, and above-ground inventories are at multi-year lows.
Summary Table
China’s industrial growth & stockpiling Increases global demand, tightens supply
China–Taiwan–US tensions Boosts safe-haven and strategic demand
Trade war/tariffs Disrupts supply chains, adds volatility
Physical inventory depletion Supports higher prices, risk of shortages
In summary:
Silver demand in 2025 remains robust, especially for industrial uses. China is the leading country stockpiling silver, buying directly from Latin America to secure supply amid falling domestic output and rising demand. The China–Taiwan conflict and US-China trade tensions are key catalysts, fueling safe-haven buying, strategic accumulation, and price volatility. These dynamics are likely to keep silver in a structural deficit and support elevated prices throughout the year.

XAG/USD Stable Ahead of Fed DecisionSilver (XAG/USD) held steady on Tuesday, underpinned by safe-haven demand as U.S. tariff tensions and global growth concerns persisted. Although the U.S. dollar saw a slight recovery, silver maintained its ground with markets focused on the upcoming Federal Reserve policy decision. Expectations for unchanged rates and possible future easing could continue to lend support to silver in the near term.
The first resistance is seen at $33.80, with higher levels at $34.20 and $34.85 if momentum builds. Support begins at $32.00, followed by $31.40 and $30.20.
SilverCurrent Price: $32.33
Mid-point: $32.07
Upside: $33.21, $33.77, $34.40 and $35.03
Downside: $30.94, $30.38, $29.75 and $29.11
Stoploss: $31.49
Resistance: $32.66

Short Idea on Silver (XAGUSD)Based On :
- 1h Supply covered by weekly
- POIV divergence
- IQMS Extremes about to flip

Correction Within the Trend — Silver Update📉 Silver — Correction in Wave (ii)
After a strong impulse from April 7 to 25, silver is now in a wave (ii) correction. These second waves are often sharp, but we’re entering a promising long zone between 30.7–31.7.
🔍 A potential reaction may come from the vWap, VAL, or the 0.38 Fib imbalance area.
🧭 This setup fits perfectly into my broader outlook on silver — read the full breakdown here:
👉
📈 The target for the third wave remains around $35+.

Silver Crab Vs Forbidden Level The persistent failure of silver buyers to overcome the specified resistance level suggests a prevailing weakness in their purchasing power.
Consequently, market observers anticipate a potential shift in momentum, awaiting the entry of more robust buyers, colloquially referred to as "powerful crab buyers," anticipated to emerge from the harmonic golden level.
This potential influx of new investment could provide the necessary catalyst for a sustained upward trend.

SILVER BEARISH BIAS RIGHT NOW| SHORT
SILVER SIGNAL
Trade Direction: short
Entry Level: 3,321.1
Target Level: 3,263.1
Stop Loss: 3,359.8
RISK PROFILE
Risk level: medium
Suggested risk: 1%
Timeframe: 2h
Disclosure: I am part of Trade Nation's Influencer program and receive a monthly fee for using their TradingView charts in my analysis.
✅LIKE AND COMMENT MY IDEAS✅

Silver Hits Resistance: Short Setup in PlaySilver has reached the level of previous resistance and is beginning a pullback. The situation remains unchanged—it looks like a short-term spike followed by a deeper downward move.
I believe it's reasonable to consider a short position in silver.
Additional bearish factors:
Copper, also an industrial metal like silver, is declining.
After such a vertical rally, a downward move with consolidation is likely.

Silver - Short Term Sell Trade Update!!!Hi Traders, on April 30th I shared this idea "Silver - Expecting Retraces Before Prior Continuation Lower"
I expected retraces and further continuation lower until the two Fibonacci resistance zones hold. You can read the full post using the link above.
The bearish move delivered, as expected!!!
If you enjoy this idea, don’t forget to LIKE 👍, FOLLOW ✅, SHARE 🙌, and COMMENT ✍! Drop your thoughts and charts below to keep the discussion going. Your support helps keep this content free and reach more people! 🚀
-------------------------------------------------------------------------------------------------------------------
Disclosure: I am part of Trade Nation's Influencer program and receive a monthly fee for using their TradingView charts in my analysis.

SILVER Set To Grow! BUY!
My dear subscribers,
My technical analysis for SILVER is below:
The price is coiling around a solid key level - 32.014
Bias - Bullish
Technical Indicators: Pivot Points Low anticipates a potential price reversal.
Super trend shows a clear buy, giving a perfect indicators' convergence.
Goal - 32.660
My Stop Loss - 31.682
About Used Indicators:
By the very nature of the supertrend indicator, it offers firm support and resistance levels for traders to enter and exit trades. Additionally, it also provides signals for setting stop losses
Disclosure: I am part of Trade Nation's Influencer program and receive a monthly fee for using their TradingView charts in my analysis.
———————————
WISH YOU ALL LUCK

Silver H4 I Bearish Reversal Based on the H4 chart, the price is rising toward our sell entry level at 32.46, a pullback resistance.
Our take profit is set at 31.50, a pullback support that aligns with the 50% Fibo retracement.
The stop loss is set at 33.15, an overlap resistance.
High Risk Investment Warning
Trading Forex/CFDs on margin carries a high level of risk and may not be suitable for all investors. Leverage can work against you.
Stratos Markets Limited (tradu.com):
CFDs are complex instruments and come with a high risk of losing money rapidly due to leverage. 63% of retail investor accounts lose money when trading CFDs with this provider. You should consider whether you understand how CFDs work and whether you can afford to take the high risk of losing your money.
Stratos Europe Ltd (tradu.com):
CFDs are complex instruments and come with a high risk of losing money rapidly due to leverage. 63% of retail investor accounts lose money when trading CFDs with this provider. You should consider whether you understand how CFDs work and whether you can afford to take the high risk of losing your money.
Stratos Global LLC (tradu.com):
Losses can exceed deposits.
Please be advised that the information presented on TradingView is provided to Tradu (‘Company’, ‘we’) by a third-party provider (‘TFA Global Pte Ltd’). Please be reminded that you are solely responsible for the trading decisions on your account. There is a very high degree of risk involved in trading. Any information and/or content is intended entirely for research, educational and informational purposes only and does not constitute investment or consultation advice or investment strategy. The information is not tailored to the investment needs of any specific person and therefore does not involve a consideration of any of the investment objectives, financial situation or needs of any viewer that may receive it. Kindly also note that past performance is not a reliable indicator of future results. Actual results may differ materially from those anticipated in forward-looking or past performance statements. We assume no liability as to the accuracy or completeness of any of the information and/or content provided herein and the Company cannot be held responsible for any omission, mistake nor for any loss or damage including without limitation to any loss of profit which may arise from reliance on any information supplied by TFA Global Pte Ltd.
The speaker(s) is neither an employee, agent nor representative of Tradu and is therefore acting independently. The opinions given are their own, constitute general market commentary, and do not constitute the opinion or advice of Tradu or any form of personal or investment advice. Tradu neither endorses nor guarantees offerings of third-party speakers, nor is Tradu responsible for the content, veracity or opinions of third-party speakers, presenters or participants.

Silver uptrend channelSilver respecting this uptrend channel very nicely. maybe a retest of the lows before a nice move to the upper level.

Silver – Bearish Move Toward Support🧠 Market Overview:
Instrument: Likely Silver (based on file name).
Chart Context: The price is currently trading below both the 50 EMA (red) and 200 EMA (blue), indicating bearish momentum and a possible shift in market structure.
📊 Key Technical Components:
🔹 Exponential Moving Averages (EMA):
50 EMA (32.614) is above the 200 EMA (32.526) but both are above the current price.
This crossover is recent and could indicate the beginning of a larger downtrend if confirmed by continued price action below both EMAs.
🔹 Market Structure:
POI (Point of Interest) marks a previous swing high where selling pressure emerged.
The chart shows internal liquidity (INT.LQ) sweeps both above and below consolidation areas, hinting at smart money manipulation to grab liquidity before making a move.
🔹 Resistance Zone:
Clearly defined between approx. 33.4–34.0, where price was rejected after a failed attempt to break higher.
Multiple rejections from this zone show strong selling pressure.
🔹 Support Zone:
Sitting between approx. 30.8–31.2.
Price previously consolidated here before a bullish move, making it a likely target for a return test or a potential bounce.
📉 Bearish Scenario & Projection:
The price broke below a short-term structure and failed to hold above EMAs.
The current price action shows a bearish pullback likely to form a Lower High (LH).
The projected path shows a pullback to previous support-turned-resistance, followed by a breakdown targeting the support zone.
✅ Bias:
Short-term bias: Bearish
Medium-term bias: Bearish, unless price reclaims the 200 EMA and consolidates above the resistance zone.
🔍 Confluences Supporting Bearish Outlook:
Price below EMAs (dynamic resistance).
Failed higher highs with liquidity sweeps (indicating smart money selling).
Clear market structure shift to the downside.
Anticipated retest of support zone around 30.8–31.2.

XAGUSD (Silver/US Dollar) trading idea for Monday, May 5, 2025 Trading Plan (Scenario-Based):
📌 Plan A: Bullish Breakout Play
Entry: Buy on breakout above $26.70 with strong volume confirmation.
SL: $26.20
TP1: $27.10
TP2: $27.50
RRR: ~2.5:1
📌 Plan B: Range Bounce
Entry: Buy near $25.80–26.00 support zone if price retraces.
SL: $25.50
TP1: $26.50
TP2: $26.90

SILVER Is Very Bearish! Sell!
Here is our detailed technical review for SILVER.
Time Frame: 4h
Current Trend: Bearish
Sentiment: Overbought (based on 7-period RSI)
Forecast: Bearish
The market is trading around a solid horizontal structure 3,304.4.
The above observations make me that the market will inevitably achieve 3,212.0 level.
P.S
We determine oversold/overbought condition with RSI indicator.
When it drops below 30 - the market is considered to be oversold.
When it bounces above 70 - the market is considered to be overbought.
Disclosure: I am part of Trade Nation's Influencer program and receive a monthly fee for using their TradingView charts in my analysis.
Like and subscribe and comment my ideas if you enjoy them!
