GOLD Analysis - Can buyers push toward 3,410$?OANDA:XAUUSD is trading within a clear ascending channel, with price action consistently respecting both the upper and lower boundaries. The recent bullish momentum indicates that buyers are in control, suggesting there's chances for potential continuation on the upside.
The price has recently broken above a key resistance zone and now came back for a retest. If this level holds as support, it would reinforce the bullish structure and increase the likelihood of a move toward the 3,410 target, which aligns with the channel’s upper boundary.
As long as the price remains above this support zone, the bullish outlook stays intact. However, a failure to hold above this level could invalidate the bullish scenario and increase the likelihood of a deeper pullback.
Remember, always confirm your setups and use proper risk management.
XAUUSD trade ideas

Gold - New All Time High in the making?market context and trend environment
This 4-hour chart of Gold (XAU/USD) from OANDA illustrates a strong impulsive structure within a broader bullish trend. Following a sharp upward movement that broke through previous structure, gold formed a swing high before entering a corrective phase. The market has since pulled back and appears to be stabilizing near a zone of high confluence, suggesting potential for a renewed move to the upside. Price has respected key retracement levels, reinforcing the technical strength of this zone.
fair value gap and fibonacci confluence
A notable feature of this setup is the alignment between a visible fair value gap and the Fibonacci golden pocket zone, comprising the 0.618–0.65 retracement levels. This convergence of technical tools adds weight to the significance of the support zone around the 3,280–3,300 region. Fair value gaps represent inefficiencies in the market caused by strong institutional participation, while the golden pocket is historically known for acting as a magnet for reversals within trending markets. The presence of both in the same area increases the likelihood of price reacting positively here.
liquidity sweep and structural reaction
Before revisiting this key demand zone, price briefly swept below a local low, which may have served as a liquidity grab to fuel the next bullish leg. This liquidity sweep is followed by a sharp reaction, suggesting that downside pressure may have been absorbed by aggressive buyers positioned at the FVG and golden pocket. Price has since rebounded, and the subsequent price action shows a gradual formation of higher lows, hinting at a shift in short-term order flow back in favor of buyers.
projection and bullish scenario
The chart projects a potential bullish continuation move, with a series of higher lows anticipated to form en route to a break of structure above recent swing highs. Multiple buy-side liquidity levels (BSL) are marked, representing areas where buy stops are likely to be clustered. These zones offer clear targets for bullish expansion. The blue arrowed projection outlines a methodical stair-step advance, respecting interim levels before ultimately attempting to reach the prior high near 3,530.
strategic framework and trader insight
This chart offers a methodical roadmap for bullish continuation, rooted in the smart money framework of liquidity, inefficiency, and institutional order flow. The confluence between the fair value gap and Fibonacci retracement is particularly notable and serves as a key validation area for bullish traders. Rather than anticipating immediate breakout behavior, the projection emphasizes a progressive structure that aligns with how larger players tend to accumulate positions before moving the market. Patience and alignment with structure are emphasized as price prepares for a potential continuation move higher.

GOLD → The rally has given way to a correction. News aheadFX:XAUUSD is rising amid a challenging geopolitical environment. During the Asian session, a correction to the zone of interest (0.5 Fibonacci) is forming. The situation is quite complex and tense.
On Tuesday, the metal strengthened to 3433 due to tensions in the Middle East, but during the Asian session, gold fell sharply due to optimism surrounding the upcoming US-China trade talks, the strengthening of the dollar, and profit-taking ahead of the Fed's decision.
Investors are waiting for Powell's speech, which will determine the future of interest rate policy.
Despite the decline, gold is supported by ongoing geopolitical risks in the Middle East, Eastern Europe, and South Asia.
Theoretically, if the bulls keep the price above 0.5 Fibonacci, the growth may continue to 3439, as the price has not yet reached the liquidity zone.
Resistance levels: 3439
Support levels: 3369, 3352
However, unpredictable data could trigger a return of the price to the range and a correction to 3323-3300. Risk is posed by upcoming news: FOMC, Powell's speech, and the rate meeting. The Fed's hawkish stance could put pressure on gold...
Best regards, R. Linda!

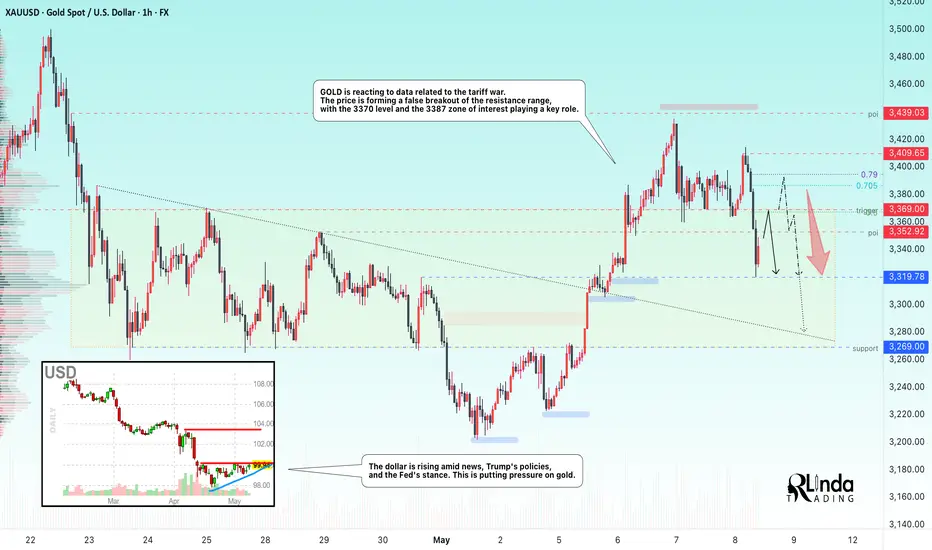
GOLD → Return to range. Fall from resistance...FX:XAUUSD is reacting to data related to the tariff war. The price is returning to the range and forming a false breakout of resistance. The level of 3370 and the zone of interest at 3387 play a key role.
On Thursday, gold rose to $3,400 amid a weaker dollar, increased demand for safe-haven assets, and continued uncertainty due to US trade policy and tensions in the Middle East and Ukraine. The Fed left rates unchanged and expressed caution in its assessment of the outlook, which also supports gold's rise.
However, in the European session, we are seeing gold react to the trade deal with Britain, most likely due to the easing of tariffs. Now the main focus is on the terms of the deal. We should not forget about China, where the situation remains tense, but everyone is waiting for a resolution.
Resistance levels: 3352, 3369, 3385
Support levels: 3319, 3269
The fundamental backdrop changes several times a day. At the moment, the situation is as follows: the rise of the dollar, the weakening of the tariff war, and the hawkish stance of the Fed may put pressure on gold. Therefore, I expect the decline to continue after a retest of 3370-3386. In this case, the target could be 3319.
Best regards, R. Linda!
XAU/USD: Gold Eyes $3400+ After Explosive Surge! (READ CAPTION)By analyzing the gold chart on the 1-hour timeframe, we can see that price once again hit our targets! As expected, gold had a strong bullish rally yesterday and today, reaching both $3328 and $3345, and even extending to $3387.
This surge was fueled by escalating tensions in the Middle East, particularly between Israel and Yemen. Since the conflict shows no signs of easing and further threats remain on the table, I believe gold is not done yet — we may soon see it push above $3400.
These are sensitive days, so please be extra cautious with your trades. Don’t let fear or greed take over — consistency and emotional stability are key to long-term success in this market.
I’ll continue posting more frequent updates to help you stay informed — but that depends on your strong support! Let’s keep growing together!
Please support me with your likes and comments to motivate me to share more analysis with you and share your opinion about the possible trend of this chart with me !
Best Regards , Arman Shaban

Lingrid | GOLD potential PULLBACK and CONTINUATIONThe price perfectly fulfilled my previous idea . OANDA:XAUUSD is accelerating off the trendline support with a sharp impulse leg and now hovering around a potential breakout zone. Momentum remains bullish as price reclaims previous highs and aims for the upper boundary of the resistance zone. The structure favors continuation as long as the trendline holds.
📌 Key Levels
Support zone: 3,345.000 (PDH and trendline convergence)
Breakout target: 3,495.000 (Resistance ceiling within the TARGET area)
Invalidation level: Below 3,345.000 and trendline breakdown ⚠️ Risks
Potential false breakout above 3,400
Failure to hold above 3,345 may trigger deeper correction
Resistance at ATH level could stall momentum
Traders, if you liked this idea or if you have your own opinion about it, write in the comments. I will be glad 👩💻

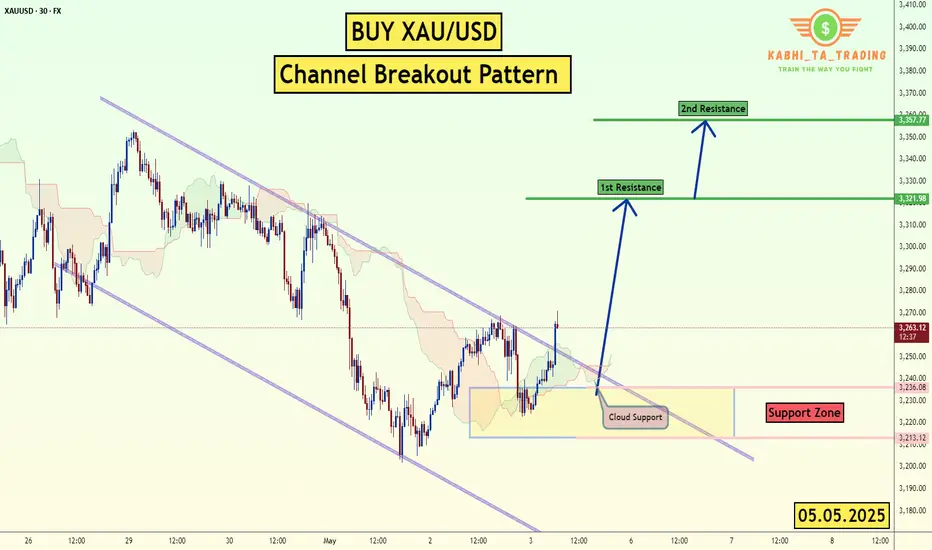
XAU/USD - Channel Breakout (05.05.2025)The XAU/USD pair on the M30 timeframe presents a Potential Buying Opportunity due to a recent Formation of a Channel Breakout Pattern. This suggests a shift in momentum towards the upside and a higher likelihood of further advances in the coming hours.
Possible Long Trade:
Entry: Consider Entering A Long Position around Trendline Of The Pattern.
Target Levels:
1st Resistance – 3321
2nd Resistance – 3357
🎁 Please hit the like button and
🎁 Leave a comment to support for My Post !
Your likes and comments are incredibly motivating and will encourage me to share more analysis with you.
Best Regards, KABHI_TA_TRADING
Thank you.
Lingrid | GOLD structure BREAKOUT. Potential BULLISH RallyThe price perfectly fulfilled my previous idea . OANDA:XAUUSD has broken out of a descending triangle and bearish channel, signaling a short-term reversal. After printing a Lower Low near the support area, price surged past the downward trendline and is now forming a consolidation above it. This suggests bullish strength, but a retest of the breakout level may occur before a continuation.
📌 Key Levels
Support Zone: 3,219 – 3,321
Breakout Target: 3,435
Invalidation Level: Below 3,219 (re-entry into previous bearish structure)
⚠️ Risks
Rejection near 3,435 or failure to hold above the trendline could trigger a correction.
Bearish divergence or strong resistance at 3,487 may cap upside.
Upcoming economic news (e.g., NFP, CPI) could lead to volatility.
Traders, if you liked this idea or if you have your own opinion about it, write in the comments. I will be glad 👩💻

XAU/USD: Gold Regains Strength After Pullback – New Highs Ahead?By analyzing the gold chart on the 2-hour timeframe, we can see that yesterday, as expected, gold surged above $3400, reaching as high as $3439 before facing strong selling pressure, dropping sharply to $3359.
Currently, gold is trading around $3385, and if the price can hold above $3366, we may expect further bullish momentum. I believe gold is setting up for another move above $3400, potentially aiming to break into new highs once again.
THE LATEST ANALYSIS :
Please support me with your likes and comments to motivate me to share more analysis with you and share your opinion about the possible trend of this chart with me !
Best Regards , Arman Shaban

GOLD → An amazing recovery. Up to 3400?FX:XAUUSD continues to strengthen, testing resistance in the range, with buyers not giving up. The price breaks through the flat line and enters the buying zone; everything depends on the bulls...
Gold is rising for the second day in a row amid a weak dollar, increased demand for safe assets, and escalating conflicts in the Middle East and Eastern Europe.
Market nerves are being stoked by trade risks and instability in Asia, while investors await the Fed's decisions and Powell's speech.
GOLD is breaking out of its neutral range. Focus on 3369 and local resistance at 3381. The fundamental backdrop is favorable for gold. If buyers hold their ground above the indicated levels, the price may continue to rise.
Resistance levels: 3369, 3381, 3408
Support levels: 3352 (0.5f), 3330
I do not rule out the possibility of a retest of the local liquidity zone (long squeeze) at 3352 (0.5f) before continuing to rise. But at the moment, the focus is on 3369-3370, which are key levels (currently acting as support).
Best regards, R. Linda!

Simple Break of Structure BoS Trading Strategy Explained
One of the best and reliable strategies to trade break of structure BoS is to apply multiple time frame analysis.
In this article, I will teach you my break of structure gold forex trading strategy. You will get a complete step-by-step guide with examples.
Let's start with a quick theory and let me explain to you what is break of structure BoS in Smart Money Concept SMC trading.
In a bullish trend, break of structure BoS is an important event that signifies a continuation of an uptrend. It is based on a violation and a candle close above the level of the last higher high (HH).
After a breakout, the broken level becomes the first strong support for trend-following buying.
Check multiple examples of confirmed breaks of structure BoS on GBPNZD forex pair on a weekly time frame.
In a downtrend, Break of Structure BoS means a bearish trend continuation . Break of Structure is considered to be confirmed when a candle closes below the level of the last lower low (LL).
The broken key level becomes the closest strong support for buying.
That's the example of a healthy downtrend on USDJPY forex pair on a daily. Each break of structure BoS pushed the prices lower, providing a strong signal to sell.
What newbie traders do incorrectly, they trade break of structure without a confirmation strategy, and it leads to substantial losses.
Though GBPCHF is trading in a bullish trend and though each BoS provided a trend-following signal. The price retraced significantly lower below the broken structure before the growth resumed.
When the price retests a broken structure after BoS in a bullish trend, start lower time frame analysis.
If you identified a break of structure on a daily, analyze 4h/1h time frames.
If on a 4H, then 30/15 minutes.
After the price sets a new higher high with BoS in uptrend, it usually starts trading in a minor bearish trend on lower time frames.
With our strategy, your signal to buy will be a retest of a broken structure and a consequent bullish Change of Character CHoCH . That will provide an accurate bullish signal.
In a bearish trend, analyze the lower time frames after a retest of a broken structure. Your signal to sell will be a bearish Change of Character CHoCH.
Look at a price action on EURCHF on a daily.
We see a strong bullish trend and a confirmed Break of Structure BoS.
According to the rules of our trading strategy, we start analyzing 4h/1h time frames after a retest of a broken level of the last Higher High.
Our signal to buy is an intraday bullish CHoCH. We open a long trade after that with the stop loss below the intraday lows and take profit being a current high.
That's how simple this strategy is.
Multiple time frame analysis provides the extra level of security.
Strong lower time frame confirmation substantially increases the win ratio of a trading setup.
❤️Please, support my work with like, thank you!❤️
I am part of Trade Nation's Influencer program and receive a monthly fee for using their TradingView charts in my analysis.

GOLD - Bullish Structure with Potential Continuation PlayThe current 1-hour chart of Gold (XAU/USD) demonstrates a clean bullish structure supported by an ascending channel and multiple unmitigated Fair Value Gaps (FVGs) acting as potential demand zones. This setup highlights the strength of the ongoing uptrend and offers insights into a high-probability continuation entry should price retrace.
Market Context and Trend Structure:
Following a prolonged downtrend visible in the earlier part of the chart, Gold reversed decisively with a bullish break of structure. Since then, price has been consistently printing higher highs and higher lows while respecting an ascending parallel channel. This channel, marked by two trendlines, encapsulates the short-term bullish momentum.
The current move is strong and impulsive, suggesting that institutional order flow is behind this leg. Candles are elongated with minimal wicks on the upside, reinforcing the idea of aggressive buying pressure.
Key Demand Zones and FVG Analysis:
Three major Fair Value Gaps (FVGs) have formed along the recent bullish leg, each potentially acting as a zone of reaccumulation. These FVGs are marked in green and correspond to areas where price left inefficiency after strong upward moves without immediate retracements.
* The most recent FVG, located just beneath current price, aligns with a minor structure support zone and overlaps partially with the lower boundary of the ascending channel. This area stands out as a prime candidate for a bullish continuation entry, particularly if price retraces and shows signs of holding.
* The middle FVG, slightly lower in the structure, represents a deeper mitigation level and could serve as a secondary entry in case the initial zone fails to hold.
* The lowest FVG is a broader inefficiency zone that formed near the base of the bullish reversal. If price returns this far, it would likely signify a temporary shift in momentum or deeper liquidity hunt before another leg upward.
Channel Structure and Momentum:
The ascending channel has been respected throughout the rally, offering visual confirmation of trend strength and the rhythm of pullbacks. The current price is near the upper boundary of the channel, and a short-term retracement is a logical expectation before continuation.
A pullback into the FVG + lower channel region would represent a convergence of structure, imbalance, and trendline support. These overlapping technical elements enhance the probability of a bounce from this zone.
Projected Path:
The chart also suggests a conservative bullish continuation projection, aiming toward the zone marked around 3449.12. This level appears to be a measured move extension and a safer target in relation to the overall structure. However, the note on the chart implies that the all-time high (ATH) could also be in play if momentum continues and market conditions remain supportive.
The key here is the behavior around the nearest FVG. If price retraces and holds this area—potentially forming a bullish engulfing or confirmation on lower timeframes—it may offer an ideal continuation entry with minimal drawdown.
Conclusion:
This Gold 1-hour chart reflects a strong bullish structure with clear institutional footprints left in the form of unmitigated FVGs. The alignment of ascending channel support and bullish imbalances creates a favorable setup for continuation traders. Watching the immediate FVG zone will be critical, as it may define the next impulsive leg toward higher targets. If that zone fails, deeper FVGs below offer secondary opportunities while maintaining the bullish bias as long as structural higher lows remain intact.

GOLD 1H CHART ROUTE MAP & TRADING PLAN FOR THE WEEKHey Everyone,
Please see our updated 1h chart levels and targets for the coming week.
We are seeing price play between two weighted levels with a gap above at 3341 and a gap below at 3307. We will need to see ema5 cross and lock on either weighted level to determine the next range.
We will see levels tested side by side until one of the weighted levels break and lock to confirm direction for the next range.
We will keep the above in mind when taking buys from dips. Our updated levels and weighted levels will allow us to track the movement down and then catch bounces up.
We will continue to buy dips using our support levels taking 30 to 40 pips. As stated before each of our level structures give 20 to 40 pip bounces, which is enough for a nice entry and exit. If you back test the levels we shared every week for the past 24 months, you can see how effectively they were used to trade with or against short/mid term swings and trends.
The swing range give bigger bounces then our weighted levels that's the difference between weighted levels and swing ranges.
BULLISH TARGET
3341
EMA5 CROSS AND LOCK ABOVE 3341 WILL OPEN THE FOLLOWING BULLISH TARGETS
3372
EMA5 CROSS AND LOCK ABOVE 3372 WILL OPEN THE FOLLOWING BULLISH TARGET
3414
EMA5 CROSS AND LOCK ABOVE 3414 WILL OPEN THE FOLLOWING BULLISH TARGET
3447
EMA5 CROSS AND LOCK ABOVE 3447 WILL OPEN THE FOLLOWING BULLISH TARGETS
3478
EMA5 CROSS AND LOCK ABOVE 3478 WILL OPEN THE FOLLOWING BULLISH TARGETS
3502
BEARISH TARGETS
3307
EMA5 CROSS AND LOCK BELOW 3307 WILL OPEN THE RETRACEMENT RANGE
3281
3254
EMA5 CROSS AND LOCK BELOW 3254 WILL OPEN THE SWING RNGE
3233
3201
As always, we will keep you all updated with regular updates throughout the week and how we manage the active ideas and setups. Thank you all for your likes, comments and follows, we really appreciate it!
Mr Gold
GoldViewFX

GOLD → Pressure from sellers. The decline will continueFX:XAUUSD is falling in Asian and European trading, hitting new lows and confirming the downward trend. The reason is the de-escalation of the tariff war...
The price of gold fell to $3,250 due to increased risk appetite after positive news from US-China trade talks. Investors are hoping for a quick agreement, reducing demand for gold as a safe-haven asset.
However, tensions between India and Pakistan, as well as Russia and Ukraine, continue to support interest in gold and prevent further declines. Market participants are also watching US negotiations with Japan and the EU, where the threat of new tariffs remains.
Resistance levels: 3250, 2369
Support levels: 3222, 3193, 3167
GOLD is testing support and forming a false breakdown relative to 3222. There is a possibility of a correction to 0.5 - 0.7 Fibonacci. However, if there is no pullback and the price begins to break support, gold will continue its decline to 3190 - 3170
Best regards, R. Linda!

GOLD ROUTE MAP UPDATEHey Everyone,
Another PIPTASTIC day on the charts with our chart idea playing out as analysed.
After completing 3260 and 3308 yesterday, we stated that we now had ema5 lock above 3308 opening 3340.
- This was done perfectly completing this target with plenty of time to get in for the action. We are now seeing ema5 lock above 3340 leaving 3428 open. Any rejections on this zone will see price testing the lower Goldturns for suport and bonce inline with our plans to buy dips within the overall structure.
We will keep the above in mind when taking buys from dips. Our updated levels and weighted levels will allow us to track the movement down and then catch bounces up.
We will continue to buy dips using our support levels taking 20 to 40 pips. As stated before each of our level structures give 20 to 40 pip bounces, which is enough for a nice entry and exit. If you back test the levels we shared every week for the past 24 months, you can see how effectively they were used to trade with or against short/mid term swings and trends.
The swing range give bigger bounces then our weighted levels that's the difference between weighted levels and swing ranges.
BULLISH TARGET
3260 - DONE
EMA5 CROSS AND LOCK ABOVE 3260 WILL OPEN THE FOLLOWING BULLISH TARGETS
3308 - DONE
EMA5 CROSS AND LOCK ABOVE 3308 WILL OPEN THE FOLLOWING BULLISH TARGET
3340 -DONE
EMA5 CROSS AND LOCK ABOVE 3340 WILL OPEN THE FOLLOWING BULLISH TARGET
3382
EMA5 CROSS AND LOCK ABOVE 3382 WILL OPEN THE FOLLOWING BULLISH TARGETS
3428
EMA5 CROSS AND LOCK ABOVE 3428 WILL OPEN THE FOLLOWING BULLISH TARGETS
3478
BEARISH TARGETS
3217
EMA5 CROSS AND LOCK BELOW 3217 WILL OPEN THE BEARISH TARGETS
3174
EMA5 CROSS AND LOCK BELOW 3174 WILL OPEN THE SWING RNGE
3126
3078
EMA5 CROSS AND LOCK BELOW 3078 WILL OPEN THE SECONDARY SWING RANGE
SECONDARY SWING RANGE
3034 - 2979
As always, we will keep you all updated with regular updates throughout the week and how we manage the active ideas and setups. Thank you all for your likes, comments and follows, we really appreciate it!
Mr Gold
GoldViewFX

XUA/USD) bullish trend analysis Read The ChaptianSMC Trading point update
Technical analysis chart for Gold Spot (XAUUSD) on the 4-hour timeframe. Here's a breakdown of the key ideas behind the analysis:
1. Trend and Structure:
The overall trend shows a bullish move followed by a correction and now a potential continuation upward.
A bullish breakout from a descending trendline suggests a shift in momentum from bearish to bullish.
2. Key Zones:
Order Block / Buying Zone (~3,280-3,310): A demand area where price is expected to find support and potentially bounce higher.
Support Level (~3,320-3,360): Price is currently above this level, suggesting buyers are in control.
Resistance Level (~3,440-3,495): Marked as a potential short-term ceiling; a breakout above this level may signal strong bullish continuation.
Target Point (~3,494): This is the projected take-profit level for a bullish move.
3. RSI Indicator:
RSI is around 63–64, close to overbought territory but not yet extreme. This suggests moderate bullish momentum without signs of immediate reversal.
4. Projected Move:
The chart outlines a possible retracement to the support or order block zone, followed by a bounce and a push toward the resistance level and target.
Mr SMC Trading point
Strategy Implication:
Buy on pullback to the support or order block zone.
Stop-loss could be placed below the order block (~3,280).
Take-profit around the target zone (~3,494).
pales support boost 🚀 analysis follow)

Gold will continue to grow and exit from pennantHello traders, I want share with you my opinion about Gold. After looking at this chart, we can see how the price of Gold has been developing inside an upward pennant, formed after a powerful impulse from the buyer zone. This earlier move created a strong bullish foundation, supported by consistent reactions from the support area, which has since become a key defensive level. After the breakout from the upper boundary of the previous ascending channel, the price entered a phase of consolidation. However, rather than fading, the price action has remained tightly squeezed between the support line and the resistance trendline, creating the structure of a classic pennant. This pattern usually signals continuation, especially when supported by strong preceding momentum, which is exactly what we’re seeing here. Currently, the price is hovering around the support line of the pennant and has already shown signs of bouncing back up. If this rebound continues, the next logical move is a breakout through the resistance line of the pennant, with the 3450 level as a target. It aligns perfectly with the upper boundary and represents a strong technical TP1. Please share this idea with your friends and click Boost 🚀

Lingrid | GOLD complex PULLBACK from RESISTANCE zoneOANDA:XAUUSD is maintaining its structure above a key upward trendline after a higher low formed near support. The market remains technically bullish while staying above this level, with the recent pullback looking corrective rather than impulsive. Buyers may step in for a renewed attempt toward the upper resistance area. Watch for a bullish breakout continuation above 3,326 toward 3,380 if buyers hold the current support line.
📌 Key Levels
Support zone: 3,305.583 (upward trendline and structure base)
Breakout target: 3,380.000 (resistance ceiling of range)
Invalidation level: Below 3,304.696 (would negate bullish setup)
⚠️ Risks
Breakdown below trendline could trigger deeper correction
Price consolidation may reduce momentum short term
Rejection near 3,326 could signal fading bullish strength
Traders, if you liked this idea or if you have your own opinion about it, write in the comments. I will be glad 👩💻

GOLD 1H CHART ROUTE MAP UPDATEHey Everyone,
Once again our trading idea delivers the goods!!!
We got our target yesterday at 3382 and then followed with the cross and lock above 3382 leaving 3428 open.
- This played out perfectly with 3428 getting hit. No further cross and lock above 3428 confirmed the perfect rejection into the lower weighted Goldturn. The Goldturn gave the bounces, for 20 to 40 pips, just like we always state. This was once again a double bubble move for us!!
We will continue to buy dips using our support levels taking 20 to 40 pips. As stated before each of our level structures give 20 to 40 pip bounces, which is enough for a nice entry and exit. If you back test the levels we shared every week for the past 24 months, you can see how effectively they were used to trade with or against short/mid term swings and trends.
The swing range give bigger bounces then our weighted levels that's the difference between weighted levels and swing ranges.
BULLISH TARGET
3260 - DONE
EMA5 CROSS AND LOCK ABOVE 3260 WILL OPEN THE FOLLOWING BULLISH TARGETS
3308 - DONE
EMA5 CROSS AND LOCK ABOVE 3308 WILL OPEN THE FOLLOWING BULLISH TARGET
3340 -DONE
EMA5 CROSS AND LOCK ABOVE 3340 WILL OPEN THE FOLLOWING BULLISH TARGET
3382 - DONE
EMA5 CROSS AND LOCK ABOVE 3382 WILL OPEN THE FOLLOWING BULLISH TARGETS
3428 - DONE
EMA5 CROSS AND LOCK ABOVE 3428 WILL OPEN THE FOLLOWING BULLISH TARGETS
3478
BEARISH TARGETS
3217
EMA5 CROSS AND LOCK BELOW 3217 WILL OPEN THE BEARISH TARGETS
3174
EMA5 CROSS AND LOCK BELOW 3174 WILL OPEN THE SWING RNGE
3126
3078
EMA5 CROSS AND LOCK BELOW 3078 WILL OPEN THE SECONDARY SWING RANGE
SECONDARY SWING RANGE
3034 - 2979
As always, we will keep you all updated with regular updates throughout the week and how we manage the active ideas and setups. Thank you all for your likes, comments and follows, we really appreciate it!
Mr Gold
GoldViewFX

Gold: Potential Bullish Reversal Setup on XAU/USD from QML ZoneHello guys!
What I see:
QML in Lower Time Frame:
Price is currently testing a QML zone from a lower timeframe (marked in light blue).
This area aligns with a significant reaction point, suggesting institutional interest.
QML in Higher Time Frame:
Below this lies a higher timeframe QML, acting as a secondary support.
This adds confluence for a potential strong bullish rejection if the price dips further.
Engulfed Level:
A previously engulfed resistance level has been marked, showing where sellers lost control.
Price returning toward this area with reduced momentum indicates possible accumulation.
Targets Identified:
Multiple target levels are projected with an ascending structure.
These align with liquidity pools above recent highs, suggesting buy-side liquidity engineering.
Market Structure:
Current price behavior suggests the formation of higher lows and potential bullish continuation.
A corrective move into the QML zone could spark a strong impulsive leg upward.

XAU/USD - Fed warns of Economic UncertaintyThe XAU/USD pair on the M30 timeframe presents a Potential Buying Opportunity due to a recent Formation of a Bullish Flag Pattern. This suggests a shift in momentum towards the upside and a higher likelihood of further advances in the coming hours.
Possible Long Trade:
Entry: Consider Entering A Long Position around Trendline Of The Pattern.
Target Levels:
1st Resistance – 3473
2nd Resistance – 3519
🎁 Please hit the like button and
🎁 Leave a comment to support for My Post !
Your likes and comments are incredibly motivating and will encourage me to share more analysis with you.
Best Regards, KABHI_TA_TRADING
Thank you.

XAU/USD: Gold will fall ? (READ THE CAPTION)By analyzing the gold chart on the 2-hour timeframe, we can see that on Friday, after the price rose to $3248, it once again faced a correction and eventually closed at $3326. I expect that with the market opening, we’ll see further correction from gold, and the first potential target will likely be the $3213–$3216 area.
The key demand zones are $3253–$3274 and the $3313 level.
The key supply zones are $3355–$3369 and $3395–$3408.
Please support me with your likes and comments to motivate me to share more analysis with you and share your opinion about the possible trend of this chart with me !
Best Regards , Arman Shaban

GOLD Correction Complete - Rally Toward $3,450 AheadOANDA:XAUUSD is trading within a well-defined ascending channel, signaling ongoing bullish momentum. The price has continued to respect the channel structure, printing higher highs and higher lows, a clear sign of an intact uptrend. The recent retracement represents a healthy correction, potentially setting the stage for another bullish leg.
Price is now approaching a key support zone, marked by the lower boundary of the channel and a previous demand area. If this zone holds, it may offer a strong re-entry opportunity for buyers. The projected upside target is $3,450, which aligns with both the midline of the ascending channel and a previous resistance level.
As long as the price remains above the support zone and the ascending trendline, the bullish scenario remains valid. A break below this level, however, could invalidate the setup and increase the likelihood of a deeper retracement.
Always confirm your setups and trade with a proper risk management.
Best of luck!
