Gold another shortShort from 3350$ .
i think gold will keep going down .
It is time for crypto to take the momentum
XAUUSD trade ideas

Gold price analysis May 6Due to the impact of world economic and political tensions. The gold candle has reversed to increase again with the D1 candle increasing by nearly 100 prices.
The gold uptrend has formed and it is easier to trade to find entry zones. Today's beautiful Buy zone is noticed in the price retests to the Break out zone. 3328 is considered a buying opportunity today. Currently, gold is sideways in the 3372 and 3354 range. Watch for a breakout to trade the breakout and wait for the main entry zone. When gold increases, it will encounter barriers or targets for buy orders at 3410. Today is a day without much important news, so the 3410 and 3328 ranges are considered strong. If it breaks through this range, pay attention to the quite far range around 3445 and 3270

Gold head and shoulders bottom trend, bull market strong?🗞News side:
1. Tariffs push up inflation and slow down the economy, and the Federal Reserve may be in trouble
2. The situation between India and Pakistan escalates again
📈Technical aspects:
At the hourly level, today's Asian session continued the "wash-out" operation characteristics, quickly rising by 20 US dollars at the opening, and then stepped back to 3310 to confirm the top and bottom conversion support level. The two positive lines seemed to form a "yang-enclosing-yin" upward attack pattern, but suddenly reversed, not only breaking the trend support line of 3280, but also falling to 3274 before bottoming out and rebounding. This erratic trend has a significant long-short double kill effect for investors accustomed to trend continuation strategies. However, we can accurately find the right position in the market to trade and make profits.
At present, it is expected to form a "head and shoulders bottom" pattern from a morphological perspective, accumulating momentum for subsequent rises, and there is still room for upside in the short term. At present, any pullback is an opportunity for us to go long. Pay attention to the 3360-3370 line suppression on the top. If this resistance area is broken, it may open up a new round of upward space.
TVC:GOLD FOREXCOM:XAUUSD FXOPEN:XAUUSD TVC:GOLD FX:XAUUSD OANDA:XAUUSD

Gold is expected to pull back, short gold!Fundamentals:
Focus on the Fed's interest rate decision and Powell's speech;
I think the Fed will keep the interest rate decision unchanged this time, at least it will not announce a rate cut this time, which may suppress the gold market;
Technical aspects:
Before the Fed's interest rate decision, gold is currently in a volatile state. However, relatively speaking, it is currently in a volatile and bearish state, with short-term resistance in the 3395-3405 area; and gold has repeatedly tested the 3370-3360 below during the retracement process. After multiple tests, gold may be more likely to break through this support area; the key support below is in the 3360-3350 area, followed by the 3320-3310 area.
Trading strategy:
Consider shorting gold in the 3395-3405 area, TP: 3370-3360

Gold is rising strongly. When can the bull market stop?🗞News side:
1. Trump announces renegotiation of USMCA
2. Pay attention to the Fed interest rate
📈Technical aspects:
Looking at the daily chart, gold prices are breaking through important resistance levels and forming a strong upward trend. The price is currently trading around 3410, with strong suppression at 3420-3430 above the short-term. If the gold price encounters resistance and pressure, gold may once again experience a correction. Therefore, when the gold price touches the 325-3435 line, you can try to place a short position. In terms of operation, after two consecutive positive days on the technical front, the bulls will continue further. The current short-term support has moved up to the 3386 line. 3386 is the early resistance that turned into support after breaking through. This will be an important support level. At the same time, the 3270-3260 line support below is still strong. Continue to look at the 3430-3450 line. Therefore, in terms of operation, we mainly do long positions on callbacks and supplementary short positions on rebounds.
If you agree with this view, or have a better idea, please leave a message in the comment area. I look forward to hearing different voices.
OANDA:XAUUSD FX:XAUUSD FXOPEN:XAUUSD FOREXCOM:XAUUSD TVC:GOLD

XAUUSD Price Action: Bullish Break + Liquidity Sweep Trade Idea🪙✨ Gold (XAUUSD) Technical Outlook ✨📈
I’m currently analyzing XAUUSD on both the daily and 4H timeframes, and here’s what I’m seeing:
🚀 Price has broken bullish structure and is now looking overextended, pushing into a buy-side liquidity zone—clearly visible to the left of current price action. 💰📊
It’s clearing buy stops, which could trigger a retracement soon. 🧲🔁
🎯 I’m watching closely for a pullback into the 50%–61.8% Fibonacci retracement zone on the current price swing—that’s my key point of interest for a potential long setup, provided we see a healthy pullback followed by another bullish break of structure. 🔍🔐
🧠 Not financial advice—just my personal analysis. Always manage risk. ⚠️📉

Gold short: A Video Walkthrough on AnalysisOver in this video, I went through live on how I analyze the Gold Chart (I did not prepare before hand). Here, I propose that Gold has further to to fall and set 3 different targets and how I derived the targets.

Gold (XAU/USD) 1H – Bearish SetupGold is trading below key resistance at 3,280 after a sharp drop, now forming a bearish flag around the 3,240 zone. Technicals suggest a potential continuation lower with a favorable risk-reward ratio. Sell entry activated at 3,240, targeting strong support near 3,200 (400+ pips) with a stop loss placed 150 pips above resistance. Fundamentals support bearish bias amid USD strength and shifting sentiment.
Support: If you found this helpful, like and follow for more trade ideas!
Must Support Me Share My Idea With Your Firends Mention Your Feed back Comment Section
Note: This is not financial advice. Please conduct your own research and manage risk accordingly.

GOLD (XAUUSD) – Market Update & Daily Plan – May 13, 2025🔹 Bias: Intraday bullish (HL forming)
🔹 Context: Price is reacting from the 3215–3228 zone (OB + discount) after confirming CHoCH at 3284.
We’re in a retracement phase — next move could target 3240–3280 if structure holds.
🔵 BUY ZONES (reaction areas, not sniper):
3215–3228
✅ Confirmed H4 OB
✅ Discount zone + EMA200 confluence on H1
✅ HL structure still valid
📌 If price retests with bullish confirmation → long toward 3240+ remains valid
3175–3195
🔵 Strong H4 demand zone
📌 Only if 3215 fails — last area to defend the bullish bias
Wait for structure to hold — don’t panic buy into weakness
🔴 SELL ZONES (broad reaction areas):
3285–3300
🔺 Previous high + unfilled FVG
🔺 Potential inducement zone before rejection
📌 If price rallies fast, watch for rejection — solid area for short pullbacks
3340–3355
🔺 Strong H4/D1 supply
🔺 Untested premium OB
📌 Only valid if price breaks above 3300 — aggressive short if NY overextends
🧠 Summary:
We’re in a bullish retracement.
If 3215 holds → price may push toward 3280+.
If that fails → 3175–3195 is the final defense zone before larger structure shifts.
Sell zones are reactive — wait for signals, don’t jump in early.
💬 Stay calm, stay patient. Don’t trade the zones — trade the reaction.
🔔 Final Thoughts for Tuesday
The levels are marked. The structure is clear.
Now it’s up to you to stay calm and let price do the talking.
We don’t chase moves — we let the market knock on our zones.
📍 Whether you're buying from discount or selling from premium — let logic lead, not FOMO.
And remember: structure doesn’t lie... but your emotions might.
💬 Got questions? Drop them — this is a team effort.
Let’s stay sharp, focused, and prepared.
See you on the charts,
— GoldFxMinds 🧠⚔️

GOLD BEST PLACE TO BUY FROM|LONG
GOLD SIGNAL
Trade Direction: long
Entry Level: 3,341.45
Target Level: 3,414.79
Stop Loss: 3,292.55
RISK PROFILE
Risk level: medium
Suggested risk: 1%
Timeframe: 2h
Disclosure: I am part of Trade Nation's Influencer program and receive a monthly fee for using their TradingView charts in my analysis.
✅LIKE AND COMMENT MY IDEAS✅

H4 frame accumulation 2 trend lines✍️ NOVA hello everyone, Let's comment on gold price next week from 05/12/2025 - 05/16/2025
🔥 World situation:
Gold prices advanced over 1% on Friday, rebounding as the US Dollar (USD) softened following a two-day winning streak, pressured by declining US Treasury yields. Renewed risk-off sentiment, fueled by persistent geopolitical tensions, bolstered demand for the safe-haven metal. At the time of writing, XAU/USD is trading near $3,338.
US equity markets slipped as investors adopted a cautious stance ahead of Saturday’s high-stakes meeting between US and Chinese delegations in Switzerland. While hopes for a de-escalation in trade tensions remain elevated, uncertainty continues to dominate sentiment.
Adding to the volatility, US President Donald Trump reignited trade concerns by stating on social media, “80% Tariff on China seems right! Up to Scott B.”
🔥 Identify:
Gold prices slow down, starting to accumulate more. Trade negotiations will appear more, putting selling pressure on gold prices in the near future.
🔥 Technically:
Based on the resistance and support areas of the gold price according to the H4 frame, NOVA identifies the important key areas as follows:
Resistance: $3402, $3435
Support : $3282, $3203
🔥 NOTE:
Note: Nova wishes traders to manage their capital well
- take the number of lots that match your capital
- Takeprofit equal to 4-6% of capital account
- Stoplose equal to 2-3% of capital account
- The winner is the one who sticks with the market the longest

Gold falls, can it continue to fall before closing?Gold still fell in the morning, but it made a V-shaped reversal after bottoming out and rebounding, slightly breaking the morning high of 3323 and touching the pressure line of 3330. This trend is very subtle, which means that the support here is strong at 3274. You can be bearish but not too bearish. Focus on the support line of 3300 and see the rebound strength of the European session. If the European session stands on the pressure line of 3330, then consider shorting around 3360 in the evening, and the US session will be volatile. If the rebound strength of the European session is limited and it is always suppressed below 3330 and goes sideways, then you can continue to be bearish directly, and the support below is 3270-3253. If it breaks above 3330, then you have to pull back and do more.

Global central banks are increasing their holdingsGold hit a low of 3323 in the morning and then began to rebound strongly, reaching a high of 3386, then fell to a low of 3352, and rebounded to 3372. Gold made a slight correction near 3365 for a while, then fell to 3350, and now rebounded to 3368. There is less than an hour left before the European session. It is currently in the middle of the strong stretch in the morning. Now, gold still has some room for stretching. The upper resistance is currently at 3374-3377, which is expected to be the highest level today, and the lower support is 3340-3330. It is recommended to rebound short.
Operation strategy 1: It is recommended to rebound short at 3374-3378, stop loss at 3384, and the target is 3355-3325.

Gold's volatile decline is in line with expectationsFrom the perspective of the 4-hour cycle, a big negative line closed down, breaking the support of the 5-day and 10-day moving averages. This wave may continue to fall to the Bollinger middle rail near 3300, but if it is a high-level shock, the Bollinger middle rail is not broken, and it may rise again to the high point of 3430. In this cycle, gold has experienced a big rise and fall, and now it is possible to rise or fall. In the short-term cycle, we will first pay attention to the support effect of 3360-3350 under weakness. If it does not break, we can continue to go long and bullish, with the upper target at 3400. On the whole, the short-term operation strategy of gold is recommended to be mainly short-selling on rebounds, supplemented by long-selling on pullbacks. The upper short-term focus is on the 3400-3405 line of resistance, and the lower short-term focus is on the 3350-3300 line of support.

Gold rebound is a good time to shortGold has been in a volatile state since the opening today, opening at 3236 and reaching a high of 3243. It is currently fluctuating in the form of shocks. With the comprehensive ceasefire between India and Pakistan and the peace talks in the Sino-US tariff war, gold will still be in a downward trend. Although it is in a downward trend, we should not chase the short position directly. We can just treat the rebound as shorting. The main trend is still to short on the rebound. After all, the general trend is bearish.
In the 4-hour chart, the weak stage is oscillating downwards, and the resistance of the middle rail has moved down to the 3300 mark. At the same time, there is still a gap to be filled, and it is currently in shock above the neckline. There are two differentiated moves here. One is to go sideways and weakly consolidate and then directly break the neckline of 3200 and go for in-depth adjustments. The other is to rebound above 3200 to correct and build momentum, forming a wave of poised to break low. One is weak consolidation to break low, and the other is poised to break low. Overall, it is optimistic that the market will break through the low of 3200, but it reflects the various changes in the short-term form. The upper 3250-3260 range has gathered intensive trading resistance, forming short-term strong pressure. In short-term operation, first go short on rallies below 3260, and first look at the profit from this wave of correction! Next, we will look at the previous low support of 3200. If the position is broken, we will continue to see the downward continuation. If the position is not broken, we will place long orders on the backhand. At that time, we will choose the opportunity to lay out the long-term plan based on the support of 3200. On the whole, today's short-term operation strategy for gold is to short on rebounds and long on pullbacks. The upper short-term focus is on the 3248-3252 resistance line, and the lower short-term focus is on the 3200-3160 support line.
Gold operation suggestion: short gold near 3245-3255, target around 3220-3210. Gold will go long when it pulls back around 3210-3200, with the target around 3230-3250.

High-level strong pressure rebound continues to shortSince the opening gap at 3275, gold rebounded to 3292 and then started to fall. So far, gold has hit 3216 and then fluctuated upward. The bulls are temporarily suppressed. We still focus on rebounding and shorting. After all, the general trend is bearish. The upper 32775-3281 is the main short-term suppression level. If the rebound does not break, you can continue to short. The short position may continue to reach a new low. Pay attention to the support of 3200.
Judging from the current gold trend, the support at 3206-3215 is the focus below, and the short-term resistance at 3275-81 is the focus above. The strong resistance is near 3290-3300. This position is also the watershed between long and short positions. Before the daily level breaks through and stands on this position, the main short rhythm of the pullback will continue to remain unchanged.
Gold operation strategy:
1. Short gold at 3275-83 when it rebounds, short at 3290-95 when it rebounds, stop loss at 3303, target at 3206-3215, continue to hold if it breaks

XAUUSD NEW KEY LEVELS📈 XAUUSD Trade Setup 📉
Please refer to the highlighted boxed zone 🟦 on the chart for key price action levels.
🔵 Buy Setup
Initiate a buy position if a candle breaks and closes above the boxed area.
Then, enter when the next candle breaks the high of the closing candle.
🔴 Sell Setup
Initiate a sell position if a candle breaks and closes below the boxed area.
Then, enter when the next candle breaks the low of the closing candle.
🎯 Target Levels
The blue lines 🔵 indicate our target levels.
Close 90% of your position to secure profits 💰.
Hold the remaining 10% for potential extended gains 🚀.

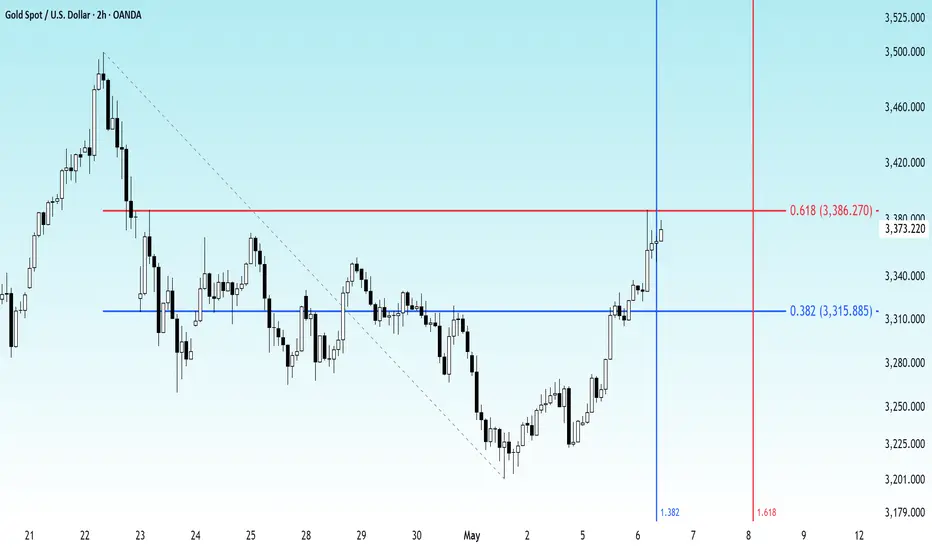
GOLD - A New High Is Coming?The price recently reached the 61.8% Fibonacci retracement level and at the same time, the has hit the 38.2% Fibonacci time level. This combination of price and time Fibonacci levels signals that the trend is strong and likely to continue. With this momentum, it is normal to expect a move towards a new high at 3580.
Bearish reversal?The Gold (ZAU/USD) is reacting off the pivot and could drop to the 1st support.
Pivot: 3,328.69
1st Support: 3,271.11
1st Resistance: 3,359.66
Risk Warning:
Trading Forex and CFDs carries a high level of risk to your capital and you should only trade with money you can afford to lose. Trading Forex and CFDs may not be suitable for all investors, so please ensure that you fully understand the risks involved and seek independent advice if necessary.
Disclaimer:
The above opinions given constitute general market commentary, and do not constitute the opinion or advice of IC Markets or any form of personal or investment advice.
Any opinions, news, research, analyses, prices, other information, or links to third-party sites contained on this website are provided on an "as-is" basis, are intended only to be informative, is not an advice nor a recommendation, nor research, or a record of our trading prices, or an offer of, or solicitation for a transaction in any financial instrument and thus should not be treated as such. The information provided does not involve any specific investment objectives, financial situation and needs of any specific person who may receive it. Please be aware, that past performance is not a reliable indicator of future performance and/or results. Past Performance or Forward-looking scenarios based upon the reasonable beliefs of the third-party provider are not a guarantee of future performance. Actual results may differ materially from those anticipated in forward-looking or past performance statements. IC Markets makes no representation or warranty and assumes no liability as to the accuracy or completeness of the information provided, nor any loss arising from any investment based on a recommendation, forecast or any information supplied by any third-party.

Gold/ Silver ratio - approaching a resistance pointRatio is overbought in favour of gold
Silver could start outperforming if the overhead resistance hold

XAUUSD - clean sell setup - market structureXAUUSD - clean sell setup - market structure, use risk and trade managment , discipline is the key!

5.6 Gold Market Analysis5.6 Gold Market Analysis
Gold prices rose slightly today and then entered a volatile trend. It is expected that the market will continue yesterday's trend and rise steadily.
After the gold price rises, we will wait for the high to pull back to around 3350 before going long. In the morning, the gold price encountered resistance at 3380, so technically this suppression can be used as a key reference for the future market. If it does not break 3380, there is still a risk of falling.
The rise in gold prices in the past two days, whether it is caused by news or the opening of the Asian session, we must maintain a steady rhythm.
Today's support level is 3330, and the resistance level is 3380. The strategy is to go long on the decline.
Thank you for your attention, and I hope my analysis can help you.

xauusd buy tradeThe Relative Strength Index (RSI) is showing an upward trend, indicating increasing momentum. Additionally, the Moving Average Convergence Divergence (MACD) is showing a bullish crossover, further supporting the potential for an upward move.
