Gold Intraday Trading Plan 5/3/2025Gold behaved just as I predicted but a bit lagged. Instead of going straight to 3228, it went to 3270 first and went up to 3370 and then dropped to 3200. This behavior indicates the further drop in the coming week.
Although overall trend is bullish, I don't think the correction is over yet. I am expecting it to test at least 3165, which is the last weekly resistance and also the top of previous channel.
For the trading strategy next week, I will engaged selling orders toward 3165 and if it holds, I will buy from there and monitor the price along the way.
Let's have a profitable week ahead and enjoy your weekend!
XAUUSD trade ideas

Gold latest strategy signals- Point of Interest
- Symmetrical Triangle as corrective pattern in Short Time Frame
- Order Block
- Completed " 12345 " Impulsive Waves and " AB " Corrective Waves
- Fibonacci Level - 38.20% / 50.00%

Gold : Buy SetupGold :: 1 Hour chart
Buy Trade idea base on trendline
Wait for breakout and buy at retest area

bullish momentum, accumulating around 3400⭐️GOLDEN INFORMATION:
Gold price (XAU/USD) regained strong upward momentum during the Asian session on Thursday, rebounding sharply above the $3,400 level in the past hour and recovering much of its overnight pullback from a two-week high. The renewed demand for the safe-haven metal comes as US President Donald Trump downplayed expectations of an imminent resolution to the US-China trade dispute, stating he feels "no rush" to finalize an agreement. Heightened geopolitical tensions—including the ongoing Russia-Ukraine war, instability in the Middle East, and escalating military friction between India and Pakistan—further support gold's appeal as a defensive asset.
⭐️Personal comments NOVA:
Gold price continues to recover well around 3400, FED's speech is quite moderate, predicted early by investors, the market is positive in the recovery trend this week
⭐️SET UP GOLD PRICE:
🔥SELL GOLD zone : 3438- 3440 SL 3445
TP1: $3425
TP2: $3410
TP3: $3395
🔥BUY GOLD zone: $3352 - $3350 SL $3345
TP1: $3365
TP2: $3380
TP3: $3400
⭐️Technical analysis:
Based on technical indicators EMA 34, EMA89 and support resistance areas to set up a reasonable sell order.
⭐️NOTE:
Note: Nova wishes traders to manage their capital well
- take the number of lots that match your capital
- Takeprofit equal to 4-6% of capital account
- Stoplose equal to 2-3% of capital account

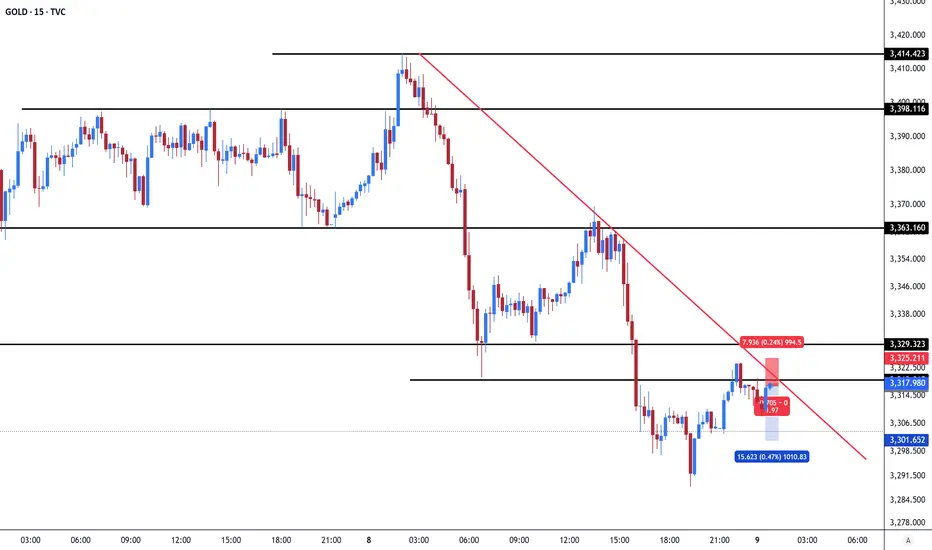
Scalping Trade – Technical Analysis on Gold (1-Minute Timeframe)
In this brief analysis, we examine a scalping opportunity on Gold (XAU/USD) using the 1-minute chart, focusing on a short-term technical setup supported by both price action and indicators.
The chart displays a well-defined downward trend, confirmed by two descending red trendlines. These trendlines have been respected consistently by the price, indicating a strong bearish structure. At the time of analysis, the price action approached a key resistance zone around the 3,319 level.
This resistance is notable for two reasons: it represents a horizontal level tested multiple times, and it coincides with a descending trendline, forming a confluence that increases the probability of a price rejection. This dual-resistance scenario presents a compelling case for a short entry.
A sell position was initiated near this resistance area. The stop loss is placed above the resistance zone, near 3,325, to protect against a breakout. The take profit is set around 3,301, targeting a recent support level established by a strong previous low. This provides a clean technical target within the current structure.
Supporting this trade idea, both the MACD and Stochastic Oscillator are showing overbought signals and have begun turning downward, suggesting weakening bullish momentum and the potential for a bearish reversal.
The trade offers a risk-to-reward ratio of approximately 1:1.97, which is considered favorable in scalping strategies, where precision and timing are critical.
XAUUSD: Channel Up aiming for 3,750Gold has turned bullish again on its 1D technical outlook (RSI = 65.582, MACD = 62.840, ADX = 38.882) as it crossed above the 4H MA50 again, following a bottom on the HL trendline of the 4H Channel Up. The 4H RSI made a DB and the new bullish wave is already underway. We expect a similar +18% rally to the top of the Channel Up (TP = 3,750).
## If you like our free content follow our profile to get more daily ideas. ##
## Comments and likes are greatly appreciated. ##

XAUUSD:You can make profits by shorting during the rebound.At present, the gold market is fluctuating downward, presenting many trading opportunities. You can make profits by shorting during the rebound.
I am committed to sharing trading signals every day. Among them, real-time signals will be flexibly pushed according to market dynamics. All the signals sent out last week accurately matched the market trends, helping numerous traders achieve substantial profits. Regardless of your previous investment performance, I believe that with the support of my professional strategies and timely signals, I will surely be able to assist you in breaking through investment bottlenecks and achieving new breakthroughs in the trading field.

gold analysisINSHA ALLAH GOLD will touch 3353 when gaining some pips then breakeven entry and hold to tp
GOLD WEEKLY CHART MID/LONG TERM ROUTE MAPHey Everyone,
Quick update on our weekly chart idea, it's been playing out beautifully, helping us track the move down and catch the move back up.
The weekly chart structure is unfolding in line with prior analysis. Price action reached the upper boundary of the ascending Goldturn channel and temporarily broke above it; however, the EMA5 remained confined within the channel, validating the upper trendline as dynamic resistance.
A sustained EMA5 breakout above the channel would have confirmed a potential continuation of the breakout. Currently, price is consolidating within the Goldturn channel, with the 3189 level acting as immediate support. The channel half line of the channel may serve as a stronger swing support area, though price may not retest this level immediately. As the channel continues its upward trajectory, the midline will also rise, potentially aligning with price in future upward movements.
This is the beauty of our Goldturn channels, drawn using weighted averages instead of pure price action. This unique approach helps us clearly identify fake-outs and real breakouts, cutting out much of the noise that usually confuses traders.
Moving forward, we’ll focus on smaller timeframes (1H and 4H) to buy dips off the weighted Goldturns, aiming for clean 30–40 pip moves. Ranging markets are perfect for this style, allowing us to capitalize on quick moves without getting caught in the chop of larger swings.
Thanks again for all your likes, comments, and follows, we really appreciate the support!
Mr Gold
GoldViewFX

Bears are active at the beginning of the week, prices are down⭐️GOLDEN INFORMATION:
The United States and China announced “substantial progress” following two days of trade negotiations in Switzerland, marking a potential turning point in efforts to ease tensions between the world’s two largest economies. Chinese Vice Premier He Lifeng characterized the discussions as “an important first step” toward stabilizing bilateral trade, while US Treasury Secretary Scott Bessent echoed the sentiment, noting meaningful advancements were made. The US is expected to release more details about the outcome of the talks on Monday.
While signs of progress may dampen demand for safe-haven assets like gold, lingering uncertainty around the specifics of any deal could still lend some support to the precious metal. “Ongoing ambiguity surrounding tariffs remains one of the most influential factors sustaining gold,” noted David Meger, Director of Metals Trading at High Ridge Futures.
⭐️Personal comments NOVA:
The short-term downtrend is maintained, gold price accumulates around 3300 and continues to go down to lower support zones.
⭐️SET UP GOLD PRICE:
🔥SELL GOLD zone : 3315- 3317 SL 3322
TP1: $3300
TP2: $3290
TP3: $3280
🔥BUY GOLD zone: $3223 - $3225 SL $3218
TP1: $3238
TP2: $3245
TP3: $3260
⭐️Technical analysis:
Based on technical indicators EMA 34, EMA89 and support resistance areas to set up a reasonable sell order.
⭐️NOTE:
Note: Nova wishes traders to manage their capital well
- take the number of lots that match your capital
- Takeprofit equal to 4-6% of capital account
- Stoplose equal to 2-3% of capital account

Will gold fall after encountering resistance at its high point?Planning your trading is the prerequisite for making profits. The essence of the market is the cycle of highs and lows, alternating ups and downs, and the essence of trading is to grasp the relative highs and lows in the market and snipe valuable trading opportunities. This value has only two points: first, probability, and second, space.
After the gold price rose, we will analyze the trend of it correcting from the high to 3200. The key position of this rebound, that is, the 618 position, is near 3386. The gold price encountered resistance here in the morning. So technically this suppression can be used as a key reference for the future market. Today in the Asian session, we will first observe the support situation of 3350. If it breaks down, then before the interest rate decision in the early hours of Thursday, we will pay attention to whether the gold price can stand firmly above 3272. If this position is not stable, then the second half of the week will still be a downtrend. This wave of rise can only be regarded as a rebound repair, not a bull return (the premise is that 3386 above must not be broken).
Today's gold short-term operation ideas suggest that rebounding is the main focus, and callbacks are supplemented by longs. The upper short-term focus is on the 3386-3390 first-line resistance, and the lower short-term focus is on the 3320-3300 first-line support. All friends must keep up with the rhythm.
Short position strategy:
Strategy 1: Short 20% of the gold position in batches when it rebounds to around 3380-3385, stop loss 6 points, target around 3350-3330, and look at 3320 if it breaks;
Long position strategy:
Strategy 2: Long 20% of the gold position in batches when it pulls back to around 3315-3320, stop loss 6 points, target around 3340-3360, and look at 3380 if it breaks;

XAUSD FOMC - Gold Sniper Plan - May 7 - 2025💥 XAUUSD FOMC Sniper Plan – May 7, 2025
"We Don’t Chase Breakouts. We Build the Trap Before the Noise."
🌍 Macro & Geopolitical Context – What Really Matters Today
Markets are frozen in anticipation of tonight’s FOMC bombshell:
📌 20:00 UTC – FOMC Statement & Rate Decision
📌 20:30 UTC – Powell Speaks
Traders are split. Some expect a dovish tone to push gold through ATH. Others brace for a hawkish surprise.
But let’s get one thing straight:
Gold has already run thousands of pips. It doesn’t need help going higher — it needs a reason not to collapse.
That’s what Powell holds in his hands tonight.
Meanwhile, geopolitics stay hot in the background:
Middle East tensions simmer (again).
Trump pressure on Powell to step down adds political risk.
Global yields are compressing → gold remains macro-favored.
This is not a time for guessing. This is a time for traps.
🧠 Current Structure Snapshot (Price: 3431)
HTF is still bullish, but we're extended.
Last confirmed HH = 3488, with ATH = 3500
We're in a short-term retrace under a H4 CHoCH → excellent sniper conditions.
🧱 Key Structural Levels
Zone Type Price Range Context
🔼 R2 3488–3495 Last HH OB + extension sweep trap
🔼 R1 3448–3455 H4 OB + liquidity pocket under HH
🔽 S1 3378–3384 H4 OB + FVG + EMA 50 confluence
🔽 S2 3333–3340 D1 OB + CHoCH + imbalance zone
We don't use FIBO extensions for guessing entries. We use them to target the crowd who does:
Extension Price Range Use
1.272 3530–3535 TP3 only
1.618 3575–3580 Final exhaustion area
🎯 Sniper Setups – Real, Refined, Ruthless
🟢 Buy #1 – 3378–3384
Valid H4 OB
FVG tail fill + internal liquidity
RSI around 40 + EMA 50 bounce
SL: 3365
TP1: 3405 | TP2: 3430 | TP3: 3455
🧠 Our first reaction zone before news madness.
🟢 Buy #2 – 3333–3340
D1 OB + imbalance
Clean internal liquidity from 3300–3330
Confluence with CHoCH base
SL: 3315
TP1: 3370 | TP2: 3405 | TP3: 3448
💎 This zone is invisible to retail — perfect trap before spike.
🔴 Sell #1 – 3448–3455
H4 OB at premium
EMA rejection + FVG close
Pre-news stop hunt ideal here
SL: 3462
TP1: 3430 | TP2: 3405 | TP3: 3385
🎯 Don’t short gold randomly — short it here, where retail longs trap themselves.
🔴 Sell #2 – 3488–3495
Last HH OB before ATH
Strong fibo ext confluence
Sweeps = liquidity + exhaustion
SL: 3504
TP1: 3465 | TP2: 3430 | TP3: 3395
If they want to break ATH before Powell, we’ll be waiting above it.
⚙ EMAs in Sync
EMA Signal
21 Tested from below — sell confluence at 3448
50 Lining up near Buy #1
200 Far below — macro still bullish
🧠 Execution Plan
Stay flat before FOMC unless setups trigger with PA confluence
Anticipate whipsaws → SLs must be respected
If price consolidates above 3455 = bullish continuation likely
If it sweeps 3448–3455 and rejects = sell of the week
Drop a 🚀 and follow us: if you’re not trading emotion — you’re trading execution.
📌 Important Notice!!!
The above analysis is for educational purposes only and does not constitute financial advice. Always compare with your plan and wait for confirmation before taking action.

3419 , gold price can reach today⭐️GOLDEN INFORMATION:
Gold price (XAU/USD) pulls back slightly from its intraday peak near a two-week high reached during Tuesday’s Asian session, but remains firm around the $3,360 mark, extending its winning streak for a second day. Improved US economic data has helped temper recession fears, offering modest support to the US Dollar. Meanwhile, signs of a potential thaw in US-China trade tensions have curbed safe-haven demand for gold, prompting some investors to adopt a wait-and-see approach ahead of the highly anticipated two-day FOMC policy meeting.
⭐️Personal comments NOVA:
Bulls regain the upper hand, uptrend nears 3400 ahead of market interest rate cut expectations
⭐️SET UP GOLD PRICE:
🔥SELL GOLD zone : 3418- 3420 SL 3425
TP1: $3410
TP2: $3400
TP3: $3385
🔥BUY GOLD zone: $3323 - $3321 SL $3316
TP1: $3330
TP2: $3340
TP3: $3358
⭐️Technical analysis:
Based on technical indicators EMA 34, EMA89 and support resistance areas to set up a reasonable BUY order.
⭐️NOTE:
Note: Nova wishes traders to manage their capital well
- take the number of lots that match your capital
- Takeprofit equal to 4-6% of capital account
- Stoplose equal to 2-3% of capital account

DeGRAM | GOLD Finished Correcting?📊 Technical Analysis
● After two successful touches of rising-channel support near $3 200, XAU/USD pierced the resistance line and the triangle, confirming a bullish breakout.
● A pattern of higher lows now projects a fresh impulse toward the channel top at ~$3 500.
💡 Fundamental Analysis
● Goldman Sachs forecasts central banks will keep buying bullion amid recession fears, driving gold to $3 700 by year-end.
● Traders price in ~80 bp of Fed rate cuts from July, lowering real yields and bolstering gold’s appeal.
✨ Summary
Channel breakout + strong CB demand and Fed-cut bets support a short-term long bias: a clear break above $3 315 targets $3 500; view invalid below $3 200.
-------------------
Share your opinion in the comments and support the idea with a like. Thanks for your support!

GOLD MARKET ANALYSIS AND COMMENTARY - [May 12 - May 16]This week, the international OANDA:XAUUSD increased from 3,210 USD/oz to 3,434 USD/oz, but immediately after that, the gold price dropped sharply to 3,274 USD/oz and closed this week at 3,325 USD/oz.
The reason why the gold price was sold off at the end of the week was because the FED said it would not rush to cut interest rates, because inflation is potentially at risk of increasing due to the impact of tariffs from the Trump administration, while the US economy, especially the labor market, is also at risk of decline. This risks pushing the US economy into a state of stagflation.
In addition, after the US and UK reached a trade agreement, the US side said that there will be more trade agreements with major economies in the near future. Notably, this weekend, the US and China also entered the first round of trade negotiations under President Trump in his second term in Switzerland. This has made many investors concerned that the cooling of the trade war will reduce the role of gold as a safe haven.
Factors affecting gold prices next week:
Federal Reserve (Fed) policy: The Fed currently keeps interest rates at 4.25% - 4.5%, and the market is waiting for new economic data (such as May CPI and employment report). If inflation continues to decline or there are signs that the Fed will cut interest rates in the near future, gold prices may be strongly supported. On the contrary, if the Fed maintains a "hawkish" stance (keeping interest rates high), gold prices may be under downward pressure.
US-China trade negotiations: Optimism about the possibility of a trade agreement between the US and China (expected to be negotiated in Switzerland) is reducing the demand for safe haven gold. If there is positive news (forecast: tax reduction from 145% to 80%), gold prices may adjust down. On the contrary, if negotiations fail or tensions escalate, gold will increase sharply.
Global instability: Geopolitical risks (such as Middle East conflicts, Russia-Ukraine tensions, India-Pakistan tensions) are still the driving force supporting gold prices. If there are unexpected developments, gold demand will increase.
📌Technically, gold prices next week are likely to fluctuate within the range of 3,200 - 3,400 USD/ounce, with the base scenario being sideways or slightly increasing. If gold breaks the trendline and surpasses the resistance level of 3435, the next level is that gold can conquer the old peak or create a new high. Meanwhile, if the support level of 3200 is broken, gold prices are at risk of falling deeply below the threshold of 3,100 USD/oz. However, factors such as US economic data, Fed policy, and developments in US-China negotiations will be the key to determining the trend. Investors need to closely monitor these events and apply flexible trading strategies.
Notable technical levels are listed below.
Support: 3,300 – 3,292 – 3,267USD
Resistance: 3,351 – 3,371USD
SELL XAUUSD PRICE 3402 - 3400⚡️
↠↠ Stop Loss 3406
BUY XAUUSD PRICE 3215 - 3217⚡️
↠↠ Stop Loss 3211

XAUUSD top-down analysisHello traders, this is a complete multiple timeframe analysis of this pair. We see could find significant trading opportunities as per analysis upon price action confirmation we may take this trade. Smash the like button if you find value in this analysis and drop a comment if you have any questions or let me know which pair to cover in my next analysis.

Gold Trade Plan 07/05/2025Dear Traders,
after False break of Side Range price break top of Range,
The price is hitting the support at 3360-3370(pullback) and the move is continuing.
Momentum of Bullish movement is very Good , i expect price will be continue Uptrend to 3480
If you enjoyed this forecast, please show your support with a like and comment. Your feedback is what drives me to keep creating valuable content."
Regards,
Alireza

Bullish bounce off 61.8% Fibonacci support?XAU/USD is falling towards the support level, which is a pullback support that aligns with the 61.8% Fibonacci retracement and could bounce from this level to our take profit.
Entry: 3,169.91
Why we like it:
There is a pullback support level that lines up with the 61.8% Fibonacci retracement.
Stop loss: 3,115.17
Why we like it:
There is a pullback support level that lines up with the 138.2% Fibonacci extension.
Take profit: 3,276,58
Why we like it:
There is a pullback resistance level.
Enjoying your TradingView experience? Review us!
Please be advised that the information presented on TradingView is provided to Vantage (‘Vantage Global Limited’, ‘we’) by a third-party provider (‘Everest Fortune Group’). Please be reminded that you are solely responsible for the trading decisions on your account. There is a very high degree of risk involved in trading. Any information and/or content is intended entirely for research, educational and informational purposes only and does not constitute investment or consultation advice or investment strategy. The information is not tailored to the investment needs of any specific person and therefore does not involve a consideration of any of the investment objectives, financial situation or needs of any viewer that may receive it. Kindly also note that past performance is not a reliable indicator of future results. Actual results may differ materially from those anticipated in forward-looking or past performance statements. We assume no liability as to the accuracy or completeness of any of the information and/or content provided herein and the Company cannot be held responsible for any omission, mistake nor for any loss or damage including without limitation to any loss of profit which may arise from reliance on any information supplied by Everest Fortune Group.

GOLD DAILY CHART ROUTE MAP UPDATEHey Everyone,
Here’s the latest update on our daily chart idea, it’s been playing out perfectly!
The daily chart is unfolding as projected, with price action respecting the structure of the Goldturn ascending channel. A breakout above the channel was confirmed by the EMA5 crossing and closing above the upper boundary. This move extended to test the 3433 Goldturn axis level, where price met resistance. Notably, EMA5 failed to sustain a close above 3433 Goldturn level, confirming a lack of bullish momentum and validating a rejection. Price has since reversed, re-entering the channel.
Below, broader support is identified around 3104, which aligns with the channel’s half line. While this level may not be reached immediately, the current price range between 3297 and 3104 is significant. We may observe continued consolidation within this zone, with the half line gradually ascending. This dynamic could result in price interacting with the half line earlier than a direct move to 3104, providing potential bounce opportunities best monitored through lower timeframes for refined entries and validations.
This is the beauty of our Goldturn channels, drawn using weighted averages instead of pure price action. This unique approach helps us clearly identify fake-outs and real breakouts, cutting out much of the noise that usually confuses traders.
Moving forward, we’ll focus on smaller timeframes (1H and 4H) to buy dips off the weighted Goldturns, aiming for clean 30–40 pip moves. Ranging markets are perfect for this style, allowing us to capitalize on quick moves without getting caught in the chop of larger swings.
Thank you all again for your continued likes, comments, and follows, we truly appreciate your support!
Mr Gold
GoldViewFX

Gold latest strategy analysis- Completed " 12345 " Impulsive Waves and " AB " Corrective Waves
- Break of Structure
- RSI - Divergence
- Consolidation Phase
- Bearish Channel as an corrective pattern in Short Time Frame

Will gold fall after encountering resistance at its high point?Gold surged after opening yesterday. Although it retreated slightly, it continued to maintain its strong pace. So far, it has reached 3386, with an increase of about 150 US dollars. 3386 is a short-term suppression level. If it breaks below 3350 in the Asian session, the steady idea is to wait for a rebound and then short it to see the downward trend. The focus below is on the support of 3272. Overall, the short-term operation strategy for gold is to short on rebounds and to buy on pullbacks. The short-term focus on the upper side is 3386-3390 resistance, and the short-term focus on the lower side is 3320-3300 support.
Strategy: Short gold in batches around 3380-3385 when it rebounds, stop loss at 3391, target around 3350-3330, break to target 3320

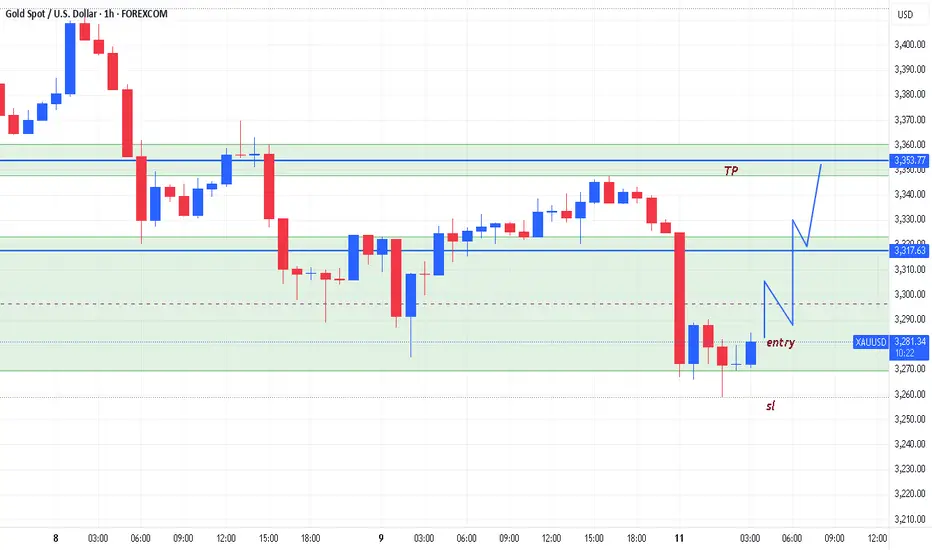
XAU wait to enterMy vision where going price next wek.
Important area 3290 if break it down price will fall to 3200 and lower.

Interest rates, will gold prices fall sharply today?⭐️GOLDEN INFORMATION:
However, US Dollar bulls appear cautious, holding back from making bold moves as they await clearer signals regarding the Federal Reserve’s (Fed) future rate-cut trajectory. This wait-and-see stance, combined with ongoing geopolitical tensions—particularly the prolonged Russia-Ukraine conflict and unrest in the Middle East—continues to bolster demand for safe-haven assets like gold. As such, investors are likely to remain on the sidelines until the conclusion of the closely watched two-day FOMC policy meeting on Wednesday.
⭐️Personal comments NOVA:
Gold price awaits today's interest rate result, there was a good recovery above 3400 but then fell immediately after, showing that the market is not ready for the first interest rate cut if any, gold price may face strong selling pressure today
⭐️SET UP GOLD PRICE:
🔥SELL GOLD zone : 3438- 3440 SL 3445
TP1: $3425
TP2: $3410
TP3: $3395
🔥SELL GOLD zone : 3396- 3398 SL 3402 scalping
TP1: $3390
TP2: $3380
TP3: $3365
🔥BUY GOLD zone: $3308 - $3306 SL $3301
TP1: $3315
TP2: $3330
TP3: $3345
⭐️Technical analysis:
Based on technical indicators EMA 34, EMA89 and support resistance areas to set up a reasonable sell order.
⭐️NOTE:
Note: Nova wishes traders to manage their capital well
- take the number of lots that match your capital
- Takeprofit equal to 4-6% of capital account
- Stoplose equal to 2-3% of capital account
