Gold Daily Sniper Plan - XAUUSD May 9🔹 XAUUSD – Daily Sniper Plan | May 9, 2025
🎯 Precision Mode: Activated. No recycled zones. Only real-time flow.
🧠 Macro Context:
• Market digested FOMC + Powell ✅
• Price dipped into 3284 sniper zone (✅ Reaction Confirmed)
• Asia printed fresh CHoCH from discount → Now retesting
• Bias: HTF bullish — LTF shift confirmed after deep mitigation
• Today = Thursday → Keep eyes on volume traps before NY
🔍 Structure Summary:
• D1–H4: Bullish trend intact, reaction from strong OB near 3284
• H1–M15: Internal BOS + CHoCH + FVGs filled, clean transition
• Major HL defended. New short-term HH printed → demand forming below.
🔻 SELL SETUPS (only from premium)
1. Sell Setup 1 – Premium FVG Trap
📍 Zone: 3348–3354
🎯 Confluence: M15 imbalance + weak high + LTF CHoCH area
🛑 SL: 3362
TP1: 3335
TP2: 3318
TP3: 3304
2. Sell Setup 2 – Extreme Supply + Liquidity
📍 Zone: 3382–3390
🎯 Confluence: Unmitigated M30 OB + Equal highs + HTF inefficiency
🛑 SL: 3401
TP1: 3360
TP2: 3335
TP3: 3310
🟢 BUY SETUPS (only after confirmation)
1. Buy Setup 1 – CHoCH Retest + OB
📍 Zone: 3303-3310
🎯 Confluence: M15 OB + previous CHoCH + demand reaction
🛑 SL: 3292
TP1: 3324
TP2: 3340
TP3: 3354
2. Buy Setup 2 – Deep Discount Sniper Zone
📍 Zone: 3284–3292
🎯 Confluence: H4 OB + FVG + 61.8% FIB retracement
🛑 SL: 3268
TP1: 3310
TP2: 3333
TP3: 3350
Bias Today: HTF bullish | LTF flipped bullish after Asian CHoCH
Scalps and reentries only from refined zones. No countertrend unless clear CHoCH/weak high is grabbed.
💬 Note:
Don’t buy or sell from the middle of nowhere. Wait for price to deliver to the zones. If price flies without you? That’s not your train. You’re waiting at your sniper station.
👇 Like the plan?
Drop a 🚀 Follow, comment, and share with your trading crew — let’s build the sharpest Gold team on TradingView
📌 Important Notice!!!
The above analysis is for educational purposes only and does not constitute financial advice. Always compare with your plan and wait for confirmation before taking action.
XAUUSD trade ideas
Gold bulls are comingJudging from the golden hourly chart, the Asian market is in line with a continued surge of gains. It adjusted to the 10 moving average of 3350 in the afternoon and stabilized. The European market slowly moved higher and approached the high point of the Asian market. This pattern is still very strong, and there is a high probability of a second rise; The 10 EMA is above 3370 as the primary support and continues to be bullish. As each line closes, the EMA support will slowly move upward. As long as it does not effectively break, the short squeeze will be maintained. A breakthrough of 3400 will also occur at any time. If it breaks through, it is easy to continue to storm above 3420. If it rises and falls and falls below the 10 EMA, then If it adjusts to the mid-track for the first time, there will still be good support, just continue to be bullish; comprehensively, in the short-term operation of gold, it is recommended to focus on callbacks and longs, supplemented by rebounds and shorts. The upper short-term focus is on the 3420-3430 first-line resistance, and the lower short-term focus is on the 3365-3370 first-line support.

GOLD XAUUSD Trade Plan for coming week Chart Analysis Overview:
🔹 Key Level: 3280-3270
> This level acts as the decision point for the next move.
> The price is currently hovering just above it, making it crucial for short-term direction.
📉 Bearish Scenario (Sell Setup)
Trigger: Break below 3270
: Entry Zone: Around or shortly after the break
Targets:
>> TP1: 3225 <<
>> Final TP: 3200 <<
A clean break below 3270 indicates bearish momentum and could signal continuation to the downside, aligning with the previous low structure.
✅ Notes:
Enter only after a 1H candle closes below 3270.
Watch for a possible retest of 3270 as resistance before the drop.
📈 Bullish Scenario (Buy Setup)
: Trigger: Price holds above 3270 and forms a higher low.
: Pattern Forecasted: A retracement followed by an impulse wave upward.
: Targets:
>> TP1: 3350
>> Final TP: 3400
Rationale: If support holds at 3270, a reversal pattern is expected, targeting the previous resistance areas.
✅ Notes:
Look for bullish candlestick patterns (e.g., engulfing, hammer) near 3270.
Avoid chasing if the price shoots up without a clean pullback.

Fibonacci Confluence Fuels Gold’s Next Rally: Wave (Y) InsightThis 4-hour chart of XAU/USD is showcasing a WXY corrective pattern, a classic double zigzag (W)-(X)-(Y) correction after a strong impulsive move
Wave (W) has topped, marking the end of the first corrective leg.
A deep correction into the 0.5 Fibonacci retracement level occurred with wave (X), forming a potential higher low within the red demand zone.
Now, wave (Y) is anticipated, which typically mirrors or slightly exceeds the length of wave (W) but in a more corrective format.
Target 1: 3292.629
Target 2: 3372.161
Stop loss: 3201.955

Start going long on goldAt present, the trend of gold is relatively calm, but as gold rebounds, a certain support strength has been shown below; and the short-term negative news has all appeared, and gold needs to rebound at the technical level. Therefore, I think we can try to go long on gold in small batches in the current area of 3230-3220, and expect gold to continue to rebound to the 3250-3260 area, or even the 3280-3290 area.
Trading strategy:
Try to start going long on gold in small batches in the 3230-3220 area; TP: 3250-3255

Gold Updates before NY - XAUUSD Tuesday May 6, 2025GOLDMINDSFX | XAUUSD 1H Updated Probable set-ups
Current Price: 3379 | 6 May 2025
Gold plays games. We play levels.
HIGH-PROBABILITY SELL REACTION ZONES (listed lowest to highest)
🔴 3382–3387 ⚠️
Trigger: 5M CHoCH + M-pattern
Note: This is a liquidity tap zone where price may react sharply. Quick reaction expected — not a trend changer.
Confidence: ⚠️ Short-term scalp opportunity with structure rejection
🔴 3404–3410
Trigger: LTF rejection + BOS
Note: Classic reversal zone after sweeping major liquidity. If we reject here, this may offer the best structured sell of the day.
Confidence: Strong structure-based sell zone
🔴 3425–3432 ❄️
Trigger: 1M CHoCH or sweep + engulfing
Note: Final institutional sweep zone above the visible range. If price pushes here without rejection, we wait. If it rejects, this is the sniper zone.
Confidence: ❄️ High-risk, high-reward level — confirmation mandatory
HIGH-PROBABILITY BUY REACTION ZONES (listed lowest to highest)
🟢 3303–3310
Trigger: 5M CHoCH + rejection wick
Note: Clean origin of bullish structure with unmitigated demand. If price returns, this may offer a strong long with confluence.
Confidence: Solid demand zone aligned with structure
🟢 3333–3340 ⚠️
Trigger: 1M CHoCH + wick rejection
Note: Riskier buy zone near premium — only valid with strong confirmation. Can become liquidity before deeper drop.
Confidence: ⚠️ Caution advised — use only with clear LTF reversal signs
FINAL STRATEGY
Sell interest builds heavily between 3382–3432 — structured reactions expected at key levels
Buy interest valid only below 3340 — anything higher is impulsive
No confirmation = no entry — we trade structure, not feelings
📌 Important Notice!!!
The above analysis is for educational purposes only and does not constitute financial advice. Always compare with your plan and wait for confirmation before taking action.

XAU/USD) Bullish trand line analysis Read The ChaptianSMC Trading point update
Technical analysis of Gold Spot (XAUUSD) on the 4-hour timeframe, featuring key support and resistance levels, price action projections, and RSI for momentum evaluation. Here's a breakdown of the idea:
Key Points in the Analysis:
1. Support & Resistance Zones:
Big Support / Buying Zone: Around 3,222 – 3,240. This zone has seen previous bullish reversals and is supported by the 200 EMA.
Intermediate Support Level: Around 3,270–3,290, where price might bounce before attempting a breakout.
Key Resistance Level: Around 3,350–3,365. Price must break this area to move toward higher targets.
2. Price Action Projections:
The analysis shows two bullish potential scenarios:
Scenario 1: Price breaks above the resistance level directly and moves toward the target point at 3,535.83.
Scenario 2: A retracement to the lower support or even the big buying zone before a bullish rally to the same target.
3. RSI (Relative Strength Index):
Currently near the neutral zone (around 49), suggesting there's room for movement in either direction.
No extreme overbought/oversold signals right now.
4. EMA (200):
The price is currently hovering above the 200 EMA (3,222.01), which acts as a long-term support and trend indicator.
Mr SMC Trading point
Summary of the Trading Idea:
Bias: Bullish
Entry Zones: Look for long entries at either the support level (3,270–3,290) or lower buying zone (around 3,222).
Target: 3,435.05 initially, then 3,535.83.
Invalidation: A clear breakdown below the 3,222 support level could invalidate the bullish bias.
Pelas support boost 🚀 analysis follow)

How to operate after gold price plummets?At the short-term 4-hour level, pay attention to the upper resistance of the MA5 moving average at 3260. As a weak adjustment trend, the 5-day moving average will often continue to suppress, and then go up to the 10-day moving average, which is too far away, equivalent to washing back within the day; therefore, temporarily pay attention to 3260-3200; today the European session broke the bottom, and the U.S. session generally has a second suppression, so wait until the second suppression is still stable around 3200, and then choose to make a wave of oversold rebound; in terms of operation ideas, if it rebounds first, the top and bottom resistance area of 3250-3260 will be short for a second decline; if the lower 3200 is not broken, enter the market in batches and gradually look up.

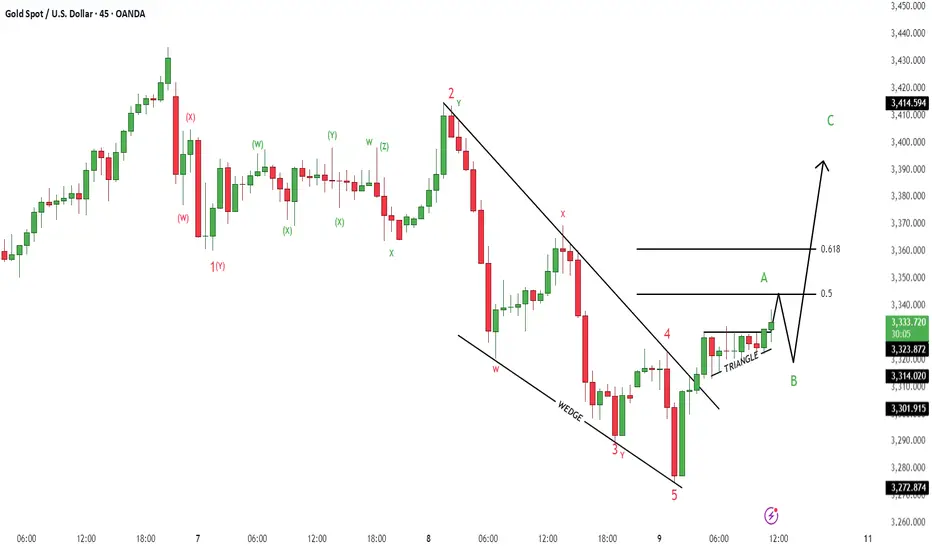
GoldXAUUSD
- Ascending Triangle in Short Time Frame
- Change of Characteristics
- Completed " 12345 " Impulsive Waves
- Falling Wedge as an corrective pattern in Long Time Frame
- Fibonacci Level - 50.00% / 61.80%
XAUUSD H4 | Bearish Continuation Based on the H4 chart, the price is rising toward our sell entry level at 3344.40, a pullback resistance.
Our take profit is set at 4365.47. a pullback support that aligns close to the 78.6% Fibo retracement.
The stop loss is set at 3381.54, above a swing high resistance.
High Risk Investment Warning
Trading Forex/CFDs on margin carries a high level of risk and may not be suitable for all investors. Leverage can work against you.
Stratos Markets Limited (tradu.com):
CFDs are complex instruments and come with a high risk of losing money rapidly due to leverage. 63% of retail investor accounts lose money when trading CFDs with this provider. You should consider whether you understand how CFDs work and whether you can afford to take the high risk of losing your money.
Stratos Europe Ltd (tradu.com):
CFDs are complex instruments and come with a high risk of losing money rapidly due to leverage. 63% of retail investor accounts lose money when trading CFDs with this provider. You should consider whether you understand how CFDs work and whether you can afford to take the high risk of losing your money.
Stratos Global LLC (tradu.com):
Losses can exceed deposits.
Please be advised that the information presented on TradingView is provided to Tradu (‘Company’, ‘we’) by a third-party provider (‘TFA Global Pte Ltd’). Please be reminded that you are solely responsible for the trading decisions on your account. There is a very high degree of risk involved in trading. Any information and/or content is intended entirely for research, educational and informational purposes only and does not constitute investment or consultation advice or investment strategy. The information is not tailored to the investment needs of any specific person and therefore does not involve a consideration of any of the investment objectives, financial situation or needs of any viewer that may receive it. Kindly also note that past performance is not a reliable indicator of future results. Actual results may differ materially from those anticipated in forward-looking or past performance statements. We assume no liability as to the accuracy or completeness of any of the information and/or content provided herein and the Company cannot be held responsible for any omission, mistake nor for any loss or damage including without limitation to any loss of profit which may arise from reliance on any information supplied by TFA Global Pte Ltd.
The speaker(s) is neither an employee, agent nor representative of Tradu and is therefore acting independently. The opinions given are their own, constitute general market commentary, and do not constitute the opinion or advice of Tradu or any form of personal or investment advice. Tradu neither endorses nor guarantees offerings of third-party speakers, nor is Tradu responsible for the content, veracity or opinions of third-party speakers, presenters or participants.

Gold XAUUSD Possible Move 📊 SMC Analysis + Trade Signal
Market Structure Overview:
Accumulation: led to strong bullish rally from 3330 to 3435.
Distribution: Multiple liquidity sweeps between 3365-3394
Breakdown: Clean BoS confirms bearish shift from distribution.
Current Action: Liquidity grab at bottom 3320/30 likely a retracement.
🔔 Trade Signal: SHORT
Entry: 3,360 – 3,370 (pullback to supply zone)
Stop Loss: Above 3,380 (last swing high)
Take Profit:
TP1: 3,340
TP2: 3,320
Bias: Bearish
Reason: Distribution + BoS + Pullback to premium
Show your support by hitting follow, support, and boost.

XAU/USD For Bearish as pull-backwait for pull-back near by entry point and then go short
general trend is up trend
current phase is pull-back
Gold under pressure
have fun :)

XAUUSD Analysis todayHello traders, this is a complete multiple timeframe analysis of this pair. We see could find significant trading opportunities as per analysis upon price action confirmation we may take this trade. Smash the like button if you find value in this analysis and drop a comment if you have any questions or let me know which pair to cover in my next analysis.

How to layout gold as Sino-US trade eases🗞News side:
1. China-US trade relations eased, suspending some tariffs and countermeasures
2. Russia and Ukraine suspended firing for 30 days, and the India-Pakistan conflict was temporarily mediated
📈Technical aspects:
Affected by the easing of Sino-US economic and trade relations, coupled with the fact that the Russian-Ukrainian negotiations are on the right track and India and Pakistan have suspended firing, the risk aversion sentiment in the gold market has eased, and the gold price has fallen sharply since the opening today. At present, the 3200 line has formed an important short-term support. If the support effect is strong at this point, the gold price may rebound further; if it falls below this key support, it will accelerate the opening of downward space. The upper 3250-3260 is the previous intensive trading area, which will pose a certain pressure in the short term. At the top of the European market, focus on the resistance range of 3250-3260, and at the bottom, the support range is 3210-3200.
🎁BUY 3200-3210
🎁TP 3250-3260
🎁 SELL 3260-3270
🎁 TP 3250-3230
If you agree with this view, or have a better idea, please leave a message in the comment area. I look forward to hearing different voices.
FOREXCOM:XAUUSD FXOPEN:XAUUSD TVC:GOLD FX:XAUUSD OANDA:XAUUSD

GOLD Free Signal! Sell!
Hello,Traders!
GOLD made a retest of
The local horizontal resistance
Of 3348$ and is alreaady
Making a local pullback
So despite our long-term
Bullish bias we will go short
With the Take Profit of 3297$
And the Stop Loss of 3372$
Sell!
Comment and subscribe to help us grow!
Check out other forecasts below too!
Disclosure: I am part of Trade Nation's Influencer program and receive a monthly fee for using their TradingView charts in my analysis.

XAUUSD H4 Bullish Bounce Based on the H4 chart analysis, the price is falling toward our buy entry level at 3267.47, a pullback support that aligns close to the 78.6% Fibonacci retracement.
Our take profit is set at 3352.49, a pullback resistance.
The stop loss is placed at 3202.42, a swing low support.
High Risk Investment Warning
Trading Forex/CFDs on margin carries a high level of risk and may not be suitable for all investors. Leverage can work against you.
Stratos Markets Limited (tradu.com):
CFDs are complex instruments and come with a high risk of losing money rapidly due to leverage. 63% of retail investor accounts lose money when trading CFDs with this provider. You should consider whether you understand how CFDs work and whether you can afford to take the high risk of losing your money.
Stratos Europe Ltd (tradu.com):
CFDs are complex instruments and come with a high risk of losing money rapidly due to leverage. 63% of retail investor accounts lose money when trading CFDs with this provider. You should consider whether you understand how CFDs work and whether you can afford to take the high risk of losing your money.
Stratos Global LLC (tradu.com):
Losses can exceed deposits.
Please be advised that the information presented on TradingView is provided to Tradu (‘Company’, ‘we’) by a third-party provider (‘TFA Global Pte Ltd’). Please be reminded that you are solely responsible for the trading decisions on your account. There is a very high degree of risk involved in trading. Any information and/or content is intended entirely for research, educational and informational purposes only and does not constitute investment or consultation advice or investment strategy. The information is not tailored to the investment needs of any specific person and therefore does not involve a consideration of any of the investment objectives, financial situation or needs of any viewer that may receive it. Kindly also note that past performance is not a reliable indicator of future results. Actual results may differ materially from those anticipated in forward-looking or past performance statements. We assume no liability as to the accuracy or completeness of any of the information and/or content provided herein and the Company cannot be held responsible for any omission, mistake nor for any loss or damage including without limitation to any loss of profit which may arise from reliance on any information supplied by TFA Global Pte Ltd.
The speaker(s) is neither an employee, agent nor representative of Tradu and is therefore acting independently. The opinions given are their own, constitute general market commentary, and do not constitute the opinion or advice of Tradu or any form of personal or investment advice. Tradu neither endorses nor guarantees offerings of third-party speakers, nor is Tradu responsible for the content, veracity or opinions of third-party speakers, presenters or participants.

Gold intraday trading strategy.From the 4-hour analysis, the support below is around 3280. If it does not break, the main bullish trend will remain unchanged. The upper side pays attention to the short-term suppression of 3334-40. The daily level maintains a high-altitude and low-multiple rhythm.
Gold operation strategy:
1. Short gold rebounds at 3334-40, and shorts at 3358-65. Stop loss at 3373, target 3300-3308, and continue to hold if it breaks;

Gold Short I think gold is heading again toward 3350$ region where i am willing to add on to short positions.
My next short term area for gold is 3295$ .
This is another great R:R setup.


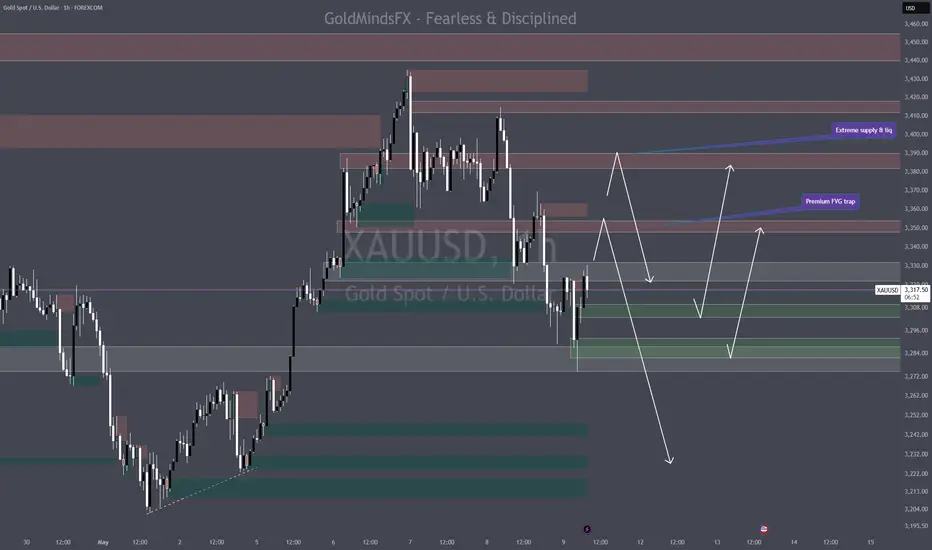
Sub 3k ond Gold soon?Gold continues to get rejected off inverted FvGs, all while grinding inside the turning area—and from where I’m standing, the top looks locked in.
We’re now heading straight down the pink ABC structure, with targets lining up at $3,000 and lower. The first major resistance on this descent is marked in white—a critical level to watch.
If we see a strong bullish bounce there, perfect—that’s our chance to scale into a bigger short position with precision.
The tide’s turning. Don’t fight the flow.

0429 4H TRADING OPPORTUNITY FOR GOLDHello traders,
The seven major U.S. stock markets are no longer in the limelight, and the market is facing a major test
Even after the past week's rally, the Big Seven have had their worst first quarter since 2022!
Over the past two years, seven major tech companies--Alphabet, Amazon, Apple, Meta Platforms, Microsoft, Nvidia and Tesla--have driven a strong rally that pulled stocks out of the 2022 bear market, setting dozens of all-time highs.
Today, even after the past week's rally, the seven major U.S. stocks have had their worst start to a year since 2022, according to Dow Jones Market Data. All seven stocks are down more than 6.5%, wiping out a total of $2.5 trillion in market value. [
1. Core earnings focus: Can tech giants continue their growth myth?
Earnings schedule and market expectations
Meta (after the close on April 30)
Microsoft (after the close of trading on May 1)
Apple (after the close on May 2)
Amazon (after the close of trading on May 3)
Risk warning signals
Nvidia showed weakness ahead of time: fell 2.1% on Monday.
Divergence in the Nasdaq: The Dow's fifth straight gain contrasts with a slight drop in the Nasdaq, which could trigger a broader sell-off if it falls below its 15,000 support level after earnings.
II. Interpretation of the latest market data
Changes in liquidity environment
US Treasury yields fell: The yield on the 10-year Treasury note fell to 4.213% (from 4.267%), a low interest rate environment is positive for tech valuations, but the US Treasury's new $514 billion borrowing program could drain liquidity from the market, so watch for changes in funding.
Dollar index weakens: The Wall Street Journal dollar index fell to 95.78 (from 96.34) and a weaker dollar is usually good for foreign earnings conversion for multinational companies, but if the debt ceiling crisis heats up, the dollar could rebound quickly.
Commodity market feedback
Gold rallied back: Spot gold closed at its third-highest level in history ($3,332.50 an ounce), as risk aversion rose. If earnings fall short of expectations, gold could test the $3,400 mark again.
Crude oil demand concerns: WTI crude fell to $62.05 / barrel, Brent to $65.86. Weak tech stocks could exacerbate the deterioration in economic expectations, further weighing on the outlook for crude oil demand.
3. Analysis of key linkage effects
Negative correlation between tech stocks and gold: If the earnings blow leads to a sharp drop in the Nasdaq, gold's safe-haven nature will be highlighted, and capital may accelerate into the precious metals market.
Crude oil as an economic barometer: Weak tech giant earnings-> Downgraded global economic outlook-> Dismal outlook for crude oil demand, WTI may test psychological support at $60.
Weekly circle prompt:
[At the beginning of this week, new warehouses entered to short gold, and need to wait for a new one-hour reversal signal in the European and American sessions before continuing to enter to short gold,
aim to do
TP1:3265
TP2: 3240
TP3:3225
TP4: 3205】
On Monday, during the European session of gold, there was a reversal signal at the support structure position on the 1-hour chart, and the long plan was put on hold.
Daily chart, gold has been trading above the EMA in a volatile market, and the bearish force is not strong enough to reverse the gold rally.
The data on Tuesday was light, so we changed our thinking and continued the upward direction on Monday to go long on gold. Using the FIBO calculation of last week's downtrend, the target for going long on gold is:
TP1: 3380
TP2: 3408
TP3: 3447
GOOD LUCK!
LESS IS MORE!

GOLD The Target Is UP! BUY!
My dear followers,
I analysed this chart on GOLD and concluded the following:
The market is trading on 3358.8 pivot level.
Bias - Bullish
Technical Indicators: Both Super Trend & Pivot HL indicate a highly probable Bullish continuation.
Target - 3377.5
Safe Stop Loss - 3352.1
About Used Indicators:
A super-trend indicator is plotted on either above or below the closing price to signal a buy or sell. The indicator changes color, based on whether or not you should be buying. If the super-trend indicator moves below the closing price, the indicator turns green, and it signals an entry point or points to buy.
Disclosure: I am part of Trade Nation's Influencer program and receive a monthly fee for using their TradingView charts in my analysis.
———————————
WISH YOU ALL LUCK

XAUUSD Analysis todayHello traders, this is a complete multiple timeframe analysis of this pair. We see could find significant trading opportunities as per analysis upon price action confirmation we may take this trade. Smash the like button if you find value in this analysis and drop a comment if you have any questions or let me know which pair to cover in my next analysis.
