XAUUSD SIGNAL UPDATE READ THE CAPTAINXauusd signal technical analysis satup 👇🏼
(Xauusd ) Buy zone
( TRADE SATUP)
ENTRY POINT (3392) to (3394) 📊
FIRST TP (3400)📊
2ND TARGET (3408) 📊
LAST TARGET (3416) 📊
STOP LOOS (3385)❌
FALLOW RISK MANAGEMENT ✅
XAUUSD trade ideas


XAUUSD Daily Outlook – Monday, May 12, 2025🔍 Daily Structure Summary:
After rejecting from the ATH zone (3500), price formed a corrective wave, with a clean bullish reaction from 3284–3292, now confirmed on Daily.
Friday’s daily candle closed bullish, forming a strong wick rejection from demand, indicating buy-side interest around 3290.
EMAs show price still in a pullback phase, with EMA21 and EMA50 overhead acting as dynamic resistance (~3360–3380).
📌 Key Daily Zones & Levels
Zone / Level Description
3448–3500 🔺 Premium Supply Zone – major rejection area (same as Weekly top)
3380–3395 🔁 Daily FVG + EMA confluence – near-term resistance zone
3340–3360 🔁 Old support → new resistance – possible rejection if unconfirmed
3284–3292 ✅ Confirmed Demand – recent bounce and bullish PA
3250–3265 🔵 Last defense zone – if this breaks, 3220 may be exposed
3220–3235 🔵 Major Daily Demand – matches Weekly BOS and potential reversal zone
📈 Current Price Action Notes:
Price is pushing away from 3290, aiming toward 3340–3360, where we may see the first intraday test of resistance.
A clean break above 3360 would open space toward 3380–3395, where FVG and EMA50 could slow price.
If price fails to hold above 3290, it may revisit 3250–3265 for a deeper liquidity sweep.
🧠 Flow Outlook for Monday:
Bullish scenario:
Price holds above 3290 and forms higher low → potential to reach 3360–3380 intraday. If that breaks, we target 3395.
Bearish scenario:
If we reject below 3340 and lose 3290 again, price may head back toward 3250–3235 for stronger demand testing.
📌 Summary of Levels (For May 12):
Type Price Zones Notes
Resistance 3448–3500 Premium HTF rejection zone
3380–3395 FVG + EMA confluence
3340–3360 Near-term intraday resistance
Support 3284–3292 Daily demand, bullish reaction confirmed
3250–3265 Key intraday demand & bounce zone
3220–3235 HTF daily demand + structure base

XAUUSD Update - 3rd week May 2025Still following into the major trend...Gold has a high probality to make a new ATH above 3500.
Good Luck !

The bulls return strongly and continue to buy after the retracemCurrently, gold is fluctuating around 3360. Wait patiently for the opportunity to go long when it falls back. Below, we continue to pay attention to the short-term support at 3350-54, and focus on the important support at 3336-40. In terms of operation, we mainly go long on pullbacks. Be a prudent trader and take profits within your cognition. I have been waiting for your participation. If your current gold operation is not ideal, I hope I can help you avoid detours in your investment. Welcome to communicate with me!
From the 4-hour analysis, gold bulls are making another strong impact. On the top, we pay attention to the short-term suppression of 3385-90 and the suppression of 3400. On the bottom, we pay attention to the short-term support of 3350 and the important support of 3336-40. In terms of operation, we mainly buy when the price falls back. In the middle position, we should watch more and do less, and follow orders cautiously, and wait patiently for key points to enter the market.
Gold operation strategy:
Gold falls back to 3350-53 and buys more when it falls back to 3336-40. Stop loss 3327, target 3380-3385, and continue to hold if it breaks;

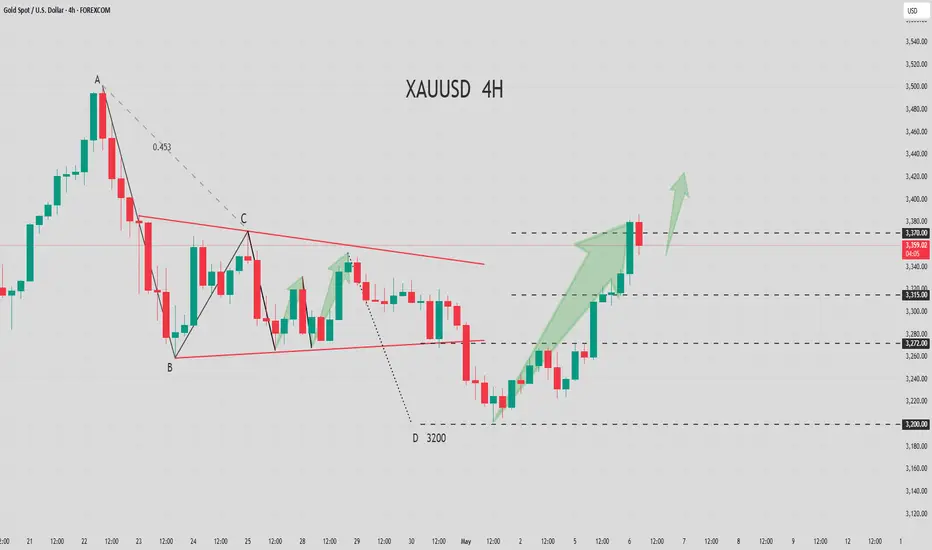
Gold (XAU/USD) Intraday Buy Setup with High Reward-to-Risk Ratio1. Entry Point Zone: Around 3,271.79 USD
This is identified as a potential buy entry area, marked in purple.
2. Stop Loss: Below the entry point at 3,257.71 USD
Risk management level in case the trade moves against the setup.
3. Target Point One: Between 3,313.75 and 3,317.07 USD
A short-term take-profit level, likely based on previous resistance.
4. Final Target (EA Target Point): Around 3,373.04 USD
A more ambitious take-profit, possibly based on a major resistance level or Fibonacci extension.
5. Trade Range:
Risk: 3,271.79 - 3,257.71 = 14.08 USD
Reward to First Target: ~42 USD

Seize the moment! The rebound is a good opportunity to shortGold was affected by the implementation of the China-US tariffs and the ceasefire between India and Pakistan, which weakened the market's risk aversion sentiment. The weekly line formed a double-needle top pattern, and continued to see downward adjustments this week. The daily line also has a double top structure, with 3500 and 3435 as double tops, and the neckline focuses on 3202. If it falls below, the double top pattern is confirmed. In terms of thinking, keep falling back and adjusting, with pressure focusing on 3260 and 3283, and support below focusing on 3200-3202. In terms of operation, rebound high and short are the main, and falling back is supplemented by long.
Operation suggestion: short gold when it rebounds to around 3255-65, and look at 3320 and 3200. long gold when it falls back to around 3210-3200, and look at 3320 and 3250.

The buy low and long strategy is coming!From the 4-hour analysis, the support below is around 3308-3300. If it does not break, the main bullish trend will remain unchanged. The upper side pays attention to the short-term suppression of 3360-66. The daily level stabilizes above this position and continues to maintain the low-multiple rhythm.
Gold operation strategy:
1. If gold falls back on the 3325-3320 line, go long, and if it falls back on the 3310-3300 line, it will cover long positions. The target is 3355-3360.

The most important golden strategy📌Fundamentals:
Focus on the Federal Reserve's interest rate decision
📊Technological aspects:
From the golden hour chart, the Asian market is in line with a wave of continued gains and the subsequent adjustment to the 10 moving average of 3350 has stabilized. The European market has slowly moved higher and is approaching the Asian market high. This pattern is still very strong, and there is a high probability of a second rise tonight; The 10 EMA is above 3370 as the primary support and continues to be bullish. As each line closes, the moving support will slowly move up. As long as it does not effectively break, the short squeeze will continue. A breakthrough of 3410 will also happen at any time. If it breaks through, it will be easy to continue to storm above 3420. If it rushes higher and falls back in the evening and falls below the 10 EMA, then If it adjusts to the middle track for the first time, there will still be good support, just continue to be bullish; comprehensively speaking, today's short-term gold operation ideas suggest that the callback is mainly long, and the rebound is supplementary.
🎯 Practical Strategy:
Short strategy: short gold when it rebounds around 3425-3430, target around 3400-3380.
Long strategy: long gold when it pulls back around 3365-3370, target around 3400-3420.

XAUUSD:The bullish forces make a strong comeback.Yesterday, the gold market soared with an impressive rally. It started rising during the Asian trading session, continued the upward trend in the European session, and witnessed a further surge in the American session. Eventually, it closed at a high level, fully demonstrating the strong comeback of the bullish forces, which is by no means a short-term rebound. In the early trading session of today, we precisely seized the opportunity and placed two long positions near $3,325. Currently, we have successfully locked in the profits after the price reached a peak.
In the following period, we will focus on the price correction and pullback. Once the price stabilizes after the pullback, we will maintain a bullish outlook. If the price moves steadily during the European trading session, we can temporarily adopt a wait-and-see attitude. If the upward trend continues, the pullback before the American trading session will be an excellent opportunity to follow up. Overall, based on the judgment that the Asian, European, and American trading sessions will maintain a continuous upward trend in tandem, we will keep seizing opportunities to go long.
In the future, we will continue to monitor the market changes and update the trading strategies in real time.
I am committed to sharing trading signals every day. Among them, real-time signals will be flexibly pushed according to market dynamics. All the signals sent out last week accurately matched the market trends, helping numerous traders achieve substantial profits. Regardless of your previous investment performance, I believe that with the support of my professional strategies and timely signals, I will surely be able to assist you in breaking through investment bottlenecks and achieving new breakthroughs in the trading field.
GOLD - single supporting area, holds or not ??#GOLD.. well guys market moved perfect as per our analysis in perveious ideas.
Now market just reached at his single supporting area 3290-91
That is market current supporting area so keep close and keep in mind that we will go for cut n reverse below that.
Good luck
Trade wisely

Gold Price Analysis May 8D1 candlesticks started to show some selling pressure but were still pushed back by buyers at the beginning of today's Asian session
Gold is falling at the end of the Asian session towards 3373. BUY zones are noted at the support zones that buyers are waiting for first 3373-3353-3338
On the opposite side, the sell borders 3405 and 3424 are considered for scalping when the price pushes up. These are data analyzing price zones with strong buying and selling pressure in the past, paying more attention to the current price reaction to have the best trading strategy.

( Gold ) Bearish Reversal Setup via Head and Shoulders Pattern Gold is showing signs of a potential short-term bearish reversal as a clear Head and Shoulders pattern has formed on the 30-minute chart. The price is testing the neckline near 3394, where a breakdown could trigger a move toward the 3330–3320 support zone.
🔍 Technical Analysis:
Pattern: Classic Head and Shoulders, indicating a possible shift in market structure.
Neckline level: Around 3394 – a break below confirms the pattern.
Indicator. Price is testing the lower boundary of the cloud; a clean break through supports the bearish case.
Volume Observation: Decreasing volume on right shoulder, suggesting buying momentum is fading.
Bearish Targets: Projected move based on pattern structure points toward 3330–3320.
🧠 Fundamental Backdrop:
U.S. Dollar Strength: Recent hawkish Fed comments and stronger-than-expected U.S. economic data are boosting the USD, putting pressure on gold prices.
Interest Rate Outlook: Rising yields are reducing gold’s appeal as a non-yielding asset.
Geopolitical Calm: Lack of fresh geopolitical tensions reduces safe-haven demand temporarily.
Inflation Outlook: Stabilizing inflation may also reduce urgency for gold hedging.
💡 Trade Plan:
Short Entry: 3394 (after neckline break confirmation)
Target Zone: 3330–3320
Stop Loss: Above 3410
Risk-Reward Ratio: ~2:1 depending on final entry/exit points
Must Support Me Share My Idea With Your Firends Mention Your Feed back Comment Section
📌 Note: Wait for confirmation with a strong candle close below the neckline and increased volume before entering the trade. This is not financial advice. Please conduct your own research and manage risk accordingly.

Downtrend - will go price return to $3275 GOLD SHORT IDEA | XAUUSD
Price: 3,325
Bias: Bearish
Entry: Near supply zone retest within descending channel
SL: 3,350 | TP: 3,300 → 3,275
🔸 Price respecting bearish channel
🔸 Multiple CHoCH & BOS confirming bearish structure
🔸 IDM zone mitigated with strong rejection
🔸 Expecting continuation to demand zone below
🕐 TF: 15M / Intraday Idea
📊 Strategy: Smart Money Concept (SMC)
#XAUUSD #GOLD #SmartMoney #shortsetup #PriceAction #CHoCH #BOS #TradingViewIdeas

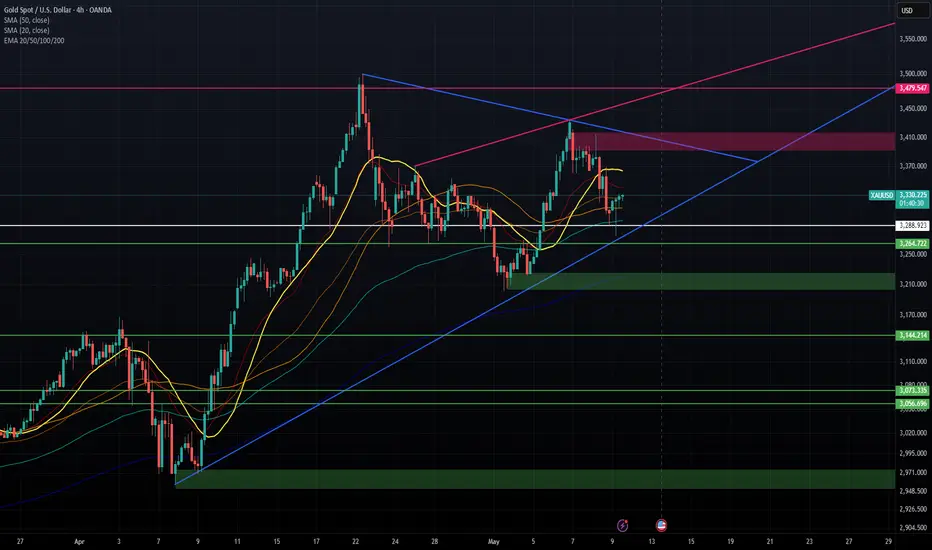
### Technical Analysis of Gold 4 Hour(XAU/USD) ### Technical Analysis of Gold 4 Hour(XAU/USD)
#### Overview
The chart displays the 4-hour price action for Gold (XAU/USD) with various technical indicators, including Simple Moving Averages (SMA) and Exponential Moving Averages (EMA), along with support and resistance levels. The displayed time frame suggests that this analysis focuses on short to medium-term trading strategies.
#### Current Price Action
- **Current Price**: The price of Gold is currently at approximately **3,325.13**. The price has recently bounced off a significant support level and is in a critical zone, indicating potential price action volatility.
#### Trend Analysis
- **Long-Term Trend**: The blue diagonal line illustrates an upward trend that started in early April. Gold’s price has consistently been above this trendline, indicating bullish sentiment in the market.
- **Short-Term Trend**: In the last week, the price peaked around **3432** but has since retraced towards the trendline. The price action suggests a consolidation phase currently on the chart.
#### Indicators
- **Moving Averages**:
- **SMA(50)**: It is bullish at **3,312.79**as the price remains above this moving average.
- **SMA(20)**: The shorter SMA at **3,363.54** indicates potential short-term resistance.
- **EMA (20)**: The EMA is slightly below the price at **3,295.59**, offering support if the price approaches this level.
The proximity of the price to the moving averages indicates an area of dynamic support and resistance, where traders may look for guidance on entry and exit points.
#### Support and Resistance Levels
- **Resistance Levels**:
- Clear resistance is observed at **3355/3370**
- The upward red trendline 3400/3416/3480 could also serve as dynamic resistance in the future.
- **Support Levels**:
- Strong support is found at **3,288.92**, coinciding with the recent consolidation's lower edges. The blue trendline provides additional support near **3,290**.
- Key support levels below are **3,264** and more significantly around **3,220 and 3,144**.
#### Price Patterns
- The chart displays a potential pennant formation, which generally precedes continuing the existing trend. Traders should be alert for breakout signals, either above resistance or below support, suggesting potential price movement toward the breakout.
#### Trade Considerations
- **Bullish Scenario**: A bullish breakout above the resistance level of **3365** with increasing volume could cement a further move towards the highs around **3410** or **3480**.
- **Bearish Scenario**: Conversely, a decisive break below the **blue trendline** or **support at 3,280** may trigger further downside with targets around **3,230/3200/3140** or lower.
#### Conclusion
The current price suggests that Gold is testing critical support levels while remaining in a longer-term uptrend. Traders should look for confirmation of direction through breakout patterns, volume, and market context. Monitoring economic data affecting Gold prices and general market sentiment will also be essential for making informed trading decisions.
We may not know what will happen, but we can prepare ourselves to respond effectively to whatever unfolds.
Stay grounded, stay present.🏄🏼♂️
Your comments and support are appreciated! 👊🏼 OANDA:XAUUSD
Gold latest market analysisAt present, the gold 1-hour moving average crosses downwards and the short positions are arranged. Now it is under pressure at 3270 and is suppressed and falls back. 3270 is still the key turning point for gold bulls and bears. Although there is a rebound, the magnitude of the decline is not large. If the pressure at 3270 is not broken, the gold bulls will not reverse easily for the time being. After the rebound, it will continue to fall, which means that the strength of gold bears is still there, and the gold reversal will naturally not reach a new low, so that the gold bulls will usher in a new turn. Gold operation strategy reference: Short (buy short) two-tenths of the position in batches near the rebound of gold at 3260-3265, stop loss 6 points, target near 3230-3210, break to see the 3200 line.

GOLD The Target Is DOWN! SELL!
My dear friends,
My technical analysis for GOLD is below:
The market is trading on 3377.8 pivot level.
Bias - Bearish
Technical Indicators: Both Super Trend & Pivot HL indicate a highly probable Bearish continuation.
Target - 3357.7
Recommended Stop Loss - 3387.7
About Used Indicators:
A pivot point is a technical analysis indicator, or calculations, used to determine the overall trend of the market over different time frames.
Disclosure: I am part of Trade Nation's Influencer program and receive a monthly fee for using their TradingView charts in my analysis.
———————————
WISH YOU ALL LUCK

XAUUSD GOLD Suggestion Bearish TrendGold (XAUUSD) is showing bearish momentum on the 30-minute chart.
The recent 1% drop was triggered by President Trump's announcement of a U.K. trade deal, which sparked optimism for more trade agreements.
we waiting for a solid breakout confirmation to the downside, suggesting a sell-side bias.
Resistance level to watch 3335/ 40
Support Levels 3300 / 3270
Keep eye these factors lets we could see how the price will Plays out.
Would you like me to check the latest chart and technical Setup keep Support pour work Thanks investors.

Should we go long on gold when it falls back?From a technical point of view, the daily line has been in negative trend, which is definitely weakening. Whether the market will continue in the future needs to be observed. If it is established, the lower side may be seen at 3260 and 3200, but if the daily line is positive on Friday, it can also turn strong at any time. After all, the current price is just near the middle track of the daily Bollinger, and both rise and fall are possible.
In the 4-hour cycle, we should pay attention to today's closing situation. The price is temporarily around 3300. If it continues to fall, the lower track of Bollinger will open, which may form a unilateral trend, rebound, and Bollinger will close, and it will rise strongly again. Therefore, it is not easy to say the specific rise and fall situation for the time being. It is recommended to observe more to see whether the Asian and European sessions break the new low of 3288, and the upper pressure is 3350 and 3370. In the morning, gold rose first and then fell, and it was quite fierce. It is recommended not to chase orders. Pay attention to the support of 3288 first. If it does not break, try to go long. If it breaks, it will go to the low point of 3260. It is expected that gold will have another wave of rising space on Friday.

Gold fluctuates before Fed decisionFrom a technical perspective, the international gold price encountered strong resistance at the 3500 integer psychological barrier on a daily basis and then started a technical correction. However, the first two trading days of this week were closed with long positive candlesticks, forming a strong rebound pattern, basically recovering the previous retracement space, indicating that bullish momentum continued to accumulate. It is worth noting that the moving average system presents a bullish arrangement: the 5-day and 10-day moving averages are bonded together to form a golden cross pattern, the upward slope of the medium-term moving average group is steeper, and the resonance of technical indicators shows that the upward momentum is repaired.
Technically, gold showed a violent shock trend during the Asian session, which is in line with the technical characteristics of the recent overnight consolidation, but we need to be alert to the possibility of a deep retracement after a continuous mild upward trend. This pattern may indicate that the bullish buying power is weakening. If the key pressure level of 3404 is not effectively broken during the day, the probability of a short-term top will increase significantly. At the strategic level, it is recommended that you avoid chasing highs and focus on the transmission effect of the Federal Reserve's interest rate meeting on the real interest rate curve and the US dollar index. If the policy tone is dovish, precious metals may continue to rebound technically; if the statement is hawkish, it is necessary to guard against the risk of a correction. The current upper pressure range focuses on the 3397-3407 area, and the lower support band is in the 3360-3350 range. It is recommended to take the buying on dips strategy as the main strategy, and cooperate with the rebound high point short selling operation as a risk hedge.
Operation strategy:
1. It is recommended to go long in the 3366-3361 area for gold, with a stop loss at 3356 and a target of 3381-3411.
2. For gold, it is recommended to short in the 3415-3420 area, with a stop loss at 3427 and a target of 3355-3385.

XAU/USD:the extreme market conditions will continue.There was significant progress in the Sino-US negotiations over the weekend, and it was announced that a Sino-US "joint statement" would be released today. The news led to a gap-down opening of gold by $51 in the early trading, and after the gap-down, it is currently fluctuating weakly below $3290.
From a fundamental perspective, geopolitical events such as the India-Pakistan conflict, the Russia-Ukraine war, and the Middle East situation have limited boosting effects on the gold price. The market's attention is focused on the Sino-US tariff issue. The significant breakthrough in the Sino-US tariff negotiations is bearish for gold, and the gap-down opening of the gold price in the early trading has fully reflected this news. With the alleviation of the tariff dilemma, the market has shifted to a volatile pattern dominated by bears. However, the tariff negotiations are complex, and the subsequent games will continue. Moreover, the disturbances in the geopolitical situation will still support the gold price from time to time. It is expected that the gold price will maintain a wide range of fluctuations.
Focus on:
resistance levels: 3345-3315-3295
support levels: 3260-3220-3180
I am committed to sharing trading signals every day. Among them, real-time signals will be flexibly pushed according to market dynamics. All the signals sent out last week accurately matched the market trends, helping numerous traders achieve substantial profits. Regardless of your previous investment performance, I believe that with the support of my professional strategies and timely signals, I will surely be able to assist you in breaking through investment bottlenecks and achieving new breakthroughs in the trading field.

XAUUSD: 9/5 Today's Market Analysis and StrategyGold technical analysis
4-hour chart resistance level 3360, support level 3280
1-hour chart resistance level 3340, support level 3300
30-minute chart resistance level 3330, support level 3310.
In the 4-hour chart, MACD crosses below the zero axis, and KDJ diverges downward. If it stands firm at 3340, the short-term chart will trigger a larger correction. Now the downward trend has not changed.
Gold prices fell back below $3,400 on Thursday, the rally paused, and a sharp downward adjustment began.
The momentum depicted by the relative strength index (RSI) shows that buyers are losing momentum. This is negative for bulls, as a break below $3,300 could intensify the downward trend, perhaps towards the May 1 low of $3,202.
If the price of gold breaks through $3340, this may push the price back to 3370~3400! There is no important news data today, so the volatility of gold in the US market may weaken today, and you can sell high and sell low for the time being. Next week's U.S. CPI data will be a key variable in determining the next direction of gold prices. If inflation is higher than expected, it may once again ignite fluctuations in the gold market.
SELL: 3345 SL: 3350
BUY: 3305 SL: 3300
Trade cautiously and pay attention to the speech of Fed officials today

XAUUSD (Gold) Continued its Downward trendHere I Created This XAUUSD Chart Analysis
Pair : XAUUSD (Gold)
Timeframe: 1- Hour
Pattern: Resistance Level
Momentum: Bearish/ SELL
Entry Level : SELL 3362
Resistance zone : 3370
Target Will Be : 3325
Disclaimer : This signal is based on personal analysis for learning purposes. Trade at your own risk and always use proper risk management.
