XAUUSD 15M This chart displays a 15-minute candlestick chart of Gold Spot (XAU/USD) with a clearly marked trade setup. Here's a quick breakdown of what it illustrates:
Buy Zone: Marked in the orange shaded area around the price of $3,372.194 to $3,364.121.
Entry Point: Near the lower edge of the buy zone.
Target: Around $3,393.363, marked as "target successful".
Risk-to-Reward Setup: The green area represents the profit target; the red area below is the stop-loss zone.
Arrow Path: Indicates the anticipated price movement from the buy zone up to the target level.
This is a classic bullish reversal setup after a price drop, aiming for a retracement or continuation upward.
Would you like help analyzing this trade setup or suggestions for improving the strategy?
XAUUSD trade ideas

Gold lower timeframe trade setup M3 trade setup little bit late but still market respecting our levels

XAUUSD NEXT MOVE Over-Reliance on Double Top Projection
• The chart assumes a price move straight up to form a “double top” around 3,540–3,550 without acknowledging possible market hesitation or intervening resistance zones.
• A double top pattern requires a confirmation of rejection at the same level; assuming it prematurely can be misleading.
2. Support Zone Might Not Be Strong Enough
• The “Strong Support and Bullish Area” is drawn around 3,200–3,230, but the bounce shown in the chart is still not well-established. A break below this would invalidate the bullish thesis.
• There is no confirmation of higher lows, which is critical for a trend reversal.
3. Overlooked Bearish Pressure
• The previous high (around 3,540) led to a sharp selloff, indicating strong supply. This area could be a distribution zone rather than just resistance.
• Market sentiment might still be bearish unless a higher high is confirmed.
4. Resistance Area Is Vague
• The “Resistance” zone between 3,340–3,360 is too narrow and lacks confluence with indicators like moving averages or volume spikes.
• A pullback from this zone is plausible, and it should be treated as a decision area, not just a step before price rallies.
5. Economic Events Are Ignored
• There is an icon showing a U.S. economic event, but the chart doesn’t factor in fundamental catalysts, which could disrupt technical patterns significantly.

Gold next targetGold next target 🎯🎯🎯🎯 is very very clear so we can take risk on this trade for the target of 3000 below

Is gold ready for a bearish position??🔶Hello friends.
🔸If we want to check the trading position on the gold chart, according to my swing trading strategy, a suitable bearish position is forming.
🔶Follow me so you don't miss out on more opportunities I've decided to share with you from now on. I love you and I want you to love your money and trade carefully.

Gold Technical Analysis, May 9📊Gold stabilized and rebounded after a rapid decline in early trading today. The price broke through the 3324 line, which opened in the morning, and the technical pattern turned to a bullish pattern. Usually in a weak market, the price will not rebound sharply, but this bottoming out and rebound has obviously swallowed up the downward momentum, indicating that the short-term upward trend is expected to continue.
📊From the weekly structure, this week showed a "wide range of fluctuations" rhythm. It rose continuously on Monday and Tuesday, and fell sharply on Wednesday and Thursday, and continued to fluctuate violently on Friday. Although the market has ups and downs, it is still running in the oscillation range as a whole, with obvious characteristics of washing the market, and it is more likely to be a potential adjustment before the subsequent surge.
📊From the hourly line, 3324 is the opening of this round of decline. After being effectively broken, the price returned to the bull-dominated range, indicating that the current trend is not weak. If the US market can continue to hold the support of the morning low of 3315, the short-term bullish logic will be further established, and gold is expected to gradually rise to the 3350-3360 area.
📊For the current trading strategy, it is recommended that investors avoid chasing ups and downs in the context of large range fluctuations. It is safer to adopt the method of buying on dips and gradually increasing positions. If the price falls back to 3280 or below, you can consider buying in batches and use 3310 as a short-term stop loss defense.
🔴Resistance level: 3360-3370
🟢Support level 1: 3310-3315
🟢Support level 2: 3280
✅The market has shown an obvious long-short double-kill pattern this week, with the overall trend dominated by Trump-related news, disrupting the existing rhythm of technical analysis. Despite this, we still insist on using a smaller stop loss to control risks and keep losses to a minimum as much as possible. The overall performance is still significantly better than most individual traders in the market.
✅This weekend, Trump will start a new round of negotiations with China on trade tariffs, and the tariff dispute that has lasted for more than a month is expected to come to an end. As the impact of the news gradually weakens, the market is expected to return to the rhythm dominated by the technical side, which will bring us more predictable trading opportunities.
✅We have reason to believe that with a clear market rhythm, we will have more opportunities to further achieve stable profits next week🤝

GOLD/USD suggesting a potential short trade with the target The chart shows a significant uptrend starting around mid-March, peaking near 3,374.74, followed by a sharp decline towards 3,171.35, marked as the "target. *: A support zone is highlighted around 3,005.68 to 3,017.01 (green), and a resistance zone around 3,329.79 to 3,346.15 (red).The right side shows price levels, with the current price around 3,171.35, aligning with the target after the drop

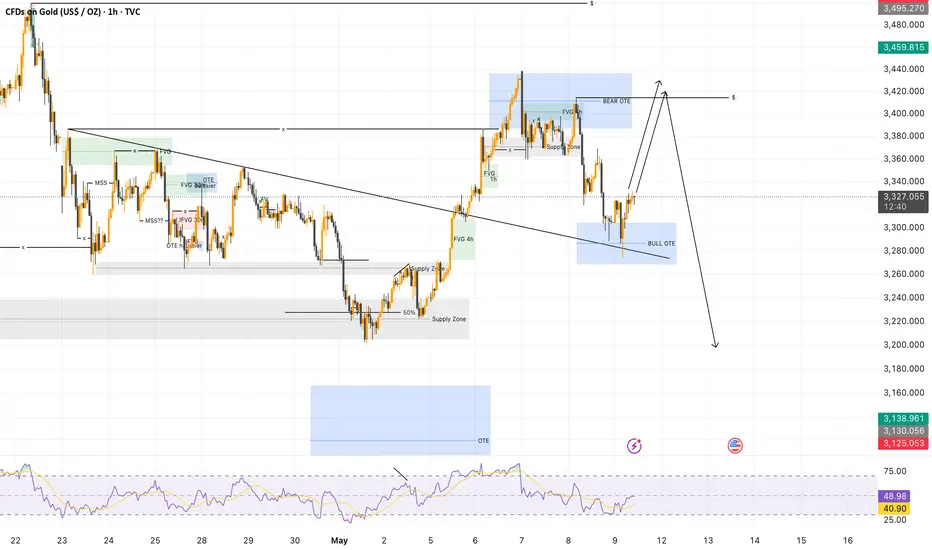
Gold (XAU/USD) Analysis – 1H🏛 1. Current Market Structure
📈 After a strong upward impulse, gold has now pulled back into a Bull OTE zone, aligned with a key trendline acting as a dynamic support.
📐 This setup could indicate a potential bullish rebound, especially if the market views this pullback as a healthy retracement before a larger continuation.
🌍 2. Bigger Picture Outlook
🔍 The recent rejection at the Bear OTE highlights the presence of strong supply at higher levels.
⚠️ However, the current bounce from the Bull OTE could either be the start of a larger bullish leg targeting the Bear OTE again – or just a technical bounce before a deeper correction, especially if the FED hints at rate cuts in June or July.
🔍 3. Key Technical Observations
🟦 Bear OTE: Clear rejection, confirming this as a key resistance for now.
🟦 Bull OTE: Providing initial support, coupled with a trendline bounce, adding confluence for a potential move up.
📐 Trendline Support: Critical for maintaining the current bullish structure, a break here could signal a deeper retracement.
🎯 4. Short-Term Expectations
📉 Bearish Scenario:
Rejection from the Bull OTE
Break below the trendline
Deeper pullback towards the Supply Zone or even the 50% retracement level
📈 Bullish Scenario:
Clean break above the Bull OTE
Retest of the Bear OTE (~$3,500)
Possible breakout if volume supports the move
🔥 5. Upcoming Catalysts
🕰 FED rate decision in June/July – potential rate cuts could shift sentiment.
💰 Inflation and economic data: Key drivers for gold’s short-term direction.
🔎 Volume and order flow: Crucial to confirm any true breakout.
✅ Conclusion
👉 Gold is at a critical junction, testing a Bull OTE with a supporting trendline – a key moment for determining the next major leg.
📍 Key levels to watch:
Bear OTE (~$3,500)
Bull OTE (~$3,300 - $3,320)
Trendline support – a break here could invalidate the bullish thesis
⏳ As always, stay alert for fakeouts and liquidity grabs around these levels.
Gold (XAU/USD) Analysis – 1H🏛 1. Current Market Structure
📉 Gold is currently consolidating and compressing between a Supply Zone below and a 4H FVG above.
🔎 This setup reflects market indecision, typical ahead of a major event like the FOMC.
🌍 2. Bigger Picture Outlook
⚠️ Powell's speech is scheduled in 2 hours, with very low probability of a rate cut.
💰 This would generally benefit gold, but keep in mind that some of this expectation might have already been priced in yesterday.
🔍 3. Key Technical Observations
🟩 4H FVG: Liquidity zone just above the current price, potential target if the price breaks upward.
🟫 Supply Zone: Key structural support, tested multiple times in the past hours.
📐 Classic compression pattern, often leading to a major breakout, but no clear direction confirmed yet.
🎯 4. Short-Term Expectations
📉 Bearish Scenario:
Rejection from the 4H FVG
Drop back to the Supply Zone
Potential liquidity sweep below $3,350
📈 Bullish Scenario:
Clear break above the 4H FVG
Potential rally towards $3,500 if the FED surprises or stop-losses get hunted.
🔥 5. Upcoming Catalysts
🕰 FOMC in 2 hours: Main short-term risk factor.
💸 Powell + Rates: If rates remain unchanged with a cautious tone, gold could break out to the upside.
🔎 Immediate volume and reaction will be critical to confirm a true breakout.
✅ Conclusion
👉 Caution is advised ahead of the FOMC. The market seems ready for a sharp move in either direction, but the outcome will heavily depend on Powell's tone.
📍 Key levels to watch:
4H FVG (~$3,420)
Supply Zone (~$3,370)
Psychological $3,500 level if a bullish surprise unfolds.

XAUUSD: Market Analysis and Strategy for Today, May 12Gold technical analysis
4-hour chart resistance level 3300, support level 3168
1-hour chart resistance level 3260, support level 3200
30-minute chart resistance level 3248, support level 3216,
The decline in gold is due to the joint statement issued by China and the United States at the Geneva economic and trade talks today, and the Sino-US tariff war has been eased. Risk aversion has subsided, and gold has fallen again under pressure.
The 4-hour chart MACD crosses below the zero axis, and KDJ diverges downward. If the price cannot return to above 3260, the medium- and long-term bearish trend will be difficult to change. The 1-hour chart RSI and ADX indicators show strong bearish momentum. If it falls below 3200, it may accelerate downward and continue to test the previous top and bottom conversion position of 3168.
The gold market is suppressed by trade optimism and the strengthening of the US dollar, and the short-term technical side is bearish. Short-term support focuses on 3210~3200, and the upper resistance area of 3245~3260 can be sold at highs.

Gold Bounces from Demand Zone! Is a Rally to $3,414 Next?Demand Zone: Price bounced from a visible high-volume area (LuxAlgo Supply and Demand Range) marked in orange, indicating institutional buying interest.
Support Level: Holding above $3,223.028, the last significant swing low.
Bullish Targets:
First target: $3,321 – a key mid-range structure.
Second target: $3,414 – upper supply zone where price has reversed previously.
Volume Profile: Notice the thin volume between $3,230–$3,320, meaning less resistance for bulls in the short term.
Candle Behavior: Strong wick rejection signals buyer aggression at support.
Catalysts to Watch:
Upcoming US CPI and PPI data this week.
Dollar Index (DXY) rally – if it cools off, gold could surge.
Geopolitical tensions and inflation hedging may also drive demand.
Trade Idea (Not Financial Advice):
Entry: Current bounce or wait for break of $3,235
SL: Below $3,218 (invalidates demand zone)
TP1: $3,321
TP2: $3,414
Conclusion:
Gold might be setting up for a clean bullish move. Reclaiming $3,321 would be a key confirmation. Will bulls step in strong this week?
Let’s hear your thoughts in the comments! Are you buying this dip or waiting for confirmation?

GOLD BUY TRADE SETUP Here is the gold buy trade setup but it's for scalping remember we have sellside orderflow so buying is little bit risky take it on your own risk

GOLD - Near to CUT n REVERSE Area? what's next??#GOLD. market perfectly bounced from our area and now market just above his current suportinga area that is around 3382-87
keep close if market holds then further bounce on table.
NOTE: we will go for cut n reverse below our region.
good luck
trade wisely

GOLD ROUTE MAP UPDATEHey Everyone,
Great finish to the week, after completing both our Bullish and Bearish target yesterday, we then finished off with our retracement range gaps.
We also stated that we will look for a cross and lock below this level to open the swing range or failure to lock, will see support and bounce on this level.
This played out perfectly with no lock confirming the rejection and then the bounce allowing us to buy the dip. We are now seeing the level retested again and respecting it perfectly for another bounce.
We will keep the above in mind when taking buys from dips. Our updated levels and weighted levels will allow us to track the movement down and then catch bounces up.
We will continue to buy dips using our support levels taking 30 to 40 pips. As stated before each of our level structures give 20 to 40 pip bounces, which is enough for a nice entry and exit. If you back test the levels we shared every week for the past 24 months, you can see how effectively they were used to trade with or against short/mid term swings and trends.
BULLISH TARGET
3343 - DONE
BEARISH TARGETS
3282 - DONE
EMA5 CROSS AND LOCK BELOW 3282 WILL OPEN THE FOLLOWING BEARISH TARGET
3224 - DONE
EMA5 CROSS AND LOCK BELOW 3224 WILL OPEN THE SWING RANGE
SWING RANGE
3190 - 3138
We will now come back Sunday with our updated Multi time-frame analysis, Gold route map and trading plans for the week ahead.
Have a smashing weekend!! And once again, thank you all for your likes, comments and follows, we really appreciate it!
Mr Gold
GoldViewFX

The Fed's decision looks at the trend of gold!From the 1-hour chart, we can see that the gold price is always running below the middle track of the Bollinger Band. As long as the price can effectively stabilize above the middle track support level of 3350, it shows that the bulls are still dominant and the price may restart the upward trend at any time. If the price remains above the 3350 level, the bullish view will continue to be maintained, and the resistance performance of the 3380-3410 area should be closely watched. If the price successfully breaks through this area, it can be regarded as a staged upward target.

GOLD-NEUTRAL SELL strategy 3 hourly chart - GANN GOLD has recovered sharply but somehow it feels we may see a lower test once again. the short-term picture suggest upward pressure still.
Strategy SELL @ $ 3,3380 - 3,425 and take profit near $ 3,267 for now.

Gold weekly chart with buy and sell levels
* **Timeframe:** 1-Hour (H1)
* **Instrument:** XAU/USD
* **Indicators & Levels Used:**
* EMAs 9 & 21 period
* Key horizontal support/resistance levels
* Pivot levels (weekly, daily, monthly)
* Marked **Buy** at 3322.365 and **Sell** at 3318
* Daily Open: 3372.775
* Daily High: 3414.790
* Daily Close: 3305.980
* Daily Low: 3286.805
---
### 🔍 **Technical Analysis:**
#### 1. **Trend Context:**
* The overall **short-term trend** is sideways to slightly bearish.
* Recent price action formed **lower highs and higher lows**, indicating **consolidation**.
* Price is currently trading **below the Daily Open** (bearish intraday bias).
* EMAs are converging, showing **reduced momentum** after prior volatility.
#### 2. **Buy Entry at 3322.365:**
* This is a **reasonable support-retest buy**, taken just above a former demand zone and near the **Daily Close**.
* Likely logic: price bounced from the **3310–3318 support area**, tested the weekly pivot zone and EMAs, signaling a bounce.
* **However**, the proximity to strong resistance at 3340–3350, and lack of strong momentum, suggests this buy was short-lived or scalped.
* **Risk:** Weak buying pressure above this level and failure to reclaim 3340 meant it couldn't reach 3360+.
#### 3. **Sell Entry at 3318:**
* This is a **strategic sell**, probably expecting a break below short-term structure and aiming for the 3300/3288 area.
* Price tested the EMAs and was rejected—classic **pullback entry after lower high**.
* A clear **bearish setup**: break below structure, retest and failure at dynamic resistance.
* **Target zones:**
* 3300 – psychological round number + minor support
* 3288/3278 – structural lows
* 3240 – weekly support and major reaction zone
#### 4. **Key Levels & Zones:**
* **Resistance:**
* 3340: Short-term cap
* 3368 – 3382: Supply area
* 3418 – 3450: Strong resistance, but far from current price
* **Support:**
* 3310 – 3300: Near-term support
* 3288 – 3278: Major demand zone (watch for buy reaction)
* 3240: Weekly support – high-probability reaction zone if reached
#### 5. **EMA Structure:**
* EMAs are turning sideways, but currently acting as dynamic resistance.
* Price attempted to reclaim them during the Asian/early European session but was rejected — bearish signal.
#### 6. **Market Sentiment:**
* Momentum has cooled.
* Failure to maintain above 3340 signals weak bullish conviction.
* With price below daily open and rejecting the EMAs, bias is now **tilted bearish** unless 3340 is reclaimed convincingly.
---
### ✅ **Conclusion & Strategy:**
* **Bias:** Bearish below 3340; neutral between 3300–3340; bullish above 3360.
* **If holding short from 3318:** This is a solid entry. Consider partial profits at 3300/3288 and trailing stop to break-even.
* **If looking for re-entry:**
* Sell pullbacks below 3325 if 3300 is broken.
* Buy only with confirmation above 3340 and reclaim of 3360.
* **Upcoming key areas to watch:**
* **3288 – 3278:** Ideal for long entries with tight stops (watch for bounce/candlestick reversal patterns).
* **3368 – 3382:** Strong rejection zone if price reclaims 3340—good for short setups.

[XAUUSD][2025/05/11] Wait the price action after next 7-8 weeks Wait the price action after next 7-8 weeks to go long
Gold has 26-weeks cycle. Now, gold go through 17 weeks.
Please be patient to get new opportunity!

#Gold ( #XAUUSD ) Analysis for the Upcoming WeekAnalysis for the Upcoming Week
Date: Sunday, May 11, 2025
Chart Overview
Timeframe: Daily (1D)
Current Price: $3,325.39
Key Levels:
Resistance Zone: $3,347.54 – $3,359.35 (IMB - Imbalance area)
Support Zone: $3,195.83 – $3,176.18
Technical Analysis
1. Price Action
Gold has recently shown a bearish move from the $3,420 area, retracing to the current $3,325 zone.
The chart highlights a potential supply/imbalance (IMB) zone between $3,347.54 and $3,359.35, where sellers may become active again.
2. Trade Setup
Short Bias: The marked red zone indicates a potential sell area. If price retraces back to the IMB zone ($3,347.54–$3,359.35), sellers may look for short entries.
Target: The green area suggests a take-profit zone around $3,195.83–$3,176.18, aligning with previous support.
3. Risk Management
Stop Loss: Above the IMB zone, ideally above $3,359.35, to protect against a breakout.
Risk/Reward: The setup offers a favorable risk/reward, with the stop loss relatively tight compared to the potential downside.
Fundamental Considerations
Monitor upcoming US economic data (CPI, PPI, Fed statements), as these can impact gold prices.
Geopolitical tensions and inflation concerns may provide underlying support, but technicals currently favor a retracement.
Trading Plan for the Week
Wait for Retracement: Watch for price to move back into the $3,347–$3,359 IMB zone.
Look for Bearish Confirmation: Seek reversal candlestick patterns or rejection wicks in the IMB zone before entering a short position.
Target Previous Lows: Aim for the $3,195–$3,176 support area for profit-taking.
Adjust if Breakout Occurs: If price closes above $3,360 on the daily, reassess the bearish outlook.
Summary:
Gold is likely to face resistance in the $3,347–$3,359 zone. If price shows rejection here, a move down toward $3,195–$3,176 is probable. Watch for confirmation before entering trades and manage risk carefully.

Gold price fell after a high? Trend reversal?Analysis of Asian morning session:
The recent high point of gold price reached 3437 US dollars, and it fell sharply after the Asian morning session opened. The gold market opened after the Asian holiday, and the bulls rose strongly; the Asian morning session was volatile, and the current lowest reached around 3360, a drop of 77 US dollars.
Then it adjusted back and reached a high of around 3404; this position can be used as an important resistance level at the opening time of the Asian session. Between the sharp rise in the morning of the past two days, and the upward continuity of the European and American sessions, coupled with the recent continuous rise and fall, the rapid fall in the Asian morning session.
Quaid believes that in this continuous upward pattern, once there is a sharp fall, it is also likely to be a signal of insufficient bullish power in the short term; then we need to consider whether the bears can reverse, and the current upper pressure position is at 3395 US dollars, and the lower support level is at 3360 US dollars, which is equivalent to the previous top and bottom conversion.
Operation strategy:
Short when the price returns to 3390, take profit at 3370-3360, stop loss at 3400.
Good luck to everyone.

XAUUSD 15 MINUTESThis chart shows a breakout from a descending channel pattern on the Gold Spot price (XAU/USD) on the 15-minute timeframe. Here's what the chart indicates:
Descending channel: Price was moving within a downward-sloping channel.
Breakout: The price broke above the upper trendline of the channel, signaling a potential reversal or continuation to the upside.
Long position: A long trade was taken right after the breakout, as shown by the green box (profit target area) and red box (stop-loss area).
Target hit: The arrow and label "target successful" indicate that the price reached the trader’s profit target near 3,420.853.
This is a classic breakout trade setup, confirming a bullish move after a short-term downtrend.
Would you like help analyzing the next potential move or finding similar patterns?

Gold is in line with the uptrend
After yesterday's sharp rise from 3238, spot gold continued to climb in the Asian market on Tuesday. The price of gold has now broken through the highest level of 3386 US dollars per ounce, and the daily increase is nearly 28 US dollars. At present, the price of gold remains close to the new record, and the rise is far from over. The global trade war has caused market concerns and continued to push the price of gold to new highs. Gold has become an asset for a new round of investment boom!
The market boom is coming, and the gold bulls are coming?
Banking giant Goldman Sachs released a bullish forecast report on gold, saying that if a recession becomes a reality, the gold price target will reach 3880 US dollars per ounce by the end of 2025. The forecast is based on the expectation that concerns about a recession will accelerate the inflow of funds into gold exchange-traded funds (ETFs), thereby pushing up gold prices.
In addition, Goldman Sachs warned that if the Federal Reserve loses its independence, the price of gold may soar to 4500 US dollars per ounce.
What do you think of today's gold trend!
Looking back at the current gold and silver, from the market point of view, the gold price trend has been stabilizing above the middle track, and the cycle bulls continue to line up. From the indicator point of view, the middle track has been hooking upward, and there is still room for an upward rebound in the short term. In addition, gold started from 3322 last week, and directly rose from 3322 to 3387. Now it is around 3367. So there is a point to pay attention to today, that is, the position of the middle track of 3334. It is still difficult to say whether it can be stepped back.
Don't expect a deep callback. The only difference between the oscillating market and the unilateral market is that the oscillation will come back, while the unilateral market will not. This is why we always emphasize the need to bring a good stop loss. In terms of the cycle rhythm, we have been participating in the cycle of time and space last week. At present, we can still participate in this pattern. There is one opportunity in the European and US markets. We will start at this time point during the day!
Gold: More near 3350, defend 40, and target the resistance of 3385-90! If it breaks below, wait for the two support levels of 3334-20 before considering!

XAUUSD 15 MINUTESThis chart illustrates a short-term bearish trading setup for Gold (XAU/USD) on a 15-minute timeframe. The trader has identified:
A "SELL ZONE" around 3,380–3,390, indicating a potential reversal area.
LEVEL 1 (~3,370) and LEVEL 2 (~3,355) as possible support areas or price reaction zones.
A final target labeled "TAEGET SUCCESSFUL" (likely meant to be “TARGET SUCCESSFUL”) around 3,325.
The projected price action (marked by the purple line) suggests a short position from the sell zone aiming to hit all three levels, with the ultimate target being around 3,325.
Would you like help setting up a trading plan based on this setup or backtesting this strategy?
