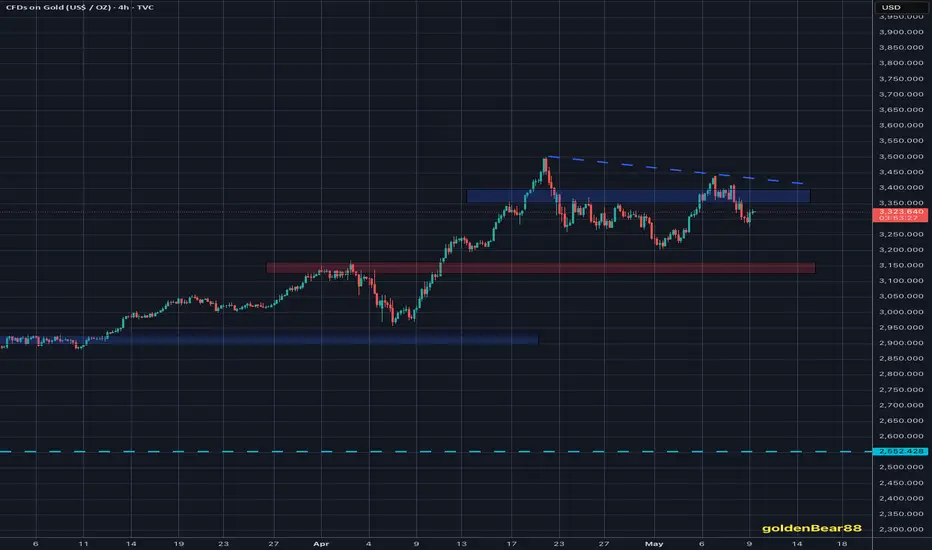
GOLD Eiffel Tower M pattern now completeI have been posting gold charts since February 2024. Both Bullish and GTFO charts. See below.
This current setup has presented a great risk-reward setup.
1. GTFO still remains firmly in place.
2. The lower high M pattern could be setting up for a corrective bull flag for more upside.
If the Eiffel Tower plays out. You will not be involved.
If the corrective pattern plays out, you will have a clear, solid buy signal.
Click Boost, Follow and Subscribe for more updated data and info. Let's get to 5,000! ;))
XAUUSD trade ideas

Gold Eyes Upside Break – Bullish Outlook for Swing TradersGold (XAUUSD) continues to show strength on the 4-hour chart, maintaining its bullish structure and offering a compelling opportunity for swing traders. The market has recently rejected a key support zone, confirming buyer interest and momentum continuation.
Key Technical Observations
Support Zone Rejection: Price strongly rejected the $3,199–$3,265 support zone, forming a clear bullish response. This zone also coincides with the rising trendline, adding strength to the support.
Trendline Confirmation: The dotted green ascending trendline has been respected multiple times, reinforcing the ongoing uptrend.
Consolidation Breakout: After consolidating for nearly 3 days, price broke above the range, confirming bullish intent.
All-Time High Target: The next major resistance lies near the all-time high at $3,504, which acts as the primary upside target.
Trade Setup
Entry Level: $3,338 (after breakout from consolidation)
Take Profit (TP): $3,504
Stop Loss (SL): $3,265
Risk-Reward Ratio: Approximately 2.28
Gold is clearly bullish on the 4-hour timeframe. The trendline bounce, support zone defense, and breakout from consolidation provide a solid basis for swing traders aiming to capture a move toward the all-time high. As long as price remains above the $3,265 level, bullish positions remain valid.

Gold delivering excellent Trading opportunitiesTechnical analysis: Gold is consolidating on Hourly 4 chart after it entered my expected #3,342.80 - #3,322.80 Neutral Rectangle zone with #3,342.80 as an possible stop and local High’s. Upper maximum extension can reach #3,352.80 benchmark / Hourly 4 chart’s extension if Resistance breaks. Both ways, I doubt that Neutral candles will last for long as Gold will be ready for another Buying or Selling sequence, where another slide might be in the aftertime. It is important to note that DX found the Support and engaged the spiral recovery (# +0.81%) which can add Selling pressure on Gold. I will use this configuration and observing market closing (closing below #3,312.80 confirms the downtrend extension), where Gold is Technically ready for #3,300.80 - #3,252.80 benchmark test. DX however remains merely Neutral on bigger charts however near Lower High’s peak, adding Volatility on Gold counterbalancing mixed values on Yields. This gives me the impression that Gold has at the moment more probabilities to a Short-term uptrend than break below the Support zone. Gold continues to be contained within parabolic uptrend however isolated within Neutral range for the last #1 - #2 consecutive sessions. Daily chart is on (# +0.58%) switch and represents an cautious fractal. Keep in mind that the Medium-term pattern on Daily chart is an Ascending Channel and Gold is on its Higher High’s decimal zone with Lower levels being a potential Lower High’s Target. Total Neutrality and balance between the Support and Resistance lines is consolidation phase of next major move ahead.
My position: I have expected #3,300.80 benchmark touch throughout yesterday's session where I engaged Selling order on #3,345.80 (entry point). Due news outcome, #3,352.80 was tested which triggered my Stop-loss and left me without any orders. Later on, Gold dipped towards #3,300.80 benchmark (what I did expect) as I managed to re-Sell Gold on #3,322.80 and close the order on #3,307.80. I am without any orders as Gold is Trading within Neutral Rectangle. I will Trade the break-out of values I explained above.
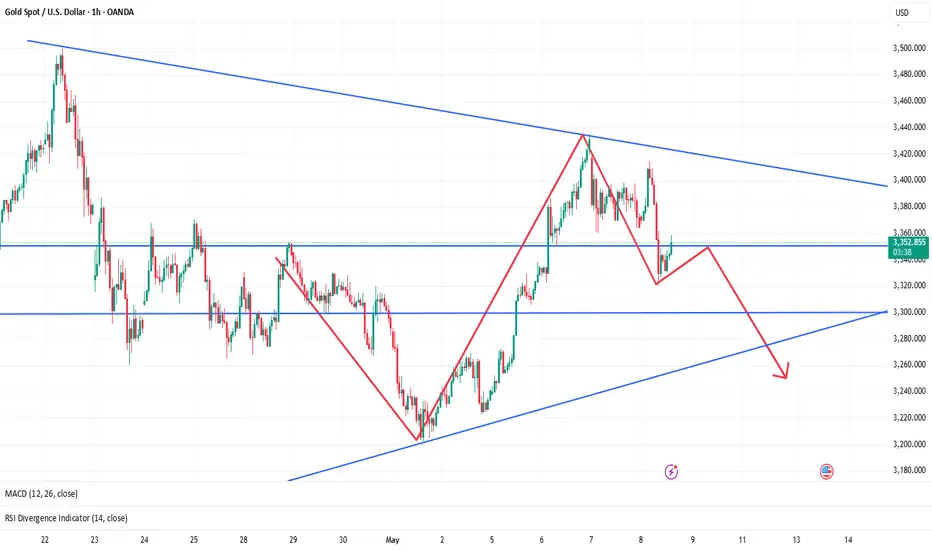
Pay attention to 3360 and go short if it does not break🗞News side:
1. China and the United States hold talks on trade issues
2. India-Pakistan conflict escalates again
3. Geopolitical risks
📈Technical aspects:
At present, gold has fallen below the trend line support. In the short term, we should focus on the battle for 3360. This point is not only the previous support-to-resistance level, but also the key signal for judging the trend reversal. If it cannot hold on to this position, the short trend will continue; if it recovers effectively, it may return to above 3400. Before losing the defensive line (the last starting and falling point) 3360-3362, the bears will still have the upper hand. It just so happens that the 4H lifeline is also in the 3360-3362 area. If the suppression is successful, the price will enter the 3362-3284 area from the lifeline to the lower track.
The rebound layout of the US market operation is short-selling, with the target at 3340-3330, and further support at 3310-3300.
If you agree with this view, or have a better idea, please leave a message in the comment area. I look forward to hearing different voices.
TVC:GOLD FOREXCOM:XAUUSD FXOPEN:XAUUSD FX:XAUUSD OANDA:XAUUSD
Continues Bullish TrendStill focus on buy for gold and possibly retest previous ATH or creating a new ATH from current lvl price 3400<>

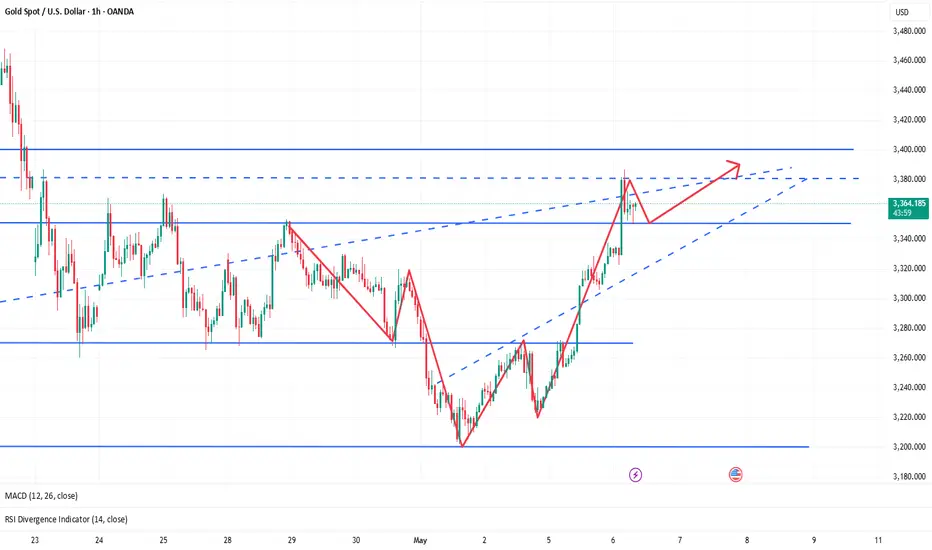
Gold Intraday Trading Plan 5/8/2025Gold was rejected yesterday at 3430 and went down all the way to 3360. It will be interesting to see the close of the 4hrly and 8hrly candle. If we see a rejection from 3350-3360. We may have another bull run.
If 3350-3360 is held, I will buy toward 3430 or even 3500. Otherwise, I will wait for clearer direction.

Gold Trading Strategy, May 7-8📊From the hourly level, gold formed a double-needle bottoming pattern near 3360 during the early morning correction, showing strong short-term support. At the same time, 3350, as the low point of yesterday's Asian session correction, also constitutes an important support area at present, which needs to be focused on in the short term.
📊Before the announcement of the Fed's interest rate decision, market sentiment is relatively cautious, and gold is expected to continue to fluctuate at a high level in the range of 3350 to 3400. In terms of trading strategy, you can continue to maintain the idea of selling high and buying low in the range, that is, try to short with a light position near 3400, and try short-term long orders when it falls back to 3350.
📊If gold breaks below the 3350 support line, it means that the short-term structure will weaken. It is recommended to follow the trend and go short. The further downward target can focus on the 3290 line, which is an important platform support area in the early stage.
✅Short-term Trading Strategy:
🔰Within the range (3350-3400): mainly sell high and buy low;
🔰If the support of 3350 is broken: follow the trend and go short, the target is around 3290;
🔴Upper resistance level: 3400-3410;
🟢Lower support level: 3350, 3290.
✅Trading strategies are time-sensitive. We will provide members with real-time and accurate trading strategies based on market changes. Short-term trading requires flexibility, timely adjustment of positions, strict risk control, and ensuring that you are not affected by large fluctuations.

XAUUSD – 30m Buy Setup | Fair Value Gap + Fib + Liquidity Sweep📈 GOLD LONG – May 6, 2025 | Smart Money Trade Setup
We're seeing an incredibly clean bullish setup form on Gold (XAUUSD) with textbook Smart Money Confluences:
🔍 KEY CONFLUENCES:
🟥 FVG (Fair Value Gap): Price tapped the FVG perfectly and respected it
📐 Fib Zone: Confluence of 70.5–79% retracement with demand reaction
💧 Liquidity Grab: Below short-term equal lows before bullish push
📉 Divergence: Internal lower highs vs external equal lows = engineered setup
🧱 Structure: Short-term bullish BOS (Break of Structure) above recent swing
📊 Trade Plan (Long Setup):
🎯 Entry: ~$3,325.6 (FVG zone base)
⛑️ SL: Below FVG at ~$3,323
🚀 TP: $3,404 zone (clean inefficiency magnet)
💥 RRR: 1:5+ sniper trade
🧠 Execution Notes:
Wait for LTF bullish structure shift confirmation (5m BOS)
Add confluence with volume divergence or SMT (Smart Money Toolkits)
Manage the trade once it reaches 3,350 zone
Break-even and partials at mid-Fib zone (around 3,352–3,360)
💬 Chart Ninja Wisdom:
"Price doesn’t lie—liquidity does. When price leaves a gap, Smart Money’s coming back for it."
📌 SETUP OVERVIEW:
Timeframe: 30m
Entry Type: Limit (FVG tap zone)
Bias: Bullish
Target: Clean inefficiency above
Type: High-probability setup with strong RR and structure support
💥 Tap 💾 to save this sniper setup.
📣 Tag your gold-trading crew & get ready for that pump!
📆 Watch how this plays out live—discipline > hype.

Analysis of gold market trendIn terms of short-term gold operation ideas, it is recommended to short on rebounds and long on pullbacks. The short-term focus on the upper side is the 3328-3330 resistance line, and the short-term focus on the lower side is the 3260-3252 support line.

Gold returns to the bull market as expected, follow-up layout🗞News side:
1. The “demand shock” of the Trump administration’s tariffs on the global economy
2. The United States rejected Japan’s request for a comprehensive exemption from 10% reciprocal tariffs and country-specific tariffs in recent negotiations.
3. The conflict between Israel and the Houthis
📈Technical aspects:
From a technical point of view, the 4H gold bulls are once again making an impact. At the top, we focus on the short-term suppression of the 3380-3390 line, focusing on the suppression of the 3400 line. Below, we focus on the short-term support of the 3350 line, and the important first-line support of 3335-3340. In terms of operation, we mainly go long by stepping back on 3350-3360, and the target is temporarily looking at 3380-3390. In the middle position, we should watch more and move less, pursue orders cautiously, and wait patiently for key points to enter the market.
If you agree with this point of view, or you have a better idea, please leave a message in the comment area. I look forward to hearing different voices.
OANDA:XAUUSD FX:XAUUSD FXOPEN:XAUUSD FOREXCOM:XAUUSD TVC:GOLD
Gold – Focus on the Specific Details of US/China Trade TalksGold prices rallied 0.6% on Friday to close at 3325 as traders rushed to obtain some safe haven protection against the uncertainty of whether the outcome of trade negotiations between the US and China, taking place in Geneva over the weekend, may yield positive or negative results which could have significantly impact all markets on the Monday open.
Roll forward 2 days and Gold has fallen to a low of 3259 (at time of writing) in early Monday trading as traders digest and then react to both the US and China reporting ‘substantial progress’ in their talks. This news seems to have initially boosted risk sentiment and reduced the need for traders to own Gold as a hedge, at least for now anyway.
While light on detail, initial reports indicate that the trade teams from the world’s two biggest economies have agreed to create a mechanism for further talks. US Treasury Secretary Bessant and Trade representative Greer are expected to hold a press briefing later this morning to share more specific details, so there is room for disappointment, which could see Gold rally back to higher levels, or more progress than anticipated by markets, which may see Gold extend its sell off down to potential key technical support levels.
Technical Update: Decision Making Progress Develops
On April 24th 2025, we published a commentary on Gold, highlighting its inability to break above the psychological round number resistance at 3500, from which a sell-off was developing. Please look back at our timeline to read our thoughts at that time.
The setback from these all-time highs at 3500 did extend further, and tests of 3228, which was equal to the 50% Fibonacci retracement (April 7th to April 22nd 2025 price strength) did materialise.
After initially seeing the strong bounce from 3228 last week, it appears that traders may be focusing on this level as a possible important support over coming sessions.
What is the Current Situation for Gold?
While much will depend on future price trends and market sentiment, it could be suggested that recent price activity in Gold since the April 22nd session all-time high, has established both upper and lower extremes of a developing sideways range, between 3228 and 3500.
This type of sideways activity represents something of a ‘balance’ between both buyers and sellers of Gold. Price strength has been met by selling pressure at 3500, while buyers have materialised around 3228, the 50% retracement level.
However, it could even be suggested after the price weakness from last Tuesday’s 3435 session high, immediate resistance could now be lowered to this 3435 level.
Predicting the direction of an eventual range breakout is difficult, and we must wait for either a confirmed closing break below 3228, or above 3435 to suggest the next possible direction of a more sustained phase of price movement. Until such a breakout materialises, extension of the choppy sideways activity, as seen recently, could continue.
Upside Focus: If potential is to turn towards further attempts to extend price strength, it may well be suggested by closes above last week’s 3435 high. While breaks of these 3435 extremes won’t be a guarantee of price strength, it might lead to retests of the psychological 3500 high, even towards 3570, which is the 300% Fibonacci extension of the October 31st to November 14th 2024 decline.
Downside Focus: To the downside, traders may well continue to focus on the 3228 Fibonacci retracement level as support, with closing breaks perhaps pointing to risks for further price declines. Such moves may then lead to weakness towards 3164, which is the lower 61.8% retracement level.
The material provided here has not been prepared in accordance with legal requirements designed to promote the independence of investment research and as such is considered to be a marketing communication. Whilst it is not subject to any prohibition on dealing ahead of the dissemination of investment research, we will not seek to take any advantage before providing it to our clients.
Pepperstone doesn’t represent that the material provided here is accurate, current or complete, and therefore shouldn’t be relied upon as such. The information, whether from a third party or not, isn’t to be considered as a recommendation; or an offer to buy or sell; or the solicitation of an offer to buy or sell any security, financial product or instrument; or to participate in any particular trading strategy. It does not take into account readers’ financial situation or investment objectives. We advise any readers of this content to seek their own advice. Without the approval of Pepperstone, reproduction or redistribution of this information isn’t permitted.

XAUUSD SELL TRADE RESULT Gold running 200 pips from the level we given on Friday enjoy profit guys
Wait for new week moment gold will be down

GOLD: Long Trade with Entry/SL/TP
GOLD
- Classic bullish formation
- Our team expects growth
SUGGESTED TRADE:
Swing Trade
Buy GOLD
Entry Level - 3338.10
Sl - 3330.1
Tp - 3353.0
Our Risk - 1%
Start protection of your profits from lower levels
Disclosure: I am part of Trade Nation's Influencer program and receive a monthly fee for using their TradingView charts in my analysis.
❤️ Please, support our work with like & comment! ❤️

GOLD BUY NOW!!!!!!!!XAUUSD completed +660pips from my yesterdays analysis today we have price take out the buyside with a retest off the demand zone and price above the POC level and VAL am in on buys holding till 3,439 is completed....

GOLD - WAVE 4 CORRECTION TO $2,800 (UPDATE)We've seen a nice 850 PIPS drop on Gold today, after rejecting our 0.365% zone as anticipated. Expecting a continuation lower. Still aware we are in a Wave 4 correction, so being patient with choppy price action.

GOLD UPDATE
AronnoFX will not accept any liability for loss or damage as a result of
reliance on the information contained within this channel including
data, quotes, charts and buy/sell signals.
If you like this idea, do not forget to support with a like and follow.
Traders, if you like this idea or have your own opinion, please feel free command me.

WHAT DO YOU THINK ?Hello dears
Given the regular sinusoidal trend that gold is taking, it was expected to move to the specified numbers, but don't forget that we are at a price ceiling and a sharp upward movement at the end of the upward trend can be a trap...
In case of a drop, the specified ranges are good support.
*Trade safely with us*

Beyond Technical Analysis Chances the market go down retest the imbalance zone are there now we look for short term sell to pick up liquidity.

Bullish or bearish? (Read description). As of May 7, 2025, the XAU/USD (gold) market is experiencing fluctuations influenced by a combination of geopolitical developments, economic indicators, and central bank policies. 
⸻
📉 Recent Market Movements
Gold prices recently declined by 1.3% to $3,383.88 per ounce, retreating after nearly a 3% rise the previous day. This drop comes amid growing optimism over U.S.-China trade negotiations, diminishing the appeal of safe-haven assets like gold. Additionally, markets are focused on the Federal Reserve’s policy decision expected later in the day, with the central bank likely to hold interest rates steady while maintaining flexibility due to uncertainties from the trade war. 
⸻
🔮 Outlook for XAU/USD
Despite the recent pullback, the long-term outlook for gold remains bullish. Goldman Sachs projects that gold will continue to outperform silver due to sustained central bank demand, which has structurally elevated the gold-silver price ratio. Currently, the ratio stands at approximately 102, up from 84.7 a year ago. Factors such as slowing Chinese solar production, high recession risks, and robust bullion purchases by central banks contribute to gold’s stronger performance. Goldman Sachs maintains a bullish outlook on gold, forecasting a base price of $3,700 per ounce by year-end and $4,000 by mid-2026. 
⸻
📊 Technical Analysis
A key resistance level is observed at $2,660, with support around $2,600. A breach below this support could lead to further downside towards
$2,500.  
⸻
⚠️ Key Factors to Monitor
• Federal Reserve’s Policy Decisions: Anticipated rate cuts could influence gold’s appeal.
• Geopolitical Tensions: Ongoing conflicts may drive demand for safe-haven assets.
⸻
✅ Conclusion
While short-term fluctuations are expected, the long-term prospects for XAU/USD remain positive, supported by strong demand from central banks and geopolitical uncertainties. Investors should monitor key economic indicators and central bank policies for potential impacts on gold prices.  
⸻

How to Trade Gold with AI-Powered Algos in 2025📊 How to Trade Gold with AI-Powered Algos in 2025
A practical action plan for serious gold traders
🔍 1. Know Why Gold Requires Custom Algo Tactics
Gold is volatile, news-sensitive, and driven by macro events like Fed policy, geopolitics, and inflation. Generic stock or crypto bots fail here — gold needs precise, event-aware automation.
🧠 2. Use AI-Powered Bots Trained for Gold Volatility
Deploy bots that adapt to real-time data like CPI releases, bond yields, and geopolitical headlines. Use machine learning models that detect gold breakouts, consolidations, and safe-haven flows.
Top AI algos for gold traders: Multiple systems based on MT4/MT5
Fully-automated, AI-based gold bot with breakout detection, precision entries, and built-in risk control.
⚙️ 3. Build or Choose the Right Algo Strategy for Gold
Trend-Following: Use 21/50 EMA crosses on H1 and H4
Mean Reversion: Bollinger Band fades in range-bound sessions
Breakout Algos: Trigger trades on CPI or FOMC event volatility
Volume-Based AI: Analyze volume spikes vs. historical patterns
🧪 4. Backtest Gold-Specific Models
Always test your bot using historical gold data, especially during NFP weeks, Fed meetings, and geopolitical escalations. Use data from 2018 to 2024 for high-volatility periods.
Tools: TradingView for Pine Script testing, MetaTrader 5 for EA deployment
🛡️ 5. Control Risk with Gold-Specific Parameters
Max drawdown: Keep under 15 percent
Stop-loss: Always use hard stops (not just trailing)
Position sizing: 0.5 to 1 percent of capital per trade
Use volatility filters: Avoid entries during thin liquidity hours
🔄 6. Automate Monitoring and Adaptation
Run multiple bots for breakout, momentum, and reversal setups
Use dashboards to track gold-specific metrics like VIX, USDX, DXY, and 10Y Treasury yields Integrate AI that adjusts parameters after major data releases
🚀 7. Prepare for 2025 Market Structure
Gold is increasingly driven by
Central bank digital currency rollouts
USD de-dollarization risks
Global stagflation or recession themes
DeFi and tokenized gold products
Your algo must factor in these macro narratives using real-time data feeds
📌 Gold Algo Trading Success Plan 2025
Use AI bots built for gold volatility
Trade high-probability breakouts post-news
Backtest with gold-specific macro filters
Maintain strict risk limits with max 15 percent drawdown
Monitor global news and macro data with bot triggers
Continuously optimize and adapt
Gold is not just a commodity — it’s a signal of global risk. Automate smartly, manage risk tightly, and use AI to stay one move ahead.

GOLD - FVG-Based Long & Short Setup Within Range ContextPrice action remains range-bound with well-defined FVG zones acting as both support and resistance, offering reactive trading opportunities on both sides.
---
1. Upper FVG as Resistance — Short Setup Trigger Zone
The highlighted upper green zone marks:
- Fair Value Gap (FVG): A clear inefficiency from the previous bearish impulse.
- Structural Significance: Price has struggled to break and hold above, showing signs of supply reactivation.
This zone is likely to attract sellers upon revisit, offering a clean risk-defined short opportunity.
---
2. Lower FVG as Support — Long Setup Zone
The lower blue zone serves as:
- FVG Rebalance Area: A region where price previously left inefficiency, now acting as strong support.
- Accumulation Interest: Smart money often reloads in such imbalanced areas on retests.
This zone is optimal for positioning into the next bullish leg should price dip lower.
---
3. Liquidity Sweep Mechanics — Trap Both Sides
The market structure hints at:
- Step 1: Induce buyers into breakout longs into resistance.
- Step 2: Reverse from FVG, triggering short entries and trapping longs.
- Step 3: Collect liquidity from lower range, potentially initiating new accumulation.
This movement pattern is characteristic of engineered liquidity grabs in both directions.
---
4. Mid-Range Reaction — Key Pivot Area
Price currently hovers around the mid-range zone:
- Serving as a temporary balance point before volatility expansion.
- Acting as a launchpad for the next impulsive move, depending on order flow dominance.
Patience here is key — waiting for clean confirmations near FVGs provides optimal entry quality.
---
5. Summary:
- Upper FVG Resistance → Short Bias
- Lower FVG Support → Long Bias
- Structured Reactions Around Imbalances Suggest Smart Money Activity
This is a dual-sided setup ideal for reaction-based traders awaiting price confirmation at extremes.

Momentum Shift: Gold Holds Strong Amid Mounting Dollar PressureHello,
🪙 Gold Market Outlook – May 8, 2025
📈 Current Price Snapshot
Spot Gold (XAU/USD): $3,302/oz
Gold is holding firm above key support levels, signaling sustained bullish momentum. The $3,300 level has now been clearly breached and is acting as short-term support. If this level continues to hold, further upside continuation is expected, with a possible target of $3,500.
🧭 Technical Outlook
4H Major Support: $3,274.637
1D Floor Support: $3,265.328
1W Pivot Point (PP): $3,265.203
1M Pivot Point (PP): $3,248.445
"A test of the weekly/monthly pivot points is possible but uncertain, as current sentiment favors risk-on for gold, while the USD faces risk-off pressure."
A pullback to support is possible, but it’s unlikely under the current macro and technical context.
💬 Macro Fundamentals
Gold prices fell earlier today due to optimism surrounding a potential Trump–UK trade deal and easing geopolitical tensions. However, the market remains cautious as US-China officials are scheduled to meet in Switzerland. Meanwhile, China's central bank approved foreign exchange purchases by commercial banks, further boosting gold imports and supporting physical demand.
"Such measures are likely to keep supporting bullion demand."
— Han Tan, Exinity Group
🌍 Geopolitical Risk Factor
India-Pakistan tensions have escalated, with Pakistan downing 12 Indian drones, which is contributing to increased safe-haven demand in the region.
"Potentially leading to an unquantifiable level of safe-haven demand."
— Ole Hansen, Saxo Bank
Target: $3,500.
The Support and Resistance outlined in green and red are the respective support/resistance for this pair currently for 1M-1Y timeframes!
No Nonsense. Just Really Good Market Insights. Leave a Boost
TradeWithTheTrend3344

GOLD(XAUUSD) -Weekly Forecast,Technical Analysis & Trading IdeasMidterm forecast:
2772.38 is a major support, while this level is not broken, the Midterm wave will be uptrend.
TVC:GOLD OANDA:XAUUSD
Technical analysis:
A trough is formed in daily chart at 2956.50 on 04/07/2025, so more gains to resistance(s) 3357.00, 3500.00 and more heights is expected.
Take Profits:
2833.00
2879.11
2955.00
3057.40
3160.00
3257.03
3357.00
3500.00
__________________________________________________________________
❤️ If you find this helpful and want more FREE forecasts in TradingView,
. . . . . . . . Hit the 'BOOST' button 👍
. . . . . . . . . . . Drop some feedback in the comments below! (e.g., What did you find most useful? How can we improve?)
🙏 Your support is appreciated!
Now, it's your turn!
Be sure to leave a comment; let us know how you see this opportunity and forecast.
Have a successful week,
ForecastCity Support Team
