XAUUSDHello Traders! 👋
What are your thoughts on Gold?
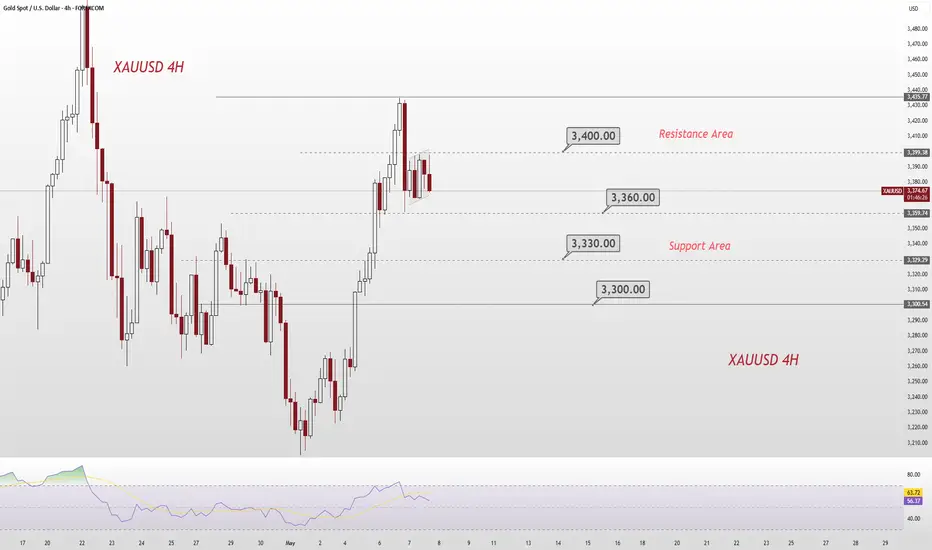
After a strong upward move, gold entered a corrective phase upon reaching the $3500 resistance zone.
The current pullback is expected to extend toward the identified support area and the ascending trendline, where buying interest may reappear.
As long as gold holds above the support and trendline, the long-term trend remains bullish.
This correction could offer a buy-the-dip opportunity, with potential for a move back toward the recent highs.
Will gold find support and resume its rally? Share your thoughts below!
Don’t forget to like and share your thoughts in the comments! ❤️
XAUUSD trade ideas

Gold: Bearish Trend Continues as Prices Retreat from HighsIn the gold market today, there has been a certain rebound, which is stronger compared to before. However, after the price soars, it quickly falls back, further confirming the overall bearish tone. During the US trading session, we decisively placed a short order at the price of 3360, and subsequently, the market plummeted as expected. Judging from the current trend, gold is still in a bearish trend of pulling back from a high level. If there is a rebound in the future, we can still seize the opportunity to go short.
Technically, the moving average of the one-hour level of gold has started to turn downward. During the US trading session, after gold soared, it immediately entered a mode of significant decline, and the trend highly coincides with expectations.
Nevertheless, there are two possibilities for the subsequent market: if there is a substantial rebound in gold, then the market is likely to maintain a pattern of large-range fluctuations; but if the rebound fails to break through the level of 3320, it is sufficient to indicate that the bullish momentum is weak, and at that time, gold is very likely to completely enter a unilateral bearish trend.
Therefore, in the subsequent US trading session, we should focus on the pressure-bearing situation when gold rebounds to the level of 3320. Once it is blocked here, we can place a short order at a high price and grasp the profit-making opportunity under the bearish trend.
XAUUSD
sell@3320-3325
tp:3300-3280
Investment itself is not risky; it is only when investment is out of control that risks occur. When trading, always remember not to act on impulse. I will share trading signals every day. All the signals have been accurate without any mistakes for a whole month. No matter what gains or losses you've had in the past, with my help, you have the hope of achieving a breakthrough in your investment.

Gold's decline under pressure is in line with expectations!From the perspective of the gold hourly line, the morning closed with a full sun, effectively breaking through the resistance of yesterday's 3360-3397 box. Therefore, it is definitely necessary to try to confirm the continued bullish trend after a pullback. The continuous diving in the afternoon refreshed the intraday low, which can only mean that the market is washing out, and all the long and short positions are driven out, and then brewing again; If the European session remains weak below 3350, there may be some room for further decline tonight, but the continuity may not be great, and it is easy to stabilize and bottom out and pull up; the current support is 3320, 3315, and 3305. If a stabilization signal is touched around 22:00, it is bullish. I personally think that there is limited space below 3300, and resistance is 3360, 3365, and 3370. If a pressure signal is touched around 20:00, it will fall back first; if it returns to above 3370, the trend will gradually become stronger, and it will be treated as a wide range of fluctuations for the time being;
On the whole, today's short-term operation strategy for gold is to short on rebounds and long on pullbacks. The short-term focus on the upper side is 3370-3375 resistance, and the short-term focus on the lower side is 3280-3290 support. Friends must keep up with the rhythm.
Short order strategy:
Strategy 1: Short 20% of the gold position in batches when it rebounds to around 3365-3370, stop loss 10 points, target around 3330-3305, and look at 3290 if it breaks;
Long order strategy:
Strategy 2: Long 20% of the gold position in batches when it pulls back to around 3285-3290, stop loss 10 points, target around 3310-3330, and look at 3350 if it breaks;

It's a shame that gold will continue to fallGold Weekly Forecast
Gold closed last week below the previous weekly lows at 3,260, confirming bearish intent. Price has now left behind multiple imbalances from the bullish leg that started at the 3,000 level.
We could first see a retracement to the small imbalance zone around 3,300, followed by a bearish continuation back to the main support/imbalance zone near 3,000.
Sideways price action is likely early in the week — but unless bulls reclaim 3,300+, momentum favors a retest of the base.
Bias: Bearish
Key Zones:
• Resistance / Rebalance: 3,300
• Support / Imbalance Target: 3,000
—
Weekly forecast by Sphinx Trading
Drop your view in the comments.
#Gold #XAUUSD #GoldForecast #LiquidityVoids #TechnicalAnalysis #SphinxWeekly #SmartMoney #FVG #3kLevel

Can I buy the bottom when gold plummets?Affected by the optimistic news about Sino-US trade, spot gold opened sharply lower, and then the price of gold further declined. The current price of gold is around 3226 US dollars per ounce, and it has plunged nearly 110 US dollars in the day. Since the opening of gold, it has opened lower at 3275, and rebounded to 3292, and then began to fall. As of now, gold has hit 3216 as the lowest and then fluctuated upward. The bulls are temporarily suppressed. We still focus on rebounding and shorting. After all, the general trend is mainly bearish. The upper 3280-3290 line is the main short-term suppression level. If the rebound is not broken, it can continue to short. The short position may continue to reach a new low. Pay attention to the support of the 3200 mark.

Can I buy the bottom when gold plummets?Technical analysis of gold: Affected by the optimistic news about Sino-US trade, spot gold opened sharply lower, and then the price of gold further declined. The current price of gold is around 3226 US dollars per ounce, and it has plunged nearly 110 US dollars in the day. Since the opening of gold, it has jumped down to 3275, and then rebounded to 3292, and then began to fall. As of now, gold has touched 3216 and then fluctuated upward. The bulls are temporarily suppressed. We still focus on rebounding and shorting. After all, the general trend is bearish. The upper 3280-3290 line is the main short-term suppression level at present. If the rebound is not broken, it can continue to be short. The short position may continue to reach a new low. Pay attention to the support of the 3200 mark. Due to the easing of the Sino-US trade war, gold opened directly in the morning. The plunge we expected last week came ahead of schedule. The plunge we expected last week came directly ahead of time. There was a technical gap above the early trading. Therefore, it is not recommended to blindly chase shorts at the moment. It is more reasonable to consider after filling the gap.
From the gold hourly chart, the focus below is on the 3200 integer mark. If the market stabilizes below 3200, then this is a big double top, and the next decline will extend to the vicinity of the 3000 integer mark. On the contrary, if the 3200 mark is not broken, then the bulls will fight back, at least they will fill the gap again! Therefore, in terms of operation, it is not recommended to chase the short now, and it is recommended to wait for the fall back to the 3200-3210 area to stabilize and buy! On the whole, today's short-term operation of gold recommends mainly shorting on rebounds, supplemented by longs on callbacks. The top short-term focus will be on the first-line resistance of 3280-3290, and the bottom short-term will focus on the first-line support of 3200-3202. Friends, you must keep up with the rhythm.
Short order strategy:
Strategy 1: Short 20% of the position in batches when gold rebounds to around 3280-3290, stop loss 10 points, target around 3250-3230, and look at the 3200 line if it breaks;
Long order strategy:
Strategy 2: Long 20% of the position in batches when gold pulls back to around 3200-3203, stop loss 10 points, target around 3230-3250, and look at the 3280 line if it breaks;

Gold is once again experiencing its extreme take-off trend!📌Fundamentals:
1. There are signs of escalation in the India-Pakistan conflict
2. The Fed's interest rate decision dominates this week's market
3. The international trade situation disturbs market sentiment
4. Market sentiment and capital flows
📊Technical aspects:
The 4-hour cycle still needs a wave of strength, and it needs to go out of a wave of big rises before it can open the Bollinger upper track to form an absolute unilateral strength. Therefore, although it is temporarily bullish, there is also a certain possibility of adjustment. The current 4-hour cycle support is around 3310, and the small cycle performance support is around 3350, so don't chase more.
🎯Practical strategy:
Gold pulls back to around 3365-3375 to go long, and the target is around 3400-3420.

XAUUSD update Plan B after FOMCIf 3360 - 3350 level support broken, it could be make a retracement with 62% fibonaci.
Goodluck !

Gold range shock , Both long and short have a chance!📌Fundamentals:
1. There are signs of escalation in the India-Pakistan conflict
2. The US-Houthi ceasefire agreement
3. The Fed's interest rate decision dominates this week's market
4. The international trade situation disturbs market sentiment
5. Market sentiment and capital flows
📊Technical aspects:
The market came out in the Asian session. It stalled again later. We are used to seeing fluctuations of hundreds of points. A fluctuation of more than ten or twenty points a day is the same as no fluctuation. At present, the market is temporarily maintained in the range of 3400-3360, and there is not much fluctuation. At present, let's see where the market breaks through. If it retreats to around 3360, follow up with long orders. If it rebounds to around 3400, follow up with short orders.

Gold: High - level Oscillation, Short - term Adjustment & StrateFrom the perspective of the daily chart trend of gold, after two consecutive days of strong rebounds, the price has pulled back, indicating significant selling pressure at higher levels and a need for a technical adjustment in the short term. Currently, the price has dropped back to around $3,400, which is the support area of the previously broken gap. If this level is breached, it may further test the $3,350 level. In terms of technical indicators, the RSI has retreated from the overbought zone, and the MACD red bars are shortening with signs of a potential death cross, suggesting a weakening of momentum. Additionally, the 5-day moving average has started to turn downward. If gold fails to regain the $3,440 level, it will confirm the formation of a short-term top.
Overall, gold is currently in a high-level consolidation phase. Without the impetus of new safe-haven factors, the adjustment is likely to continue. Despite the intensification of geopolitical risks, the current financial market is more inclined to focus on changes in global trade sentiment, which has diminished the appeal of traditional safe-haven assets such as gold. The long-term support for gold remains intact, but in the short term, it may be affected by the strength of the US dollar and the restoration of risk appetite.
For today's short-term trading of gold, the recommended strategy is to go long on pullbacks and go short on rebounds. In the short term, key resistance levels to watch are in the range of $3,405 - $3,430, and key support levels are in the range of $3,360 - $3,350.
Investment itself is not risky; it is only when investment is out of control that risks occur. When trading, always remember not to act on impulse. I will share trading signals every day. All the signals have been accurate without any mistakes for a whole month. No matter what gains or losses you've had in the past, with my help, you have the hope of achieving a breakthrough in your investment.
Thinking and practical skills for winning in the 3360-3400 rangeAffected by the news, gold fell sharply at the opening. Successfully won. According to the trading strategy, we gave gold a wide range of fluctuations in the 3360-3400 range, which will not change much. It can be operated within the range during the day. The trading strategy analysis is accurate, and the key points are accurately grasped to enter the market, which brought us good returns during the day. The short-term rhythm is accurately grasped! Brothers who followed the trading plan should have also made very good profits. 🍻🍻🍻

Circular short selling is still the main themeGold has no power to rebound in the Asian session, and it keeps fluctuating and falling. The highest rebound was 3292, but it fell back under pressure, and the lowest touched 3217. The fluctuation and decline are still dominant, so we only need to short on the rebound. It is still difficult to fill the gap at the opening today, so don't have hope. Just keep shorting on the rebound. The weekend article also analyzes the bearish opening this week. After all, the international situation of India and Pakistan's comprehensive ceasefire and Russia-Ukraine ceasefire negotiations are mainly bearish for gold. Coupled with the technical shorts, it is reasonable for gold to jump short. Today, we will treat gold as rebound shorting. In terms of operation, we will mainly short on rebound and be a steady trader. Judging from the current trend of gold, the main short rhythm of the pullback will continue to remain unchanged before the daily level breaks through and stands at this position.

The market is full of crises next week!📌Fundamentals:
This weekend, China and the United States held two days of negotiations as scheduled. It seems that there are many topics to discuss and the scope is wide, but they are still trying to reach a consensus. Otherwise, there is no need to spend two days of intensive talks. Some people think that after so long, there is no conclusion, which is bad news. I think the opposite. At this time, no bad news means good news. Based on the current "marathon" negotiation time, we need to be vigilant about the expected difference in the results of this round of negotiations. The second is the India-Pakistan conflict. After the talks led by the United States, India and Pakistan have agreed to a comprehensive and immediate ceasefire. Judging from this line alone, there will definitely be no risk of risk aversion rising when the market opens on Monday. The only thing is that the results of this round of negotiations between China and the United States are quite important, and there will definitely be results before the opening of Monday.
📊Technological aspects:
Even if the current round of China-US negotiations achieves an optimistic result, gold cannot fall below 3300. If it falls below 3300 and hits the low point below 3275 again, then the next step for gold is very likely to touch the high point of 3160-50 where the trade war started. On the contrary, if gold can hold 3300, then it is very likely to move like the previous wave, break the range, stand above 3360-70, then gold will continue to return to above 3400. Therefore, the most critical position for the opening of next week is the support position of 3300 below and the suppression position of 3360-70 above. If it breaks, the trend will almost move in that direction.

Gold rebound is weak, full analysis of high-altitude strategiesTechnically, gold faces the test of whether the double top pattern can be established. The progress of the trade agreement may exceed expectations. In the short term, the gold price is disturbed by the trade news, but in the long term, geopolitical, debt and interest rate cuts still support the upward trend of gold prices. Gold stabilized and rebounded after hitting a low of 3207 during the European session, and further rose to a high of 3248 during the US session. However, the rebound momentum was relatively limited, and the current price maintained a volatile pattern within the 3220-3248 range. At present, 3250 has become a key resistance level. If it can effectively break through and stand firm, the gold price is expected to further test the 3270-3288 area. However, from the perspective of short-term momentum, it is still facing downward correction pressure in the late trading period. Technically, the upper resistance is concentrated in the 3248-3252 range, and the lower support is around 3225-3217. In terms of operation, it is recommended to mainly do long positions on callbacks, supplemented by rebounds from high altitudes.
Operation strategy 1: It is recommended to do more on the pullback in the 3225-3217 area, with a target of 10-15 points.
Operation strategy 2: It is recommended to short at the rebound area of 3245-3252, with the target at 10-15 points.

Gold Mirage Trap: The Ultimate Liquidity Heist-[12May2025]What Retail Traders Don’t See in Today’s Gold Moves Institutional Liquidity Manipulation – A Step Ahead of Illusion Analysis
My view is rooted in fact and data—no noise, no distraction, no rush. X-Plus, the system I designed, precisely maps liquidity and movement. A smart trader remains independent, confident, and waits for confirmation before acting.
Introducing X-Plus: The Ultimate Precision System for Liquidity Mapping The market thrives on deception—misdirection, false breakouts, engineered liquidity traps. X-Plus exposes the illusion, pinpoints institutional execution layers, and keeps traders ahead of liquidity hunts instead of becoming their victims.
Before reading further, here is my take: This sequence represents the real institutional mechanics being set up for today’s move:
First up —a deceptive liquidity sweep above $3,379, creating false bullish momentum. Then down —a sharp selloff, breaking below $3,265, targeting deeper liquidity around $3,169. Finally, a sharp up —a fast recovery, engineered to trap bears, before surging toward the next 3-drive pattern peak of wave D.
Let's see how it will play out, yeah?
Retail traders will think they understand the trend, but institutions are controlling every step of the trap—this is a pure liquidity engineering play.
The inducement phase isn't just clearing liquidity—institutions are layering orders in dark pools while pushing a false trend onto visible exchanges. The pre-bell setup isn't about creating FOMO for retailers—it's actually about internal clearing for institutional portfolios that need rebalancing ahead of NYSE.
Macro Price Engineering Beyond SMC Narratives
Retail traders believe the pre-bell liquidity sweep is setting trend direction, but in reality, it’s engineering spread control for futures market execution. Volatility spikes aren’t retail-driven—they’re forced by institutional hedging adjustments in the fixed-income derivatives market, which most traders don’t factor into gold moves.
The Hidden Psychological Manipulation Behind Today’s Price Action
The illusion of market control isn't just baiting traders into stop-hunts—it’s actually resetting sentiment indicators that institutions use to fine-tune algorithmic executions later in the session. The price structure you're seeing isn't about accumulation or distribution—it's about forcing incorrect risk-reward calculations on retail traders so they mismanage their sizing, setting up deeper liquidity for NYSE execution.
The Real Execution Plan – Not Just a Reflection of Speculation
Liquidity sweeps aren't designed for direct stops today—they're actually pre-loading supply zones before derivative contract adjustments trigger auto-liquidation mechanisms. The predicted downside move isn't incorrect, but the true reversal won't happen where retail traders think—it'll be forced at a miscalculated low to trap institutions into forward-roll risk positions. NYSE won’t just sweep the bears before climbing—it’ll use forced dealer hedging activities to inflate volume before rejecting most breakout traders who take the upside move too early.
Gold Price Action Breakdown 📍 Current Market Levels Front Month Gold Contract: $3,326.30 (Last Settlement Price)
Resistance Zones: $3,360-$3,365, $3,400 (Psychological Barrier) Support Zones: $3,265-$3,264, $3,223-$3,222 (Next Downside Target)
⏳ Key Timing for Institutional Moves
Asian Pre-Bell (Next 2-3 Hours): Expect high-frequency stop-hunts targeting retail traders entering positions too early.
London Session Open (Critical Pivot Point): This will be the moment institutions flush liquidity out before positioning for the true move.
NYSE Session (True Move Unfolds): Gold renounces sharply, sweeping bears before the next 3-drive pattern peak of wave D.
🚀 Institutional Execution Strategy
Synthetic liquidity mirage—volume spikes will appear, but they’re not real demand, just engineered liquidity traps. Dark pool positioning—institutions will offload positions in hidden exchanges, making the real move invisible until execution. Delayed execution trap—the true reversal won’t happen immediately, forcing traders to hold onto losing positions longer than they should.
Conclusion: The Illusion Will Break—But Only for Those Who See It
Markets are designed to deceive—price action isn’t just movement, it’s manipulation. Today’s liquidity engineering is a masterclass in institutional deception, and only traders who understand where the true execution layers lie will emerge unscathed.
Retail sentiment will chase breakouts, stop-hunts will lure in emotional entries, and miscalculations will force premature exits. But behind the illusion lies the real institutional mechanics—the precise sequence of moves that will dictate today’s liquidity flow.
Gold Mirage Trap: The Ultimate Liquidity Heist is unfolding. Let’s see who escapes the trap and who falls into it.
Disclaimer: This analysis is based on systematic liquidity mapping through X-Plus and does not constitute financial advice. Market conditions are subject to manipulation, engineered liquidity events, and institutional strategies beyond the scope of retail trading. Traders are responsible for their own risk management, execution, and decision-making. Past performance is not indicative of future results.

Bullish Breakout Defies Trade Uncertainty and Global TensionsOANDA:XAUUSD Gold remains firm near $3,333, holding a bullish structure after a breakout above multi-year resistance. While short-term pullbacks persist, geopolitical tensions and a Fed pause continue to support safe-haven demand. Trump's refusal to ease China tariffs dampens trade optimism, further boosting gold's appeal. Key support lies around $3,333 and $3.273.
Resistance : $3,414 , $3,474
Support : $3,333 , $ 3,273

Is the bull market over for gold?From a technical perspective, on the daily chart, the price of gold fell below the EMA20 moving average, the MACD bearish momentum expanded, and the downward trend was consolidated. On the 15-minute chart, the resistance level is in the range of $3280-3285. Two hours ago, the price of gold plummeted by more than $40 in 10 minutes. With the end of the tariff storm and the 10% base tariff imposed by both sides, the positive impact of the trade war on gold no longer exists, and the sharp drop in the price of gold is expected.

Pressure on inflation expectations risesThe gold market has fluctuated significantly recently. The closing price on Friday was fixed at 3326 points, and it opened lower at 3275 in the early trading on Monday, forming a clear gap. Subsequently, the gold price fluctuated and consolidated in the range of 3292 to 3260, and continued to fall in the early trading period. Although it rebounded at noon, the overall strength was weak. Before the European session, the gold price fell strongly from 3282 to 3216. Although it rebounded during the period, it failed to break through 3236. The current gold price is stuck near 3220, and the trend in the evening is particularly critical. The upper resistance is in the range of 3236-3240, and the lower support is in the 3206-3200 line. The overall trend is weak. If the 3200 mark is lost, it may further test 3180. In terms of operation, it is recommended to do more on the callback, and rebound high as a supplement.

GOLD - reached at final support? What's next??#GOLD.. well guys market perfectly moved as per our analysis and now market job at reached at his final supporting area that is 3350-51 around
Keep close it n only short below that.
Good luck
Trade wisely

Gold prices continue to fallGold, this round of price has fallen from the historical high of 3500 to 3202, and is currently in the second round of downward cycle after rebounding to 3438; affected by the progress of Sino-US trade negotiations, it opened low and went down on Monday. The article emphasizes that the initial target for the future market is to look back at 3260-3202; it actually fell to 3208 on Monday, and the daily chart recorded a large real negative, and the K-line combination was short. The short-term idea is maintained in the future market, and the target is adjusted to 3202-3168;


Gold update Chart Analysis
Trend: The market is currently in an uptrend with a pullback happening within a bullish flag or channel.
Current Price: Around 3,390.13
Support Zone: Near 3,322.725
Potential Entry: At or just below the current price level after a small dip (as shown by the blue arrow).
Bullish Bias: Based on the continuation pattern and price respecting the upward trendline.
📈 Trade Setup (Buy Position)
Entry: Around 3,390
Stop Loss (SL): Below the recent swing low or channel support → around 3,361
Take Profit (TP): Targeting the projected measured move → around 3,450 - 3,460
This setup gives a decent Risk:Reward ratio, approximately 1:2 or better, depending on the exact entry.
🔁 Summary
Entry: 3,390
SL: 3,361
TP: 3,450 to 3,460
Bias: Bullish continuation after a healthy pullback

XAUUSDThe Commitment of Traders (COT) data reveals a shift toward increased selling activity, indicating a bearish sentiment in the market. This suggests that traders are positioning themselves for potential declines, possibly anticipating a drop in asset prices. Such trends often signal caution, with market participants adjusting their strategies based on changing conditions.
