(XAU/USD) Bearish Trade Setup – Targeting $3,222 with 1:6 Risk/REntry Point: Around 3,409.33 - 3,408.41 USD.
Stop Loss: 3,437.87 USD.
Target (Take Profit): 3,222.53 USD.
Risk/Reward Ratio: Approximately 1:6, which is favorable.
📉 Price Action & Trend Analysis:
A rising wedge (or channel) appears to have formed and broken to the downside — a bearish signal.
The current price at 3,341.47 has broken below a minor support zone (highlighted in purple), indicating bearish momentum.
Price is now approaching the 200 EMA, which is acting as potential dynamic support.
📌 Key Levels Highlighted:
Support Zones: Near 3,347.47 (previous minor support) and 3,222.53 (main target zone).
Resistance Zones: At the entry level and above, near 3,437.87 (Stop Loss zone).
🔄 Indicators:
Moving Averages (Red and Blue Lines): Shorter-term moving average (red) is below the longer-term (blue), indicating downward pressure.
Momentum Shift: The sharp drop suggests a likely continuation of the bearish trend.
XAUUSD trade ideas

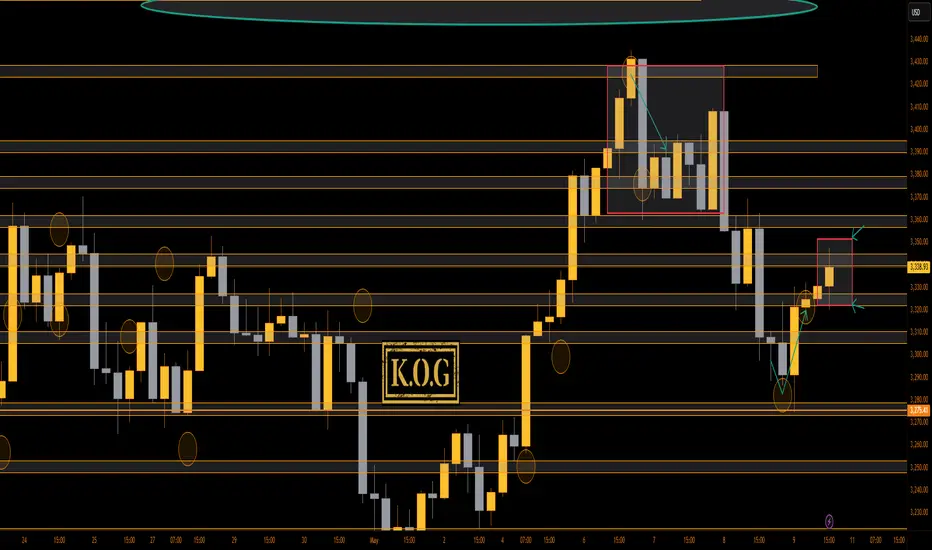
THE KOG REPORTTHE KOG REPORT:
Last week’s KOG Report didn’t really go the way we wanted! We got the move we wanted initially into the low, then the long upside, but the levels we wanted to short from again were smashed through. We managed to navigate and adapt to the move and after changing the plan on the FOMC KOG Report we ended again with an extremely decent week on Gold.
As we’ve always said, when markets don’t go our way, don’t hold on to hope. If you're in the wrong way, accept your wrong and change your bias, this will not only save your account but together with the right risk management, you’ll be able to come out of the market in positive for the week.
So, what can we expect from the week ahead?
We have some news over the weekend that can open us up with gaps, otherwise Monday should be a ranging day and we’ll see some action Tuesday onwards. For this week we’ve added the red boxes for everyone, the indicator is working like a dream and allowing our traders to scalp, swing trade and day trade across the 15min/1h/4h timeframes. So please take note of them!
The problem we have this week is the structure entails two possible moves by the way they’ve set this up. For that reason, we’ll look at the key levels on the red boxes for the break and close together with KOG’s red box targets and bias of the week, before we commit to the market other than scalping.
We have the key level below 3306-10 support which if held again can push upside this time in attempt to break through the 3330 level and target the 3350-55 and above that 3365 region before a RIP. 3360 is the level to watch, if broken above and supported, we can start again with longs into that 3400+ region, but only on confirmation.
The ideal scenario here for us is a break of this symmetrical pattern in one direction, then applying our trading strategy to it which will confirm the move, we can only do this once it’s broken and then update you with the plan.
For now, we’ll play the red boxes and of course wait for our trusted algo Excalibur to guide us. As always, we will update the wider community as we go through the week.
KOG’s bias of the week:
Bullish above 3310 with targets above 3335, 3345, 3350, 3350, 3362 and 3370
Bearish below 3310 with targets below 3306, 3301, 3297, 3285 and 3274
RED BOXES (TAKE NOTE)
Break above 3335 for 3342, 3350, 3354, 3365, 3370. 3373 and 3385 in extension of the move
Break below 3320 for 3310, 3306, 3298, 3293, 3285 and 3279 in extension of the move
Please do support us by hitting the like button, leaving a comment, and giving us a follow. We’ve been doing this for a long time now providing traders with in-depth free analysis on Gold, so your likes and comments are very much appreciated.
As always, trade safe.
KOG

GOLD 4H CHART ROUTE MAP UPDATE & TRADING PLAN FOR THE WEEKHey Everyone,
Please see our updated 4h chart levels and targets for the coming week.
We are seeing price play between two weighted levels with a gap above at 3344 and a gap below at 3297. We will need to see ema5 cross and lock on either weighted level to determine the next range. We have a bigger range in play then usual.
We will see levels tested side by side until one of the weighted levels break and lock to confirm direction for the next range.
We will keep the above in mind when taking buys from dips. Our updated levels and weighted levels will allow us to track the movement down and then catch bounces up.
We will continue to buy dips using our support levels taking 20 to 40 pips. As stated before each of our level structures give 20 to 40 pip bounces, which is enough for a nice entry and exit. If you back test the levels we shared every week for the past 24 months, you can see how effectively they were used to trade with or against short/mid term swings and trends.
The swing range give bigger bounces then our weighted levels that's the difference between weighted levels and swing ranges.
BULLISH TARGET
3344
EMA5 CROSS AND LOCK ABOVE 3344 WILL OPEN THE FOLLOWING BULLISH TARGET
3394
EMA5 CROSS AND LOCK ABOVE 3394 WILL OPEN THE FOLLOWING BULLISH TARGET
3438
EMA5 CROSS AND LOCK ABOVE 3438 WILL OPEN THE FOLLOWING BULLISH TARGET
3486
BEARISH TARGETS
3297
EMA5 CROSS AND LOCK BELOW 3297 WILL OPEN THE SWING RANGE
SWING RANGE
3236 - 3176
EMA5 CROSS AND LOCK BELOW 3176 WILL OPEN THE SECONDARY SWING RANGE
SWING RANGE
3088 - 3046
EMA5 CROSS AND LOCK BELOW 3046 WILL OPEN THE SECONDARY SWING RANGE
SECONDARY SWING RANGE
3130 - 3078
As always, we will keep you all updated with regular updates throughout the week and how we manage the active ideas and setups. Thank you all for your likes, comments and follows, we really appreciate it!
Mr Gold
GoldViewFX

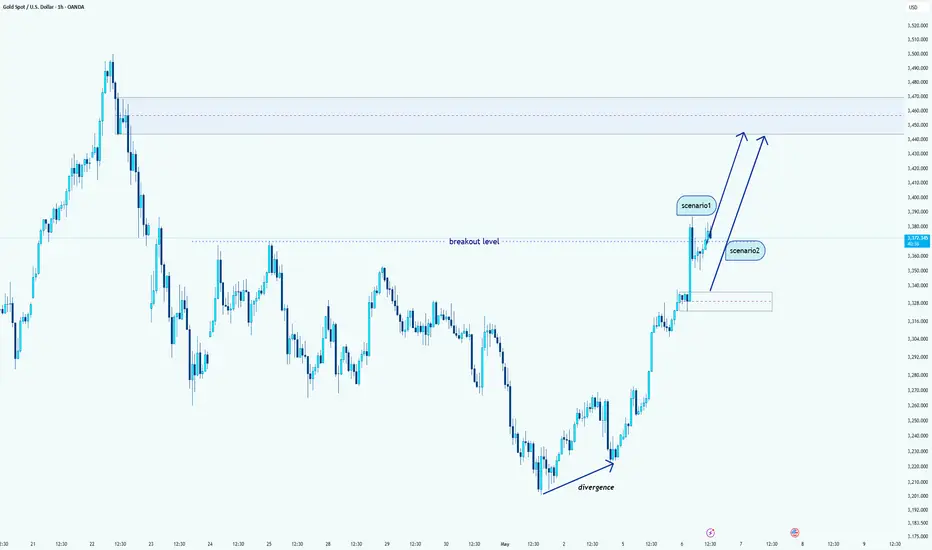
Gold (XAU/USD) Breakout Confirmed – Bulls Eye Higher TargetHello guys!
Gold has successfully broken above the key resistance level marked as the breakout level, confirming bullish momentum. This breakout follows a clear bullish divergence, indicating a reversal from the recent downtrend. The strong upward movement suggests increased buyer interest and continuation potential.
Two bullish scenarios are in play:
Scenario 1: Price continues upward from the current breakout zone without a retest, targeting the next resistance area around $3,440–$3,470.
Scenario 2: A pullback to the breakout level or the demand zone near $3,325–$3,340, followed by a bullish continuation.
What I see:
✅ Bullish divergence identified at the recent low
✅ Breakout from a significant resistance level
📈 Momentum favors continued upside
GOLD WEEKLY CHART MID/LONG TERM ROUTE MAPHey Everyone,
Here’s the latest update on our weekly chart setup, which has continued to play out in line with our previous projections.
Recently, price broke above the upper boundary of our Goldturn Ascending Channel a proprietary channelling method designed for greater precision and reduced noise. However, the EMA5 remains within the channel, suggesting the breakout lacks confirmation. For a true continuation to the upside, we’ll need to see the EMA5 close and hold above the channel boundary, which would validate a structural shift in trend strength.
At the moment, price is hovering above the channel, showing signs of support and minor bullish bounces. However, until the EMA5 exits and stabilizes outside the channel, we treat this move with caution.
Price is currently testing the upper channel resistance, a critical decision point on the weekly timeframe. The 3482 level remains key resistance, having previously been rejected via upper wick with no candle body close above. On the downside, 3281 and 3189 are the primary support levels to monitor, both of which align with the channel's midline, a potential zone for consolidation or swing support if price moves sideways and gradually ascends.
In summary, while early bullish momentum is visible, full confirmation of trend continuation requires alignment between price action and the EMA5 behaviour relative to the channel structure.
This is the beauty of our Goldturn channels, drawn using weighted averages instead of pure price action. This unique approach helps us clearly identify fake-outs and real breakouts, cutting out much of the noise that usually confuses traders.
Moving forward, we’ll focus on smaller timeframes (1H and 4H) to buy dips off the weighted Goldturns, aiming for clean 30–40 pip moves. Ranging markets are perfect for this style, allowing us to capitalize on quick moves without getting caught in the chop of larger swings.
Thanks again for all your likes, comments, and follows, we really appreciate the support!
Mr Gold
GoldViewFX

GOLD ROUTE MAP UPDATEHey Everyone,
Strong start to the week for our chart setup. Despite initial bearish momentum, price action aligned well with our dip buying strategy.
The session began with the bearish target at 3307 being achieved, triggering a key price reaction. This was followed by a ema5 cross and lock, confirming the activation of the retracement zone, which was also tested and respected with precision. We have now observed a confirmed breakout from the retracement range, opening the swing range. This move delivered our textbook swing bounce, again supporting our dip buying strategy.
The full extent of the swing range remains active, indicating continued opportunity for strategic dip entries while the range structure holds.
We will keep the above in mind when taking buys from dips. Our updated levels and weighted levels will allow us to track the movement down and then catch bounces up.
We will continue to buy dips using our support levels taking 30 to 40 pips. As stated before each of our level structures give 20 to 40 pip bounces, which is enough for a nice entry and exit. If you back test the levels we shared every week for the past 24 months, you can see how effectively they were used to trade with or against short/mid term swings and trends.
The swing range give bigger bounces then our weighted levels that's the difference between weighted levels and swing ranges.
BULLISH TARGET
3341
EMA5 CROSS AND LOCK ABOVE 3341 WILL OPEN THE FOLLOWING BULLISH TARGETS
3372
EMA5 CROSS AND LOCK ABOVE 3372 WILL OPEN THE FOLLOWING BULLISH TARGET
3414
EMA5 CROSS AND LOCK ABOVE 3414 WILL OPEN THE FOLLOWING BULLISH TARGET
3447
EMA5 CROSS AND LOCK ABOVE 3447 WILL OPEN THE FOLLOWING BULLISH TARGETS
3478
EMA5 CROSS AND LOCK ABOVE 3478 WILL OPEN THE FOLLOWING BULLISH TARGETS
3502
POTENTIALLY 3525
BEARISH TARGETS
3307 - DONE
EMA5 CROSS AND LOCK BELOW 3307 WILL OPEN THE RETRACEMENT RANGE
3281 - DONE
3254 - DONE
EMA5 CROSS AND LOCK BELOW 3254 WILL OPEN THE SWING RNGE
3233 - DONE
3201
As always, we will keep you all updated with regular updates throughout the week and how we manage the active ideas and setups. Thank you all for your likes, comments and follows, we really appreciate it!
Mr Gold
GoldViewFX

Gold Surges Further After Israel Strikes YemenGold Surges Further After Israel Strikes Yemen
In the video analysis I shared yesterday, Gold made an unusual move from 3272 to 3330.
It appears that the market reacted ahead of time, as it often does—suggesting that certain players might have had prior knowledge of the news before it was widely released.
This kind of market movement is commonly referred to as manipulation, likely driven by those who were aware of Israel’s planned strike on Yemen before it happened.
You may find more details in the chart!
Thank you and Good Luck!
❤️PS: Please support with a like or comment if you find this analysis useful for your trading day❤️

Gold - This week drop to 3167! (best level to buy)Gold recently dropped from 3500 to 3201, which is a pretty significant correction, but I think we are going to go lower. There is a lot of liquidity below the previous triangle and untested major swing high from 2nd April. In general, triangles act like a magnet for whales. When you see a triangle on the chart, you can be almost sure that the price will go back and take liquidity below it. Or at least retest the POC level of a triangle if the trend is very strong.
The 0.618 FIB is the strongest FIB. Then we have the 0.382 and 0.5. If the price is near the 0.618 FIB, there is a very high chance that we are going to hit this level sooner or later. Gold is near this strong fib level + we have to retest the previous swing high.
Right now I am pretty bearish on gold, and I think this week we are going to lower and test 3167. But I am very curious - what do you think about gold, and what is your ultimate bottom to buy it? Tell me in the comment section. Trading is not hard if you have a good coach! It is not a trade setup, as there is no stop-loss or profit target. I share my trades privately. Thank you, and I wish you successful trades!

GOLD DAILY CHART ROUTE MAP UPDATEHey Everyone,
After completing our previous daily chart idea, we’ve now updated and identified a new Goldturn ascending channel on this updated chart.
Price had temporarily broken above the upper boundary of the channel; however, the EMA5 remains within the channel, indicating that this may be a false breakout rather than a confirmed move higher.
The 3433 resistance level was tested, aligning with our prior axis target. While price did reach this level, it failed to close above it, resulting in only a wick rejection. For a confirmed bullish continuation, we need to see a clear candle close above 3433, accompanied by the EMA5 crossing and holding above the channel boundary.
Further confirmation would come from a successful retest and hold above the channel, establishing new support at higher levels.
At present, 3433 remains key resistance, while 3272 acts as support. In the short term, we may observe sideways consolidation, with price potentially gravitating toward the midline of the ascending channel half line, which could act as dynamic swing support.
This is the beauty of our Goldturn channels, drawn using weighted averages instead of pure price action. This unique approach helps us clearly identify fake-outs and real breakouts, cutting out much of the noise that usually confuses traders.
Moving forward, we’ll focus on smaller timeframes (1H and 4H) to buy dips off the weighted Goldturns, aiming for clean 30–40 pip moves. Ranging markets are perfect for this style, allowing us to capitalize on quick moves without getting caught in the chop of larger swings.
Thank you all again for your continued likes, comments, and follows, we truly appreciate your support!
Mr Gold
GoldViewFX

GOLD → Gold not ready to fall? What's going on?FX:XAUUSD is forming a local bottom and is not ready to continue falling. The price is breaking through the downward resistance amid a weakening dollar and a complicated fundamental backdrop.
At the beginning of the week, the price of gold stabilized above $3,250 as investors returned to defensive assets due to ongoing uncertainty surrounding US trade agreements with China and Japan, as well as growing geopolitical tensions in the Middle East and Ukraine.
The weakness of the dollar ahead of the Fed meeting and declining expectations of a rate cut are also supporting demand for gold. The focus remains on US trade news and the possible hawkish tone of the Fed this week.
Technically, the price is testing the bottom of the range as resistance. If there is no reaction to the false breakout and the price continues to storm 3268, then a breakout and consolidation above the level will allow it to strengthen to 3292-3314.
Resistance levels: 3269, 3294, 3314
Support levels: 3243, 3222, 3204
The price is forming a second retest of 3269 since the session opened. Buyers are testing resistance for a breakout. If the bulls break 3269 and consolidate above 3270, the chances for growth will be good. I do not rule out the possibility of a retest of the liquidity zone at 3243 before growth.
Best regards, R. Linda!

#XAUUSD: Gold to continue rising,$4000 by end of the year targetGold has unexpectedly declined to 3335 in response to the anticipated price increase following the unfolding conflict in Asia. Currently, two regions exhibit price reversals.
The XAUUSD price is progressing in accordance with our previous analysis. Both analyses have successfully reached the take-profit target, and we anticipate further bullish momentum in the near future. However, price movement is subject to potential reversals in two areas. Both targets are long-term oriented, indicating potential swing moves that may take time to complete. Stop-loss, intraday target, and position decisions should be based on individual analysis and overall market assessment. Strong fundamentals are essential for price to reach the designated target area.
We acknowledge our bias in this analysis, but it does not guarantee the realisation of the described outcome.
Upon trade activation, you can establish two targets. You have the flexibility to select your own take-profit based on your analysis and trade management strategies.
We appreciate your unwavering support.
For those who wish to contribute, we offer several avenues for assistance:
- Liking our ideas
- Commenting on our ideas
- Sharing our ideas
Thank you for your continued support.
If you feel inclined, we would be grateful for your generosity.
Best regards,
Team Setupsfx_❤️🚀

Lingrid | GOLD Accelerating BEARISH Momentum in the MARKETOANDA:XAUUSD recently faced rejection at a lower high within the resistance zone and is now trading beneath a firm downward trendline. After a failed attempt to hold above $3,264, price has dropped sharply, signaling continuation of the bearish momentum that began after the breakout failed to sustain. The downtrend remains intact with sellers eyeing deeper support unless bulls reclaim $3,264 with momentum.
📌 Key Levels
Support zone: $3,150
Breakout target: $3,150
Invalidation level: $3,264 (local resistance / trendline retest)
⚠️ Risks
Short-term rebounds may test the trendline before continuation
False breakdown risk exists near $3,150 without volume support
Unexpected bullish reversal above $3,264 would invalidate bearish bias
Traders, if you liked this idea or if you have your own opinion about it, write in the comments. I will be glad 👩💻

THE KOG REPORT - FOMCTHE KOG REPORT – FOMC
This is our view for FOMC, please do your own research and analysis to make an informed decision on the markets. It is not recommended you try to trade the event if you have less than 6 months trading experience and have a trusted risk strategy in place. The markets are extremely volatile, and these events can cause aggressive swings in price.
Our NFP KOG Report worked pretty well apart from it being a Friday and us closing out positions for the weekend only for the move to complete on Monday. For this FOMC we’ll share the levels and potential reaction points on the red boxes as well as the red box target levels. Due to the range, it’s best to wait for the break and also for them to move the price to where they want, then hunt the trade once price has settled.
We have the immediate support level below 3360-55 which if held can push this upside to break the recent high and that 3480-90 level again. Break of that level we have red box region 3330-20 which is where we could get a RIP but that will give us the flip with potential for the order region 3350-55 to turn into resistance unless broken. For that reason, a down move for now could only give scalps for decent captures on tap and bounces.
3320 is the line in the sand, if broken below we’ll get the long from the 3290-95 region which will come next week.
Note, these days it’s only Trump that manages to move the markets aggressively, so this FOMC is most likely already priced in. Not worth attempting the immediate levels so we’ll rather wait for the extreme levels.
RED BOXES INDI LEVELS:
Break above 3395 for 3406, 3410, 3420, 3430 and 3435 in extension of the move
Break below 3375 for 3370, 3366, 3356, 3351 and 3345 in extension of the move
Please do support us by hitting the like button, leaving a comment, and giving us a follow. We’ve been doing this for a long time now providing traders with in-depth free analysis on Gold, so your likes and comments are very much appreciated.
As always, trade safe.
KOG

THE KOG REPORT - UpdateEnd of day update from us here at KOG:
Although our plan to short from the initial level didn't work as the level was broken through, the 2nd level gave us a scalp for a decent capture. Today we shared the long trade with the wider community, again giving a nice return, and that was enough on gold for the day.
We're a little stretched now and going long can be a bit risky with this 3390-95 region accumulating and starting to draw the mean upside. For that reason we've highlighted the potential range with support below at the 3360-5 level and resistance 3420 and above that 3431. These higher levels if attacked before a retracement we feel may give the opportunity to take the short, otherwise, support below holds, we're active above.
A break below 3385 is needed to go lower!
Red boxes:
Break above 3235 for 3243✅, 3245✅, 3247✅, 3252✅ and 3270✅ in extension of the move
Break below 3220 for 3210, 3206, 3196, 3188 and 3179 in extension of the move
As always, trade safe.
KOG

GOLD ROUTE MAP UPDATEHey Everyone,
Great finish to the week with our chart idea playing out, as analysed.
After completing our Bullish targets 3282, 3343 and 3404 yesterday; we stated that no further cross and lock above 3404 confirmed the rejection and that price will find support at lower Goldturns for the bounces.
- This played out perfectly inline with our plans to buy dips. Price found support at 3282 Goldturn and gave the weighted bounce just like we analysed.
BULLISH TARGET
3282 - DONE
EMA5 CROSS AND LOCK ABOVE 3282 WILL OPEN THE FOLLOWING BULLISH TARGET
3343 - DONE
EMA5 CROSS AND LOCK ABOVE 3343 WILL OPEN THE FOLLOWING BULLISH TARGET
3404 - DONE
We will now come back Sunday with our updated Multi time-frame analysis, Gold route map and trading plans for the week ahead.
Have a smashing weekend!! And once again, thank you all for your likes, comments and follows, we really appreciate it!
Mr Gold
GoldViewFX

GOLD H8 Update: Bulls will target 3600 USD🏆 Gold Market Mid-Term Update
📊 Technical Outlook Update
🏆 Bull Market Overview
▪️pullback looks complete now
▪️3000/3200/3400/3600 USD key S/R
▪️Reversal at 3200 USD
▪️Resistance near 3400 USD
▪️Bulls maintain strategic advantage
▪️Target for BULLS 3600 USD
▪️short-term dips are possible
▪️focus on buying dips
⭐️Recommended strategy
▪️BUY/HOLD accumulate dips
▪️TP BULLS 3600 USD
🏦Fed Outlook: Mixed data fuels speculation on policy shift. Analysts see gold’s pullback as a new buying opportunity.
🌏Asian Demand: China and India remain key forces in price direction, alternating as major buyers.
📦Tariff Watch: Ongoing U.S.-China trade tension continues to weigh on risk sentiment, keeping gold in play.
🛑Geopolitics: No major updates on Iran-U.S. talks, India-Pakistan, or Russia-Ukraine ceasefire yet. These remain key risk triggers.

Gold Rally Running Out of Steam? PRZ May Trigger Drop!Gold ( OANDA:XAUUSD ) has hit the targets as I shared with you in yesterday's idae . Will this uptrend of the past 5-6 days continue?
Gold seems to have broken through the Resistance zone($3,387-$3,357) and has been moving in an Ascending Channel for the past 5 days .
In terms of Elliott Wave theory , Gold appears to be completing microwave 5 of the main wave 3 . The end of the main wave 3 can be at the Potential Reversal Zone(PRZ) .
Also, expect to see a clear Regular Divergence(RD-) between Consecutive Peaks at the Resistance zone($3,434-$3,406) .
I expect Gold to start declining from the Potential Reversal Zone(PRZ) and at least to the lower line of the ascending channel . This analysis is against the main trend, so pay more attention to money management .
Note: If Gold touches $3,448(Stop Loss(SL)), we can expect more pumps.
Note: If Gold falls below $3,342, we can expect a deeper decline than expected.
Gold Analyze ( XAUUSD ), 1-hour time frame.
Be sure to follow the updated ideas.
Do not forget to put a Stop loss for your positions (For every position you want to open).
Please follow your strategy; this is just my idea, and I will gladly see your ideas in this post.
Please do not forget the ✅' like '✅ button 🙏😊 & Share it with your friends; thanks, and Trade safe.

THE KOG REPORT - Update End of day update from us here at KOG:
We can honestly say, even though the KOG Report plan didn't work out as we intended this week, it's been a phenomenal week on gold in Camelot. We've managed to capture the top (AGAIN), then bounced the low, then produced the FOMC KOG Report which gave us another level to level short with a pip perfect bounce for the long.
Early we published the play stating 3370 needs to break to go higher which it didn't giving the move downside that we're seeing now. Support here is below on this move if they manage to break through the 3300 level. No point attempting a long or short here as it's late session so the levels to watch are:
Support 3301 / 3296 and below that 3276
Resistance 3310 and above that 3320 which will need to break
As always, trade safe.
KOG

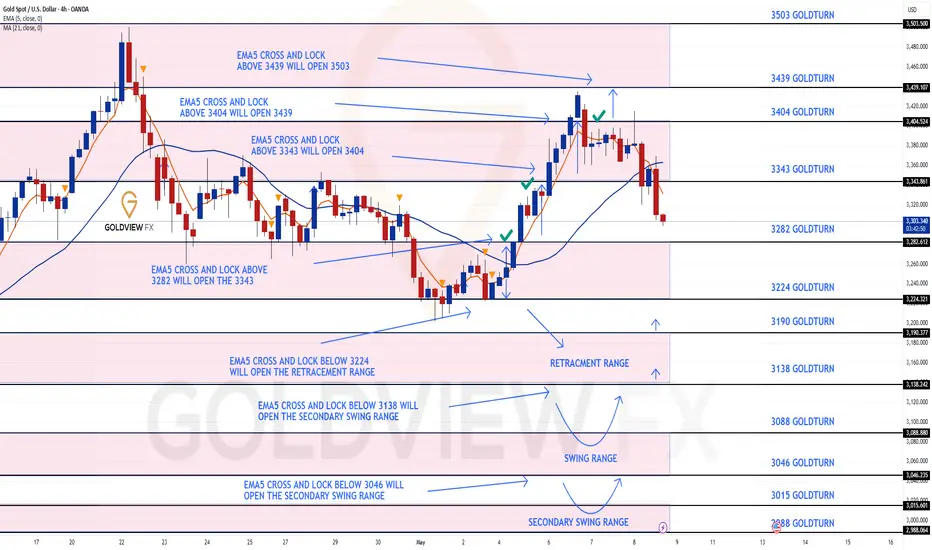
GOLD 4H CHART ROUTE MAP UPDATEHey Everyone,
Once again another smashing day on the charts today. After sharing updates and completing targets on our 1h chart idea; please now see update on our 4H chart idea, which is also playing out as analysed.
We started with our Bullish target hit at 3282, followed with ema5 cross and lock opening 3343, which was hit perfectly. We then got ema5 cross and lock above 3342 opening 3404, also got completed. The cross and lock confirmation gave plenty of time to get in for the action.
No further cross and lock with ema5 above 3404 confirmed the perfect rejection, which we are seeing now, with price testing the lower Goldturns for support.
We will continue to buy dips using our support levels taking 30 to 40 pips. As stated before each of our level structures give 20 to 40 pip bounces, which is enough for a nice entry and exit. If you back test the levels we shared every week for the past 24 months, you can see how effectively they were used to trade with or against short/mid term swings and trends.
The swing range give bigger bounces then our weighted levels that's the difference between weighted levels and swing ranges.
BULLISH TARGET
3282 - DONE
EMA5 CROSS AND LOCK ABOVE 3282 WILL OPEN THE FOLLOWING BULLISH TARGET
3343 - DONE
EMA5 CROSS AND LOCK ABOVE 3343 WILL OPEN THE FOLLOWING BULLISH TARGET
3404 - DONE
EMA5 CROSS AND LOCK ABOVE 3404 WILL OPEN THE FOLLOWING BULLISH TARGET
3439
EMA5 CROSS AND LOCK ABOVE 3439 WILL OPEN THE FOLLOWING BULLISH TARGET
3503
BEARISH TARGETS
3224
EMA5 CROSS AND LOCK BELOW 3224 WILL OPEN THE FOLLOWING RETRACEMENT RANGE
3190
3138
EMA5 CROSS AND LOCK BELOW 3138 WILL OPEN THE SWING RANGE
SWING RANGE
3088 - 3046
EMA5 CROSS AND LOCK BELOW 3046 WILL OPEN THE SECONDARY SWING RANGE
SECONDARY SWING RANGE
3015 - 2988
As always, we will keep you all updated with regular updates throughout the week and how we manage the active ideas and setups. Thank you all for your likes, comments and follows, we really appreciate it!
Mr Gold
GoldViewFX
XAUUSD: 15 Time Frame Correction? After looking at a smaller timeframe we think price can reverse for a correction, around 3350 area can be a good area to take out profit.
Good luck trading
Team Setupsfx

(XAU/USD) Bullish Trade Setup – Targeting $3,506.52 with Entry aEntry Point: $3,221.19
Stop Loss: $3,169.80
Resistance Zone: Around $3,277.98 to $3,280.64
Target (TP) Point: $3,506.52 (Approx. 9.05% upside)
📊 Technical Indicators and Markings:
Moving Averages:
Likely a 50-period (blue) and 200-period (red) moving average.
Price is currently below both MAs, signaling a short-term downtrend.
Support & Resistance Zones:
Strong support around $3,207.67–$3,221.19 (entry area).
Resistance at $3,244.25–$3,280.64.
Stop-loss is strategically placed below support to limit downside risk.
Target Area:
Projected upside target is $3,506.52, with a potential 9.05% gain from the entry.
This is marked as the EA (Expert Advisor) Target Point, possibly suggesting this is a strategy from an automated trading system.
Orange Circles:
Likely indicate swing highs and lows, used to identify trend patterns and potential reversal points.
📈 Trading Idea Summary:
Bullish Setup: Buying at support, aiming for breakout above resistance to reach target.
Risk-Reward Ratio: Favorable, assuming price holds above $3,207.
Watch for Confirmation: Price needs to break above resistance around $3,280 for momentum continuation.

THE KOG REPORT - Update End of day update from us here at KOG:
Nice move early session giving us the low we wanted for an entry long into the target region. We activated higher on Excalibur which also completed and the red box indicator gave us a wonderful performance across all the pairs we took profit on today.
Now we have support at the 3320 region with resistance sitting up at 3350 which will need to break to go higher. We've giving the potential range unless the levels are broken and there is a late session move. Either way, it's been another good week on the markets in Camelot and we'll see you on Sunday for the KOG Report and our view for the week ahead.
Wishing you all a great weekend, please don't forget to hit the boost button for us!
As always, trade safe.
KOG
GOLD - Price can make correction movement to support levelHi guys, this is my overview for XAUUSD, feel free to check it and write your feedback in comments👊
A few moments ago, the price traded inside a little flat, where it declined to the bottom part and then started to grow.
In a short time, it reached the $2955 level, broke it and started to trades inside a big flat, exiting from a small range.
After this movement, the price reached the top part of the flat and then corrected, after which it entered to pennant.
In the pennant pattern, Gold exited from a flat and rose to the resistance line from the support line, breaking the $3205 level.
Also recently, price made a correction, but then it turned around and bounced up, thereby exiting from pennant.
Now, I think that Gold can rise a little and then start to decline to $3205 support level.
If this post is useful to you, you can support me with like/boost and advice in comments❤️
