Average price of gold long and short: 3330Average price of gold long and short: 3330
The United States and the United Kingdom reached a new trade agreement, partially eliminating tariffs in specific areas.
Trump publicly stated that if the trade agreement and tax cuts can be achieved, "you'd better buy stocks now."
Since the opening of the market in April, regardless of whether the price of gold rises or falls, market fluctuations of more than $100 per day have become the norm!
There are countless people who have blown up their positions, so risk control is always the most important means of self-protection.
In other words:
Maybe your trading skills are not up to standard (because it takes a lot of time to practice and learn)
But your risk control habits and level must be A+ (this is a standard answer)
So your average score may only reach B
Currently, spot gold has broken through the 3300 mark and is expected to test the 3200 mark next.
This is the key position of medium-term long and short positions;
Short-term focus on pressure level: 3265-3240
Mid-term: 3330 becomes the intraday long and short watershed
Short-term focus on support level: 3300-3290
Gold operation strategy reference for next Monday:
Short order strategy:
Strategy 1: Short gold rebounds near 3365-3370 in batches, stop loss 10 points, target near 3340-3330, break through to 3320 line;
Long order strategy:
Strategy 2: Long gold pullback near 3318-3320 in batches, stop loss 10 points, target near 3340-3360, break through to 3370 line;
XAUUSD trade ideas

Gold Surf Update 1 Hour FrameWith this idea, we have a pretty high stop loss of 200 pips. So allocate the volume to suit the account. About 1% capital loss, when reaching profit, it will increase by 4%. Good lucky

XAUUSD H4 CHART PATTERNResistance Level: $3,500
Target Point: $3,203
Support Level: $2,977
Technical Analysis:
The recent price action suggests that gold has formed a bearish pattern, indicating potential downward movement. The resistance at $3,500 serves as a significant barrier, and failure to break above this level could reinforce bearish sentiment. The support at $2,977 is a critical level to watch; a break below this could confirm the bearish trend and lead to further declines toward the target point at $3,203.
Market Indicators:
Moving Averages: The price is currently trading below key moving averages, indicating a bearish trend.

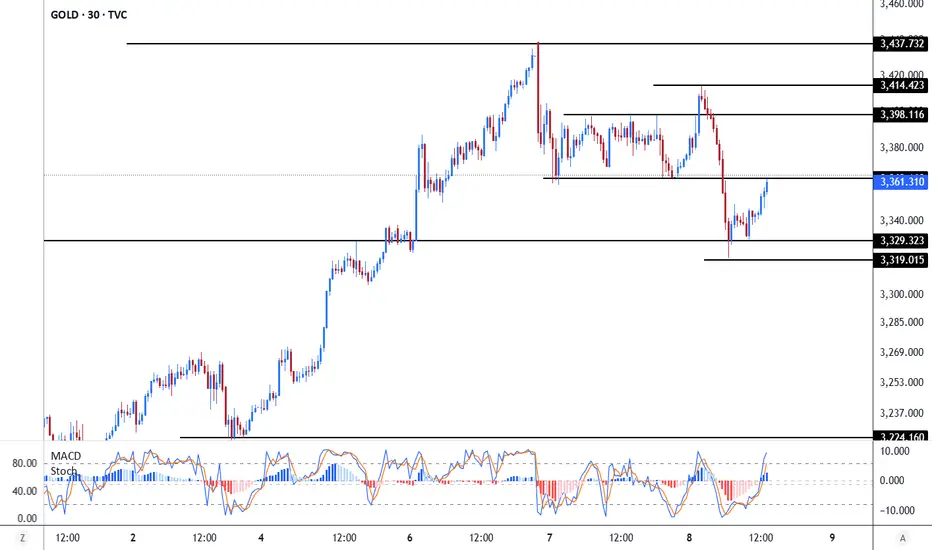
Gold Short-Term Outlook: Potential Rebound Toward Resistance Be The price is currently trading around the 3353 level, after bouncing from a key support zone at 3329 dollars.
In the first scenario, if the price continues to rise, it’s expected to reach the 3398 level — a very strong resistance area, as it aligns with a descending trendline and multiple previous highs. This zone could trigger a strong pullback, and we expect a new decline back toward the 3329 and 3319 levels respectively.
The MACD is giving a bullish signal, and the Stochastic is also moving up from the oversold area, which suggests the possibility of a temporary upward move.
XAUUSD BULLISH IDEA TAKE ENTRY WITH CONFIRMATION FROM THIS LEVELI'm looking buy from 30mint order block price zone 3326-25 with 100 pip sl and target All time high with proper risk management

XAUUSD NEXT MOVE FOR FOMC NEWS TRADE Instrument: Gold CFDs (XAU/USD)
• Timeframe: 4H
• Current Price: ~$3,385.83
• Key Annotations:
• Support Zone: Around 3,280–3,360
• Breakout Point: Just above current price (~3,390)
• Resistance Level: Near 3,500
• FOMC Note: “FOMC TRADE DON’T MISS

Gold 100% Profit SignalTechnical analysis of gold: Gold has fallen after rising, and there is a large room for gold to fall, from 3438 to 3360 now, with a fluctuation of nearly 78 US dollars. Under this change, we should pay attention to whether the long and short changes of gold will continue. From the perspective of cyclical performance, there is a high possibility of a wave of adjustment space after three consecutive positive lines on the daily line, and the intensity of this adjustment will not be small. It is possible that the big negative line swallows the positive line and directly falls below 3300. If it comes out like this, then it can be said that it is difficult for gold to rise this week. On Thursday and Friday, it may fluctuate and fall or fluctuate at a high level.
From the perspective of the 4-hour cycle, a big negative line closed, covering the previous positive lines, and breaking the support of the 5- and 10-day moving averages. This wave may continue to fall to the Bollinger middle rail near 3300, but if it is a high-level shock and the Bollinger middle rail is not broken, it may rise again to the high point of 3430. Therefore, gold has experienced large ups and downs in this cycle, and now it is possible to rise or fall. In the short-term cycle, we will first focus on the support effect of 3360-3350 under the weakness of the early trading. If it is not broken, we can continue to be bullish. The upper target is 3400, and if the strength is strong, we will look at 3430. On the whole, the short-term operation strategy for gold today is to mainly short on rebounds and to do more on pullbacks. The short-term focus on the upper side is the 3400-3405 line of resistance, and the short-term focus on the lower side is the 3350-3300 line of support.
Short order strategy:
Strategy 1: When gold rebounds to around 3397-3400, short sell (buy short) in batches, 20% of the position, stop loss 6 points, target around 3360-3330, break the position and look at the 3300 line
Long order strategy:
Strategy 2: When gold falls back to around 3300-3305, buy long positions in batches (buy up) with 20% of the position, stop loss 6 points, target around 3330-3350, break the position and look at 3370

Gold Price Analysis: Bullish Breakout Above Symmetrical Trianglea bullish breakout above a symmetrical triangle pattern. The price surged past the resistance, moving within an upward channel. Key resistance levels are noted at 3,430 and 3,470, indicating potential bullish targets. The current price is 3,392.10, reflecting a -1.15% decline. Traders should watch for consolidation before the next upward move.
The chart shows that gold prices recently broke out of a triangle pattern, moving upwards in a channel. The price is currently around 3,392, with possible targets at 3,430 and 3,470. This breakout suggests that gold may continue to rise after some consolidation.

Going Long On GoldGold (XAUUSD) Elliott Wave Analysis – Wave 5 Targeting New Highs
Gold has been exhibiting strong bullish momentum since yesterday, and based on the 4-hour Elliott Wave structure, we are currently in Wave 5 of a classic 5-wave bullish impulse. This final wave often aims to surpass previous highs, and with gold recently reaching an all-time high of $3,500.33, the current price action suggests a potential move to establish new record levels.
Key Levels to Monitor:
Resistance: Previous all-time high at $3,500.33
Support: Prior Wave 4 low, serving as dynamic trailing support
Traders should watch for a decisive break above the $3,500.33 level, which could confirm the continuation of Wave 5 and signal further upside potential. Conversely, failure to breach this resistance may indicate the onset of a corrective phase.

GOLD - WAVE 4 CORRECTION TO $2,800 (UPDATE)Gold has climbed higher into our 0.365% zone, which I highlighted on yesterday's analysis. We will keep a close eye out to see if price action offers any rejection around this zone, for sellers to kick in. However, the closer it gets to the ATH, the higher chance of it creating a new ATH.

Gold has drifted sideways...Gold has drifted sideways since I did my "I know, gold bulls don't want to read this" post.
There was some peak euphoria back mid-April which led me to write that.
Now, until this congestion resolves, there are no low risk entries.

Shorts were active at the beginning of this week, and prices fel
📌 Gold driving factors
The joint statement of the Sino-US Geneva economic and trade talks has just been released. This development has hit the safe-haven demand for gold and has become the fuse for a new round of gold selling.
Coupled with the hawkish "holding back" of the Federal Reserve, the dollar has remained stable near its multi-week high and put pressure on gold. The trend of gold prices seems quite fragile.
📊Commentary analysis
The next resistance for gold prices is the static barrier of $3360-3365/ounce. If it can be decisively overcome, it will eliminate the recent bearish tendency and lay the foundation for gold prices to regain the $3400/ounce mark.
💰Strategy Package
⭐️Set Gold Price:
🔥Sell Gold Zone: 3315-3317 SL 3322
TP1: $3300
TP2: $3290
TP3: $3280
🔥Buy Gold Zone: $3223 - $3225 SL $3218
TP1: $3238
TP2: $3245
TP3: $3260
⭐️ Note: Labaron hopes that traders can properly manage their funds
- Choose the number of lots that matches your funds
- Profit is 4-7% of the fund account
- Stop loss is 1-3% of the fund account

GOLD Swing Long!
HI,Traders !
GOLD has made a retest
Of the horizontal support
Of 3205.77 and we are already
Seeing a bullish rebound
From where we will be
Expecting further move up !
Comment and subscribe to help us grow !

GOLD My Opinion! BUY!
My dear friends,
GOLD looks like it will make a good move, and here are the details:
The market is trading on 3211.4 pivot level.
Bias - Bullish
Technical Indicators: Supper Trend generates a clear long signal while Pivot Point HL is currently determining the overall Bullish trend of the market.
Goal - 3239.5
Recommended Stop Loss -3197.1
About Used Indicators:
Pivot points are a great way to identify areas of support and resistance, but they work best when combined with other kinds of technical analysis
Disclosure: I am part of Trade Nation's Influencer program and receive a monthly fee for using their TradingView charts in my analysis.
———————————
WISH YOU ALL LUCK

GOLD BULLS ARE GAINING STRENGTH|LONG
GOLD SIGNAL
Trade Direction: long
Entry Level: 3,211.87
Target Level: 3,375.85
Stop Loss: 3,102.01
RISK PROFILE
Risk level: medium
Suggested risk: 1%
Timeframe: 12h
Disclosure: I am part of Trade Nation's Influencer program and receive a monthly fee for using their TradingView charts in my analysis.
✅LIKE AND COMMENT MY IDEAS✅

Gold buy setup 15mHello! Friends,
Greetings. Please leave a Like if you like the idea.
Before start talking about technical Let's share your LOVE by giving me LIKES to support this work. Thanks in advance.

XAUUSD 30M CHART PATTERNThis chart displays a technical analysis pattern on the XAU/USD (Gold/US Dollar) 30-minute timeframe. Here's a breakdown:
Pattern Identified: This appears to be an inverse head and shoulders or a rounded bottom pattern, signaling a potential trend reversal from bearish to bullish.
Entry Point: Marked by the green arrow, indicating a potential buying opportunity.
Stop Loss: Placed slightly below the lowest point in the pattern to limit risk.
Take Profit: Set near the upper boundary of the pattern’s resistance zone.
Strategy Insight:
This setup suggests a bullish bias, expecting the price to rise after forming a rounded bottom and breaking the neckline (resistance). The trader aims to profit from this breakout.
Would you like help calculating the exact risk-to-reward ratio or backtesting this setup?

XAUUSD TRADE SETUPWait for retest the entry level and bearish momentum then take a trade for Sell otherwise skip this setup

Will gold reach an all-time high?Gold (XAU/USD) Market Analysis
Trend Environment
The 4-hour chart of Gold (XAU/USD) from OANDA illustrates a strong impulsive structure within a broader bullish trend. Following a sharp upward movement that broke through previous structure, gold formed a swing high before entering a corrective phase. The market has since pulled back and appears to be stabilizing near a zone of high confluence, suggesting potential for a renewed move to the upside.
Key Levels
Support Zone 3,280-3,300 region, characterized by a fair value gap and Fibonacci golden pocket zone (0.618-0.65 retracement levels).
Potential Targets Higher lows and break of structure above recent swing highs, with buy-side liquidity levels (BSL) marking areas where buy stops are likely to be clustered.
Technical Confluence
The alignment of the fair value gap and Fibonacci retracement levels in the 3,280-3,300 region increases the likelihood of price reacting positively. Fair value gaps represent inefficiencies in the market caused by strong institutional participation, while the golden pocket is historically known for acting as a magnet for reversals within trending markets.
Bullish Scenario
The chart projects a potential bullish continuation move, with a series of higher lows anticipated to form en route to a break of structure above recent swing highs. A methodical stair-step advance is expected, respecting interim levels before ultimately attempting to reach the prior high near 3,530.
Strategic Framework
This analysis offers a methodical roadmap for bullish continuation, rooted in the smart money framework of liquidity, inefficiency, and institutional order flow. The confluence between the fair value gap and Fibonacci retracement serves as a key validation area for bullish traders. By understanding the technical and institutional drivers of the market, traders can better navigate the complexities of the gold market and identify potential opportunities for growth.

Gold 8H – Probable Scenario Until the End of May 2025Briefly today!
Greetings, let’s take a look at the current situation for gold.
Technically, we can see a classic symmetrical triangle forming on the 8-hour chart, with a support zone established in the 3291–3300 range.
I'm expecting a move towards the 3440–3450 area, followed by a retest and an upward push toward the 3833 level.
Fundamentally, we take into account Trump's policy stance and the ongoing conflict between Pakistan and India.

Gold Weekly Summary and Forecast 5/10/2025As predicted last week, I did expect gold's bullish trend to continue when 3165 was tested. However, it didn't go as predicted but went straight up to 3430. With corrections in the last days of this week, gold still closed the week with a positive candle. I am expecting the bullish trend to continue next week.
I will look in smaller timeframes for intraday trading ideas. Next week it should test 3500 again. If 3500 is broken, my ultimate target for next week will be 3647.
Let's see how the market plays out next week.

GOLD→Beware of market reversal? News is coming soon.At the end of the Asian session, the US dollar index was around 100.05. Gold rebounded after the plunge, and the current gold price is around $3,320/ounce.
Investors will see a large number of speeches by Fed officials, among which Williams' remarks are the most watched and are expected to trigger a big market trend.
Today's major news:
New York Fed President Williams will deliver a keynote speech at the 2025 Reykjavik Economic Conference. Later, Williams will speak at the Hoover Monetary Policy Conference.
I think if Williams makes hawkish remarks, it may push the dollar stronger, thereby suppressing gold prices.
Williams also serves as vice chairman of the Federal Open Market Committee and has permanent voting rights like the Fed governors.
In terms of monetary policy, Weems has the most say after Chairman Powell. Williams also served as chairman of the San Francisco Fed for nearly 7 years.
There are also several events taking place today: Fed Governor Kugler will speak on maximizing employment; North Richmond Fed President Barkin will participate in a fireside chat; Chicago Fed President Goolsbee will deliver a welcome and opening speech at a Fed event.
Gold price trend forecast:
I think its price may fall further to $3,200-3,100/ounce in the next few weeks.
I hope my analysis can help you, and I wish you good luck.

15 min long entrypoint XAUUSDThis is a long position that I just take.
Use risk and management and lets see How is will go.
