GOLD buy limitthe gold went from bearish to bullish this week breaking the 4 hour structure with a clean move
and now i'm waiting for a discount price to get in the wave , targeting all times high as shown
XAUUSD trade ideas

GOLD SELL TRADE RESULTGold hit our full tp 270 pips guys i give this trade in my channel and also in profile scroll down and see my work
Stay tuned for more trade setups

GOLD - WAVE 4 CORRECTION TO $2,800 (UPDATE)Gold climbed higher, but very swiftly rejected our 0.365% zone, melting back down 740 PIPS. Should see a continuation to the downside.
But as I said yesterday, if we see a breach of $3,465 then we'll create an alternate analysis which'll show Gold leading towards a new ATH, creating a 'redistribution phase' at higher prices.

XAUUSD: Gold setting up for small buy opportunities 15 min TFHello,
XAUUSD is currently setting up for a potential short-term buying opportunity. Despite elevated volatility in recent sessions, we expect this trend to persist as the new U.S. administration continues rolling out its policies. While Trump has softened his tone on tariffs, he remains firm on maintaining them until the U.S. secures fairer trade agreements—consistent with his broader economic agenda.
Given the prevailing uncertainty, we still see limited but promising opportunities for gold buyers. Technically, gold appears to have completed a corrective phase and is positioning for a fresh rally. Our near-term target is set at \$3,500. Additionally, the MACD is approaching a zero-line crossover, signaling a possible shift in momentum that supports a cautious bullish stance.
The FED rate decision later today could be the catalyst for the small move.
Good luck.
Disclosure: I am part of Trade Nation's Influencer program and receive a monthly fee for using their TradingView charts in my analysis.

Gold Technical Analysis.The image you uploaded is a technical analysis chart for XAU/USD (Gold) on the 1-hour timeframe, published on TradingView. Here’s a breakdown of the chart:
1. Trend and Pattern:
The chart shows a bullish trend with two ascending channels (marked in green) that recently broke to the downside.
The price reached a resistance zone (marked with a black rectangle) and reversed sharply.
2. Price Action:
The current price is approximately 3,370.94, showing a decrease of 1.91%.
After breaking the ascending channel, the price is showing bearish momentum.
3. Prediction/Target:
The chart suggests a potential continuation of the downward move, with a target around the 3,340 level (marked in blue).
A consolidation or small pullback is indicated before continuing downward.
4. Key Zones:
Resistance Zone: Around 3,400 - 3,440.
Support Zone/Target: Around 3,340.
The chart analysis indicates a bearish bias with the possibility of a price drop toward the target zone. Would you like insights on trading strategies based on this analysis?

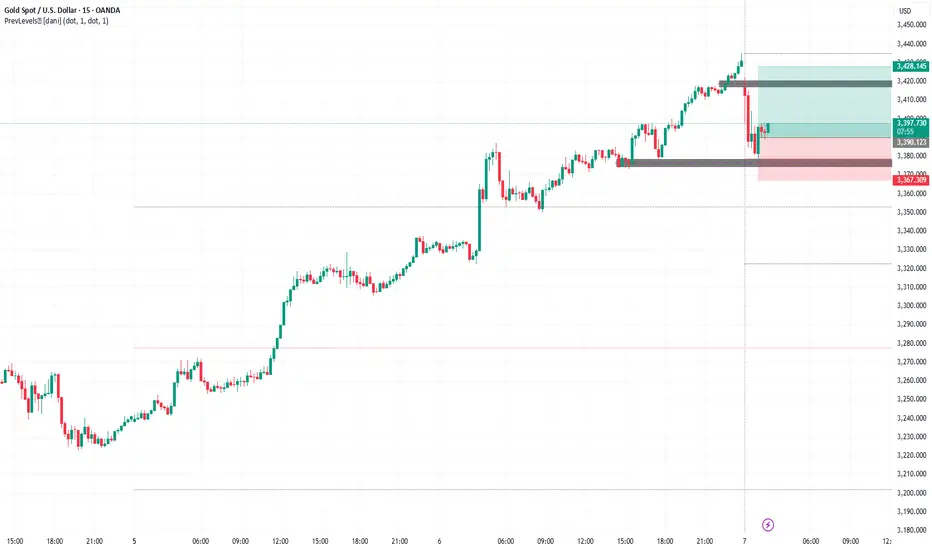
GOld BuyWe are in an uptrend. We have an engulfing candle on 15th minutes . WE join the market at the current rate hoping to fill the gap that is between 3420 and 3428
Gold long From 3224$Gold long from 3224.
Targeting that 3275 level .
I still think we hit that level before going further to the downside.

GOLD Great Buying Opportunity! Long!
Hello,Traders!
GOLD is making a nice
Bearish correction but we
Are bullish biased so as the
Price is about to hit a support
Cluster of the rising and
Horizontal support lines
Around 3171$ area we will
Be looking to enter a
Swing long trade on Gold
Buy!
Comment and subscribe to help us grow!
Check out other forecasts below too!
Disclosure: I am part of Trade Nation's Influencer program and receive a monthly fee for using their TradingView charts in my analysis.

XAU / USD 4 Hour ChartHello traders. Taking a look at the 4 hour chart. I see that if we break and close above the marked area on the chart.. I would consider taking a long positions. Always the same strategy.. Secure 30 pips in profit ( high leverage account), I close 75% of the trade's profit, move my Stop Loss to break even ( my entry point), and leave a runner running( the remaining 25% of the trade). 3 trades a day max, win or lose. This is how you win. That is a Raja Banks strategy, not mine. Big G gets all my thanks. Be well and trade the trend. Let's see how the NY open goes in 30 minutes from now. Trump is in the house.. We should start seeing some more truthful numbers when posted.

GOLD - WAVE 4 CORRECTION TO $2,800 (UPDATE)Huge melt off on Gold overnight! Price is down 1,100+ PIPS so far today & heading towards our predicted bias, which I showed you all on this analysis.
Heading down towards Wave A, before any internal correction to the upside is made for Wave B.

XAUUSD bearish descending channelcharted a bearish descending channel
The blue arrow indicates a likely continuation to the downside if this breakdown holds,
especially since there’s no strong bullish rejection candle at support.

XAUUSD: Buy ideaOn XAUUSD as you can see on the chart we would have a hight probability to have an uptrend after the breakout with force the resistance line.

GOLD - WAVE 4 CORRECTION TO $2,800 (UPDATE)Gold has started the week extremely bearish, by gapping down & taking out last week’s low.
Running 1,500 PIPS in profit, from rejecting our 0.365% supply zone, which I highlighted for you all last week on my analysis.

XAU/USD 12-16 May 2025 Weekly AnalysisWeekly Analysis:
Swing Structure -> Bullish.
Internal Structure -> Bullish.
Analysis and bias remains the same as analysis dated 16 March 2025.
In my analysis dated 27 October 2024 I mentioned (below) that price could potentially print higher-highs in order to reposition CHoCH. This is exactly how price printed. CHoCH positioning has been brought significantly closer to current price action. CHoCH positioning is denoted with a shortened blue dotted horizontal line.
The remainder of my analysis and bias remains the same as analysis dated 09 February 2025.
Price has printed a further bullish iBOS.
Price is currently trading within an internal low and fractal high. CHoCH positioning is denoted with a blue dashed line.
Price Action Analysis:
In my analysis dated 27 October 2024, it was noted that the first sign of a pullback would be a bearish Change of Character (CHoCH), indicated by a blue dotted line. Price's consistent upward momentum had repositioned previous CHoCH much closer to recent price levels as expected for weeks. Current CHoCH positioning is quite a distance away from price, therefore, it would be viable if price continued bullish to reposition ChOCH.
Note:
It is highly unlikely price will "crash" as many analysts are predicting. My view is this is merely a corrective wave of the primary trend.
Given the Federal Reserve's dovish policy stance alongside heightened geopolitical risks, market volatility is likely to remain elevated, influencing intraday price swings.
Price could also be driven by President Trump's policies, geopolitical moves and economic decisions which are sparking uncertainty and potential repricing of Gold.
Weekly Chart:
Daily Analysis:
Swing -> Bullish.
Internal -> Bullish.
Since my last weekly analysis price has finally printed a bearish CHoCH.
This is the first indication, but not confirmation of bearish pullback phase initiation.
Price is now trading within an established internal range.
Price should now technically trade down to either discount of 50% internal EQ, or Daily demand zone before targeting weak internal high, priced at 3,500.200.
Note:
The Federal Reserve’s continued dovish stance, coupled with escalating geopolitical uncertainties, is expected to sustain elevated market volatility, influencing both intraday and broader trend developments.
Additionally, price action may be further shaped by U.S. policy decisions, including measures enacted under President Trump. Shifts in geopolitical strategy and economic policymaking could introduce further uncertainty, contributing to the ongoing repricing dynamics within the gold market.
Daily Chart:
H4 Analysis:
-> Swing: Bullish.
-> Internal: Bullish.
Analysis and bias remains the same as analysis dated 23 April 2025
Price has now printed a bearish CHoCH according to my analysis yesterday.
Price is now trading within an established internal range.
Intraday Expectation:
Price to trade down to either discount of internal 50% EQ, or H4 demand zone before targeting weak internal high priced at 3,500.200.
Note:
The Federal Reserve’s sustained dovish stance, coupled with ongoing geopolitical uncertainties, is likely to prolong heightened volatility in the gold market. Given this elevated risk environment, traders should exercise caution and recalibrate risk management strategies to navigate potential price fluctuations effectively.
Additionally, gold pricing remains sensitive to broader macroeconomic developments, including policy decisions under President Trump. Shifts in geopolitical strategy and economic directives could further amplify uncertainty, contributing to market repricing dynamics.
H4 Chart:

XAUUSDPreferably suitable for scalping and accurate as long as you watch carefully the price action with the drawn areas.
With your likes and comments, you give me enough energy to provide the best analysis on an ongoing basis.
And if you needed any analysis that was not on the page, you can ask me with a comment or a personal message.
Enjoy Trading ;)

Gold Market Analysis – Weekly Outlook 10-05-2025Wondering where gold is heading next? Don’t worry, we’ve got you covered.
Our technical analysis indicates that gold has once again entered bearish territory on the 4-hour chart as of Friday’s close. This marks the second time in two weeks that gold has shifted into a bearish trend, further supporting our current outlook.
We have maintained a bearish bias on gold for several weeks, and the latest movement in the moving averages continues to validate this view, at least in the short term. Our team is actively monitoring the market for sell opportunities on lower timeframes, aiming to maximize profitability.
Stay tuned for further updates from the InvestmentLive trading desk.

The Fed’s interest rate decision makes a grand debut
After gold quickly rose and fell today, gold basically began to fluctuate sideways. Of course, this is also to welcome the heavy data of the Federal Reserve's interest rate decision; gold is likely to fluctuate like this before the data, so where will the Federal Reserve's interest rate decision go? And how to lay it out?
Judging from the recent market and data, there is a high probability that gold will keep interest rates unchanged, so gold as a whole will still maintain a volatile upward trend. The gold 1-hour moving average is still a bullish arrangement with a golden cross upward. The strength of the gold bulls is still there, and gold will continue to make more dips. Gold 3350 is still an important turning point for gold's long-short transition. After the gold Fed interest rate decision, then we will continue to go long on dips above 3350. After the Federal Reserve's interest rate decision, gold will continue to buy on dips above 3350.
Gold's short-term trend is still a bullish arrangement. Gold will continue to buy on dips without breaking 3350. If the gold data unexpectedly falls below 3350, then re-arrange it at that time.
Operational ideas:
Gold more than 3350, stop loss 3340, target 3400-3420;

GoldXAUUSD
- Point of Interest
- Symmetrical Triangle as corrective pattern in Short Time Frame
- Order Block
- Completed " 12345 " Impulsive Waves and " AB " Corrective Waves
- Fibonacci Level - 38.20% / 50.00%

Gold H4 | Pullback support at 38.2% Fibonacci retracementGold (XAU/USD) is falling towards a pullback support and could potentially bounce off this level to climb higher.
Buy entry is at 3,343.88 which is a pullback support that aligns with the 38.2% Fibonacci retracement.
Stop loss is at 3,270.00 which is a level that lies underneath an overlap support and the 61.8% Fibonacci retracement.
Take profit is at 3,431.43 which is a swing-high resistance that aligns with the 78.6% Fibonacci retracement.
High Risk Investment Warning
Trading Forex/CFDs on margin carries a high level of risk and may not be suitable for all investors. Leverage can work against you.
Stratos Markets Limited (tradu.com):
CFDs are complex instruments and come with a high risk of losing money rapidly due to leverage. 63% of retail investor accounts lose money when trading CFDs with this provider. You should consider whether you understand how CFDs work and whether you can afford to take the high risk of losing your money.
Stratos Europe Ltd (tradu.com):
CFDs are complex instruments and come with a high risk of losing money rapidly due to leverage. 63% of retail investor accounts lose money when trading CFDs with this provider. You should consider whether you understand how CFDs work and whether you can afford to take the high risk of losing your money.
Stratos Global LLC (tradu.com):
Losses can exceed deposits.
Please be advised that the information presented on TradingView is provided to Tradu (‘Company’, ‘we’) by a third-party provider (‘TFA Global Pte Ltd’). Please be reminded that you are solely responsible for the trading decisions on your account. There is a very high degree of risk involved in trading. Any information and/or content is intended entirely for research, educational and informational purposes only and does not constitute investment or consultation advice or investment strategy. The information is not tailored to the investment needs of any specific person and therefore does not involve a consideration of any of the investment objectives, financial situation or needs of any viewer that may receive it. Kindly also note that past performance is not a reliable indicator of future results. Actual results may differ materially from those anticipated in forward-looking or past performance statements. We assume no liability as to the accuracy or completeness of any of the information and/or content provided herein and the Company cannot be held responsible for any omission, mistake nor for any loss or damage including without limitation to any loss of profit which may arise from reliance on any information supplied by TFA Global Pte Ltd.
The speaker(s) is neither an employee, agent nor representative of Tradu and is therefore acting independently. The opinions given are their own, constitute general market commentary, and do not constitute the opinion or advice of Tradu or any form of personal or investment advice. Tradu neither endorses nor guarantees offerings of third-party speakers, nor is Tradu responsible for the content, veracity or opinions of third-party speakers, presenters or participants.

GOLD PLAN UPDATE 07/05/2025H4 is showing a reversal signal, but it looks more like a retest of the broken resistance zone.
By the book + looking at the D1 chart, there’s a high chance gold pushes higher after this retest.
To me, this current rally feels a bit shaky.
My view: gold might retest or break the previous high, but I don’t see it running too far before pulling back again.
That’s my medium-term outlook—not a short-term call. Let’s wait and see 😄

GoldXAUUSD
- Double Top as corrective pattern in Short Time Frame
- Break of Structure
- RSI - Divergence
- Completed " 12345 " Impulsive Waves
- Change of Characteristics

Gold Chart And Factor Of 3Price changes with a factor of 3 and its reaction to support and resistance levels.
3% , 6% , 9% , 12% , 15% , 18% ...

