Has the road to gold adjustment begun?Gold has reached a high of around 3404, so this position can be used as an important pressure point. In this continuous upward trend, once there is a sharp decline, it is likely to be a signal that the short-term bulls have peaked. Then we need to consider whether the bears can reverse, and the current upper pressure point is also the high point of the last wave of pullback near 3393, and the lower support is at 3360.
Trading idea: short near 3387, sl: 3400 tp: 3370
XAUUSD trade ideas

XAU/USD Live Market Breakdown – May 8, 2025📊XAU/USD Live Market Breakdown – May 8, 2025
🔹Current Price: 3,337.40
🔹Timeframe: 15M
📌Key Supply Zones (Resistance):
🔴3377–3382 – Major Supply Zone (previous BOS area)
🔴3362.85 – Minor intraday resistance (price failed to hold)
📌Key Demand Zones (Support):
🟢3272–3277 – Fresh demand; wait for confirmation before long
🟢3310.01 – Minor reaction area
🟢3274.13 – Deeper support if sell-off continues
📉Current Outlook:
Gold broke below multiple internal demand zones, confirming bearish momentum. Now trading inside the 3272–3277 HTF demand. This is a key zone to monitor for reversal or further breakdown.
📈Bullish Scenario:
Price must show bullish confirmation (engulfing/BOS) from 3272–3277 to consider long positions. Without confirmation, bias remains bearish.
⚠️Strategy Tip:
✅Wait for lower-timeframe BOS or CHoCH in green zone
✅Don’t catch falling knives – wait for confirmation
✅SL must go below zone; TP can target 3362 short-term
#XAUUSD #SmartMoneyConcepts #PriceAction #BreakOfStructure #GoldTrading #IntradaySetups #FXFOREVER #DemandZones #WaitForConfirmation

bullish tradel'm anticipating gold to buy until it broke the previous high that was set on 21/4/2025. lm anticipating that the market will grab liquidity to the previous high and then make a temporary draw down

XAU/USD... gold 1h chart pattern.Technical Analysis
1. Trend Overview:
Uptrend Momentum: The market is currently showing bullish strength. The price has broken above key resistance levels, confirming upward momentum.
Higher Highs and Higher Lows: A structure of higher highs and lows supports the uptrend scenario.
2. Entry Point: 3313
This level may have been a breakout point or a retracement zone (e.g., 38.2% or 50% Fibonacci level) acting as a confirmation of bullish continuation.
If volume increased at this level, it adds confidence to the entry.
3. Target Point: 3500
The target suggests an upside potential of +183 pips, which is significant.
This level might align with a major resistance zone or a psychological round number.
4. Support and Resistance Zones:
Immediate Support: 3313 (entry), followed by 3280 and 3250.

Gold fluctuates at high levels and washes out repeatedly!The Asian and European sessions fluctuated repeatedly and stabilized above 3360. In the evening, the US session fell slightly and stabilized at the 3360 mark, ushering in a bottoming rebound. The daily K-line closed at a high level. The daily structure closed at a high level. It closed a little stronger, and the weekly line reached a high for the second time. It has not yet formed a high and fall. The continuous form is impacted by the news, waiting for further confirmation of the form. The previous wave of strong rebound in the 4-hour chart of gold, the overall gold price rebounded in the short term for two consecutive trading days, and yesterday it was under pressure and fell. The situation of shock, but now it has formed a stage support area above 3360. After the opening of the Asian session, the gold price rose strongly and returned to above 3390. At present, it has reached 3415. Pay attention to the support level of 3360 below. If the support is effective, the gold price is expected to rise again. If it enters a shock wash, it is recommended to adopt the idea of selling high and buying low. Therefore, the current trend, people who like shocks feel very comfortable, and people who look at one side feel uncomfortable. The early trading operation is still in the range of 3420-3360, and a new layout will be made after breaking through! Overall, the short-term operation strategy of gold is recommended to be short-selling on rebounds and long-selling on pullbacks. The short-term focus on the upper side is the 3420-3438 line of resistance, and the short-term focus on the lower side is the 3350-3360 line of support.

Gold Potential Bullish ContinuationGold price still seems to exhibit signs of potential Bullish momentum as the price action may form a credible Higher Low with multiple confluences through key Fibonacci and Support levels which presents us with a potential long opportunity.
Trade Plan:
Entry : 3389.8
Stop Loss : 3345
TP 0.9 - 1 : 3430 - 3434

Gold short For those who missed the 3430$ short there is another chance from 3410$ .
Lets wait for the price action.

XAUUSD (GOLD) | 4H | SWING TRADING Good morning, my friends,
Gold is currently at the 3355.0 level.
Even if gold makes a correction at this point, my target remains 3461.0.
This is a swing trading model, so there may be delays in reaching my target. However, I am confident that I will reach it eventually.
Once we hit that level, I will share an update for you all.
Dear friends, your likes are always my biggest motivation to keep sharing analyses. That’s why I kindly ask each of my followers to show their support—please don’t hold back on the likes.
I sincerely thank everyone who supports me with their likes. It truly means a lot

GOLD 100 pips booked on free analysis on London session ,based on structure buyers buy order triggered and our next target will be supply roof to sell from that higher zone if possible...selling pressure is higher than buy sentiment based on dxy demand .

XAUUSD 30M Long Setup – Inverse Head & Shoulders with Imbalance This trade is based on a bullish breakout of an inverse head and shoulders pattern identified on the 30-minute chart for XAUUSD (Gold Spot). The right shoulder has completed, and price has broken above the neckline, entering a key imbalance zone that needs to be closed above for confirmation. Entry is placed at 3,309.291 with staged limit orders down to 3,296.202, targeting a move to the next supply zone at 3,364.749 (TP2), with the first take profit at 3,345.561 (TP1). Stop loss is set at 3,275.017. The setup includes imbalance fills, supply/demand zones, and clear bullish structure, aiming for a 4.66% upside on full execution.

XAU/USD:Short-term range tradingThe international geopolitical situation has suddenly escalated, triggering market risk aversion and pushing up the price of gold. Today's interest rate decision of the Federal Reserve and Powell's speech will dominate the trend of the bullish and bearish sides. During the Asian trading session, the price of gold has fluctuated sharply. Be wary of a significant pullback after a moderate rise. If the key resistance level of $3400 cannot be broken, the probability of a short-term peak will increase greatly.
In terms of operation, avoid chasing high prices. Focus on the impact of the interest rate meeting on the real interest rate and the US dollar index. Buy on dips within the range of $3360-$3400 and sell at high levels to hedge risks.
I am committed to sharing trading signals every day. Among them, real-time signals will be flexibly pushed according to market dynamics. All the signals sent out last week accurately matched the market trends, helping numerous traders achieve substantial profits. Regardless of your previous investment performance, I believe that with the support of my professional strategies and timely signals, I will surely be able to assist you in breaking through investment bottlenecks and achieving new breakthroughs in the trading field.

New York market XAUUSD trading opportunities.The 3400 position has been broken. Short-term bulls are still strong. The swing buying we executed all day today has made continuous profits. Such one-sided market conditions in trading have good profits. But the premise needs to be executed. This requires execution and courage.
Teacher Ludvig pointed out that the probability of reaching the target 3440 before tomorrow's London market is more than 90.36%. So this is a good buying opportunity for traders who don't know how to trade now.
The precise trading points are released in the Swing Trading Center. If you don't know what to trade now. Then you can refer to it.
Control trading risks according to the capital situation when trading.

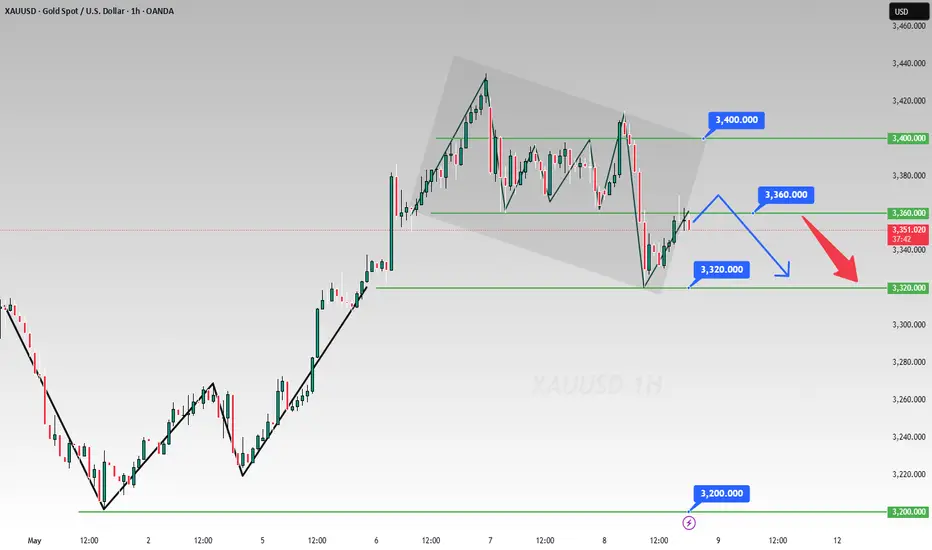
There's still a little more left to sip from gold’s cup
Weekly Outlook on Gold (XAUUSD)
Gold has formed a classic cup pattern on the weekly timeframe, indicating a strong bullish continuation setup. If the pattern completes successfully, we could see a move toward the top of the channel, targeting the 4039 – 4100 zone.
The recent pullback to 3208 was a retest of the previously broken daily structure, acting as a healthy correction before the next potential leg up.
For those looking to enter this move, an ideal strategy would be to place a buy stop order above the last high, as a breakout confirmation.
⚠️ Important note: If the black trendline on the daily chart (which represents the current bullish structure) gets broken to the downside, the trade setup would become invalid and a reassessment would be required.
✅ The best approach is to wait for a clean breakout above the 3495 resistance, then look for a pullback entry on lower timeframes with proper risk management.
📉 In the longer term, we still expect a potential retracement all the way back to the 2199.661 level — so be aware of the bigger picture and adapt as the structure evolves.

XAU/USD – May 12, 2025📊XAU/USD – May 12, 2025
🔹Current Price: 3,277.10
🔹Timeframe: 15M
📌Key Supply Zones:
🔴 3356–3368 – Higher-timeframe supply (strong rejection zone)
🔴 Mid-level untested supply zone near 3,300 (minor reaction observed)
📌Key Demand Zones:
🟢 3257–3269 – Current support zone; holding price for now
🟢 3222.9–3226 – HTF demand base (critical if breakdown continues)
📉Bearish Bias:
Price remains in a clear downtrend with lower highs and lower lows. Currently reacting from the 3257–3269 demand. If this zone fails, expect deeper selloff toward 3222.
📈Bullish Setup (If Confirmed):
Only a strong bounce and BOS from 3269 can open short-term longs toward 3300+. Watch for reaction and engulfing on lower timeframes.
⚠️Execution Tip:
✅ Don’t trade blindly into zones – wait for confirmation
✅ Focus on RR setups only when structure shifts
✅ Use 5M/15M BOS to align with direction
#XAUUSD #GoldAnalysis #FXFOREVER #SupplyAndDemand #SmartMoneyConcepts #GoldScalping #BreakOfStructure #IntradayTrading #WaitForConfirmation

3305 support retest3305 support retest
making higher high would confirm 3358-3364 resistance retest
while long term bearish trend need another lower low (under 3294)


Strong support at 3360; future trend analysis belowI mentioned yesterday that gold was accumulating bullish momentum to challenge the 3400 level at that time 📈. If the challenge failed, it would drop sharply 📉, and if it succeeded, it would continue to rise. That's why I advised you not to trade at that moment, as it was easy to choose the wrong direction and have your account wiped out 💥.
Currently, the international geopolitical situation has suddenly heated up 🌋, and the market's risk - aversion sentiment has once again pushed up the gold price 📈. However, tonight's Federal Reserve interest rate decision and Jerome Powell's speech will be key nodes in the battle between bulls and bears ⚔️. The sharp fluctuations in gold this morning conform to the characteristics of a washout 🌀. But be wary of a significant pullback after the continuous slow rise 🚨.
In terms of operation, it is recommended that investors avoid blindly chasing the upward trend and focus on the impact of the Fed's decision on real interest rates and the US dollar 👀. Currently, the resistance above is at 3397 - 3407, and the strong support level of 3360 has been tested twice today, showing a double V bottom pattern📊.
⚡️⚡️⚡️ XAUUSD ⚡️⚡️⚡️
🚀 Buy@3360
🚀 TP 3380 - 3390
Accurate signals are updated every day 📈 If you encounter any problems during trading, these signals can serve as your reliable guide 🧭 Feel free to refer to them! I sincerely hope they'll be of great help to you 🌟 👇

GOD BUY GREAT TUESDAY
Greetings traders this is my analysis on gold and its a long for buy
Technical analysis of gold
informatoin ; Head and Shoulders
this pattern is now even more clearly presented with.
Head_ a higher peak (higher high)
Left shoulder_a weaker atempt recover , which confirms the loss of bullish strength
Usually, such a pattern is followed by a corrective move downwards (which has already been partially see)
potential trend change zone
Highlighted support in zone
3345_3325 usd _very imortant for confirming the bullish scenario.
the shown ''bounce zone'' suggests a possible purchase if the price bounces from this area
predicted path expected
fall to support (around 3345_3325 USD
Conclusion and strategy
Scenario 1(main) buy zone between 3357 3335 if price action signal is seen (pin bar engulfing
TARGET 3500+
Stoploss: Bellow 3300 support
Scenario2 (riskier) : If price does not bounce from that zone possible further deepening towards 3250 3215
Dear Traders like comment let me know what do you think

Will gold prices rise again this week?As the US dollar is approaching the key middle track of the daily line, it is not far away. In the next two days, it is expected to end the rebound correction and continue to start a weak trend decline. Therefore, gold may also have a short-term bottom at any time in the next two days. The next step is to wait for a wave of pullback. At least the bottom low point of the previous convergence triangle of 3260-3270 will be tested and confirmed. After the test, if it cannot stand under pressure, there may be a second bottom test, a secondary low point or a double bottom, and then finally start a unilateral rise all the way; of course, if 3200 is not the low point of tonight, and the lower shadow of the daily closing is short, then it may be necessary to test the last 3175 position before determining the short-term bottom;

Skeptic | XAU/USD Analysis: Gold’s Next Big Move Is Brewing!Hey everyone, Skeptic here! Let’s kick off the morning with a deep dive into XAU/USD —gold’s serving up some exciting opportunities right now! 😊 Activating our triggers could spark a sharp move, potentially reigniting the major trend from before, so stick with me to the end of this analysis. As always, we’ll start with the Daily Timeframe to get the big picture. Let’s dive in! 📊
📅 Daily Timeframe: The Big Picture
It’s clear as day—the major trend is bullish . We’re seeing higher highs and higher lows, which, per Dow Theory, confirms a solid uptrend. After gold hit a peak at 3502.48 , it entered a secondary corrective trend, pulling back to the 50% Fibonacci retracement level. This correction was healthy, and the price action suggests the uptrend still has plenty of juice left. 💪
Post the sell-off candle on May 1, it looks like the correction might be done, and we’re now heading to test the resistance at 3425.31 . If that level breaks, we could see the major uptrend resume with some serious momentum. With this in mind, let’s zoom into the 1-Hour Timeframe to hunt for long and short triggers.
⏰ 1-Hour Timeframe: Long & Short Setups
The last trigger I used for a long position was at 3270.75 , and it’s been performing nicely so far. But if this growth is to continue—and the correction is truly over—we’re about to see some explosive moves. The long trigger I’m about to share is worth the risk. Plus, if we don’t enter longs around these levels, it’ll get trickier later. A break above 3494.51 could come with heavy shadows, hunting stop losses, or it might spike too fast, leaving us without a good entry. So, the smarter play is to enter now with lower risk and higher R/R. Here’s the plan:
Long Setup 📈
Open a long position after a break above resistance at 3383.61 .
Target? The previous ceiling is a good start, but don’t close too early. Enter with the mindset that if the ceiling breaks, you’re already in a position, sitting pretty. Personally, I’m keeping my earlier long from below open, letting those profits run for peace of mind later. 😎
Short Setup 📉
For shorts, patience is key. Wait for a rejection from these levels, followed by a break below support at 3270.75 . That’s when we open a short position. No rush to short just yet—gold’s not showing signs of a momentum shift. But if it does, we could see deeper corrections, so keep both triggers on your radar. 🐻
🧠 Why This Matters
Spotting these triggers in a multi-timeframe setup gives us an edge, aligning short-term moves with the bigger trend. It’s all about stacking the odds in our favor. Want more insights like this? Check out my latest article on multi-timeframe strategies —it’s a game-changer! 📚
💬 Let’s Talk!
If this analysis helped you out, give it a quick boost—it means a lot! 😊 Got a pair or setup you want me to tackle next? Drop it in the comments, and I’ll get to it. Thanks for hanging out, and I’ll see you in the next one. Keep trading smart! ✌️

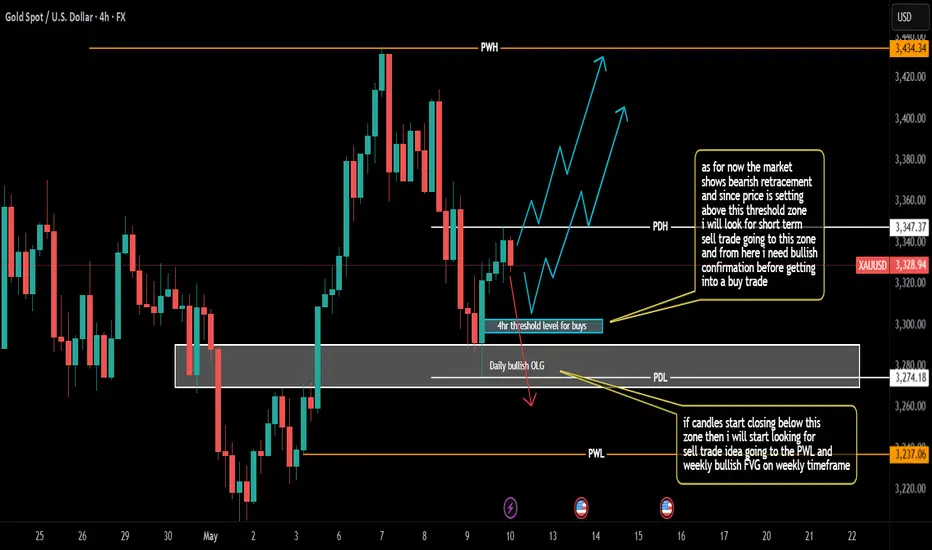
Weekly Analysis on GOLDFor next week trading session i will be looking for both buy and sell opportunities depending on how candles will form.
Tariffs, Fed & 3360 Line: Short-Term Bearish Gold Analysis📈 Tariff and International Relations: The Key Drivers of Gold Price 🌐
At present, the most crucial factors affecting the gold price are still the tariff situation and international relations. These global dynamics can quickly shift market sentiment, making gold a barometer for economic and geopolitical stability. Tensions often send investors flocking to the safety of gold, while diplomatic breakthroughs can ease its appeal. 📉💼
⚖️ 3360: The Pivotal Divide Between Bulls and Bears 📊
As things stand now, 3360 has clearly become an important dividing line for the game between the bulls and the bears. Technical analysts and traders closely monitor this level day and night. A decisive break above 3360 could fuel a bullish rally, while a drop below might unleash bearish momentum. 🚀📉 Every tick around this number draws intense attention from the trading community. 👀
📰 Real - Time News Shaping the Gold Market 📢
A series of real - time developments, such as the information released by the Federal Reserve, the remarks of Jerome Powell, and the agreements on tariffs signed between the UK and the US, are all influencing the trend of the gold market. Each central bank statement or trade deal announcement can send shockwaves through the market, triggering rapid price movements. Traders constantly refresh their news feeds, ready to react at a moment's notice. 💻⏱️
🌍 Future Outlook: A Bearish Short - Term Trend 📉
With the development of the situation, the tariff issue is likely to be further alleviated in the future. Based on this, from a short - term perspective, the gold price shows a bearish trend. However, long - term investors should also keep an eye on other variables like inflation rates and geopolitical flashpoints that could potentially reverse this trend. After all, the gold market is full of surprises! 🎯🔮
⚡️⚡️⚡️ XAUUSD ⚡️⚡️⚡️
🚀 Sell@3360
🚀 TP 3340 - 3320
Accurate signals are updated every day 📈 If you encounter any problems during trading, these signals can serve as your reliable guide 🧭 Feel free to refer to them! I sincerely hope they'll be of great help to you 🌟 👇
GOLD - Sell Setup📉 GOLD - Sell Setup
🔹 Date: 07 May 2025
🔹 Pattern: Double Top + Break of Trendline
🔹 Entry Zone: 3387 - 3397 (Strong Resistance Rejection)
🔹 Confirmation: Clear rejection from previous supply area (highlighted in red), with break below ascending trendline.
🔹 Target 1: 3350
🔹 Target 2: 3337
🔹 Stop Loss: Above 3400
🔹 Risk/Reward: Solid setup with favorable RRR.
