Will gold prices rise again this week?As the US dollar is approaching the key middle track of the daily line, it is not far away. In the next two days, it is expected to end the rebound correction and continue to start a weak trend decline. Therefore, gold may also have a short-term bottom at any time in the next two days. The next step is to wait for a wave of pullback. At least the bottom low point of the previous convergence triangle of 3260-3270 will be tested and confirmed. After the test, if it cannot stand under pressure, there may be a second bottom test, a secondary low point or a double bottom, and then finally start a unilateral rise all the way; of course, if 3200 is not the low point of tonight, and the lower shadow of the daily closing is short, then it may be necessary to test the last 3175 position before determining the short-term bottom;
XAUUSD trade ideas

Skeptic | XAU/USD Analysis: Gold’s Next Big Move Is Brewing!Hey everyone, Skeptic here! Let’s kick off the morning with a deep dive into XAU/USD —gold’s serving up some exciting opportunities right now! 😊 Activating our triggers could spark a sharp move, potentially reigniting the major trend from before, so stick with me to the end of this analysis. As always, we’ll start with the Daily Timeframe to get the big picture. Let’s dive in! 📊
📅 Daily Timeframe: The Big Picture
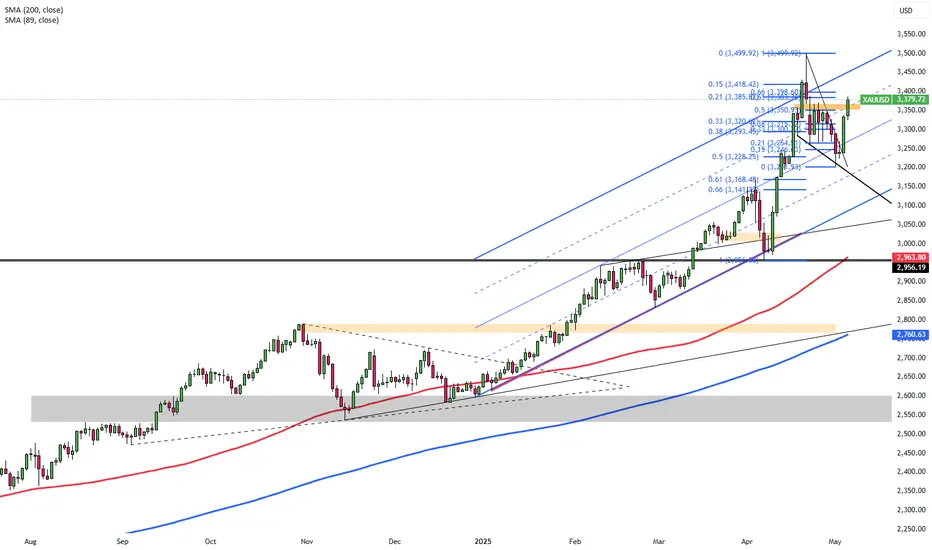
It’s clear as day—the major trend is bullish . We’re seeing higher highs and higher lows, which, per Dow Theory, confirms a solid uptrend. After gold hit a peak at 3502.48 , it entered a secondary corrective trend, pulling back to the 50% Fibonacci retracement level. This correction was healthy, and the price action suggests the uptrend still has plenty of juice left. 💪
Post the sell-off candle on May 1, it looks like the correction might be done, and we’re now heading to test the resistance at 3425.31 . If that level breaks, we could see the major uptrend resume with some serious momentum. With this in mind, let’s zoom into the 1-Hour Timeframe to hunt for long and short triggers.
⏰ 1-Hour Timeframe: Long & Short Setups
The last trigger I used for a long position was at 3270.75 , and it’s been performing nicely so far. But if this growth is to continue—and the correction is truly over—we’re about to see some explosive moves. The long trigger I’m about to share is worth the risk. Plus, if we don’t enter longs around these levels, it’ll get trickier later. A break above 3494.51 could come with heavy shadows, hunting stop losses, or it might spike too fast, leaving us without a good entry. So, the smarter play is to enter now with lower risk and higher R/R. Here’s the plan:
Long Setup 📈
Open a long position after a break above resistance at 3383.61 .
Target? The previous ceiling is a good start, but don’t close too early. Enter with the mindset that if the ceiling breaks, you’re already in a position, sitting pretty. Personally, I’m keeping my earlier long from below open, letting those profits run for peace of mind later. 😎
Short Setup 📉
For shorts, patience is key. Wait for a rejection from these levels, followed by a break below support at 3270.75 . That’s when we open a short position. No rush to short just yet—gold’s not showing signs of a momentum shift. But if it does, we could see deeper corrections, so keep both triggers on your radar. 🐻
🧠 Why This Matters
Spotting these triggers in a multi-timeframe setup gives us an edge, aligning short-term moves with the bigger trend. It’s all about stacking the odds in our favor. Want more insights like this? Check out my latest article on multi-timeframe strategies —it’s a game-changer! 📚
💬 Let’s Talk!
If this analysis helped you out, give it a quick boost—it means a lot! 😊 Got a pair or setup you want me to tackle next? Drop it in the comments, and I’ll get to it. Thanks for hanging out, and I’ll see you in the next one. Keep trading smart! ✌️

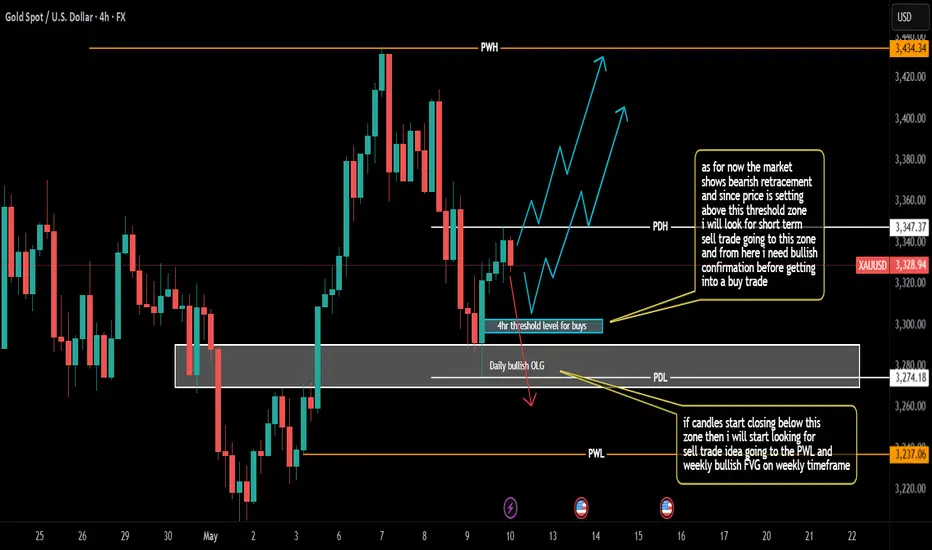
Weekly Analysis on GOLDFor next week trading session i will be looking for both buy and sell opportunities depending on how candles will form.
3305 support retest3305 support retest
making higher high would confirm 3358-3364 resistance retest
while long term bearish trend need another lower low (under 3294)

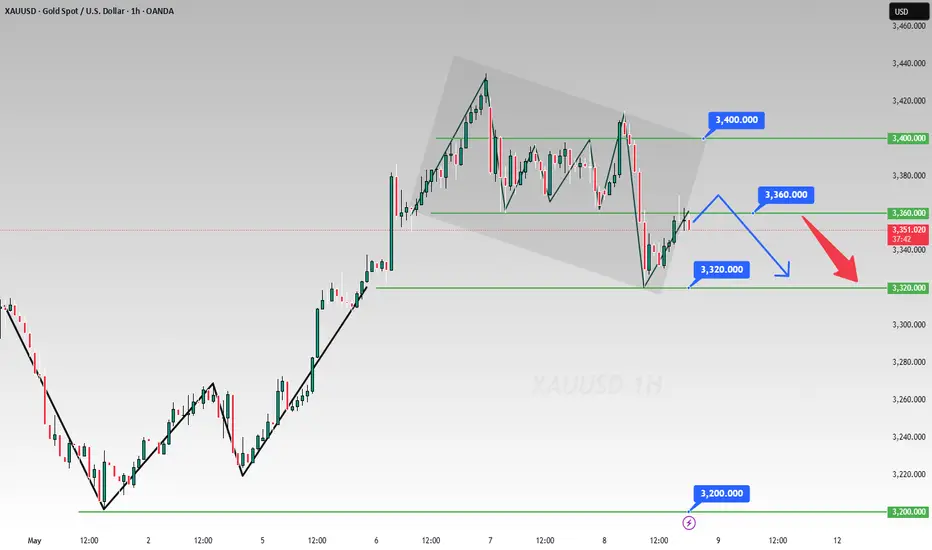
Tariffs, Fed & 3360 Line: Short-Term Bearish Gold Analysis📈 Tariff and International Relations: The Key Drivers of Gold Price 🌐
At present, the most crucial factors affecting the gold price are still the tariff situation and international relations. These global dynamics can quickly shift market sentiment, making gold a barometer for economic and geopolitical stability. Tensions often send investors flocking to the safety of gold, while diplomatic breakthroughs can ease its appeal. 📉💼
⚖️ 3360: The Pivotal Divide Between Bulls and Bears 📊
As things stand now, 3360 has clearly become an important dividing line for the game between the bulls and the bears. Technical analysts and traders closely monitor this level day and night. A decisive break above 3360 could fuel a bullish rally, while a drop below might unleash bearish momentum. 🚀📉 Every tick around this number draws intense attention from the trading community. 👀
📰 Real - Time News Shaping the Gold Market 📢
A series of real - time developments, such as the information released by the Federal Reserve, the remarks of Jerome Powell, and the agreements on tariffs signed between the UK and the US, are all influencing the trend of the gold market. Each central bank statement or trade deal announcement can send shockwaves through the market, triggering rapid price movements. Traders constantly refresh their news feeds, ready to react at a moment's notice. 💻⏱️
🌍 Future Outlook: A Bearish Short - Term Trend 📉
With the development of the situation, the tariff issue is likely to be further alleviated in the future. Based on this, from a short - term perspective, the gold price shows a bearish trend. However, long - term investors should also keep an eye on other variables like inflation rates and geopolitical flashpoints that could potentially reverse this trend. After all, the gold market is full of surprises! 🎯🔮
⚡️⚡️⚡️ XAUUSD ⚡️⚡️⚡️
🚀 Sell@3360
🚀 TP 3340 - 3320
Accurate signals are updated every day 📈 If you encounter any problems during trading, these signals can serve as your reliable guide 🧭 Feel free to refer to them! I sincerely hope they'll be of great help to you 🌟 👇
GOLD - Sell Setup📉 GOLD - Sell Setup
🔹 Date: 07 May 2025
🔹 Pattern: Double Top + Break of Trendline
🔹 Entry Zone: 3387 - 3397 (Strong Resistance Rejection)
🔹 Confirmation: Clear rejection from previous supply area (highlighted in red), with break below ascending trendline.
🔹 Target 1: 3350
🔹 Target 2: 3337
🔹 Stop Loss: Above 3400
🔹 Risk/Reward: Solid setup with favorable RRR.

Real-time analysis of the XAUUSD market.The current volatile trend is to give room for adjustment for the interest rate decision and the Fed's speech later.
If the interest rate is expected to remain unchanged or increase, it will boost the US dollar index. This will suppress the xauusd market. It will be bearish and fall. If the interest rate is cut, it will boost XAUUSD. But I think the market will not raise interest rates at this stage. The probability of a rate cut is also very low. So maintaining the same interest rate is the first choice.
In terms of trading, traders with large amounts of capital can sell at 3385 at the current price, while traders with small amounts of capital can wait until the market returns above 3400 before selling.
The Swing Trading Center continuously updates new real-time trading opportunities. If you don't understand trading, or don't want to miss the next real-time trading opportunity, remember to follow me.

GOLD: Bullish Continuation & Long Trade
GOLD
- Classic bullish formation
- Our team expects pullback
SUGGESTED TRADE:
Swing Trade
Long GOLD
Entry - 3387.7
Sl - 3380.3
Tp - 3403.8
Our Risk - 1%
Start protection of your profits from lower levels
Disclosure: I am part of Trade Nation's Influencer program and receive a monthly fee for using their TradingView charts in my analysis.
❤️ Please, support our work with like & comment! ❤️

XAUUSD UP OR DOWN?My analysis outlines a common technical trading strategy based on order blocks and market structure shifts (MSS) in XAUUSD (gold vs USD). Here's a breakdown and a more structured interpretation of what you might be saying:
🟨 Technical Analysis Summary:
Order Block Identified at 3340.00 (1H Timeframe):
This is likely a bearish or bullish order block, where institutions previously placed large orders.
Price is expected to react at this level (likely resistance or support, depending on context).
Need to Observe Market Structure Shift (MSS) on Lower Timeframes:
You're waiting for a confirmation (e.g., a break of structure or BOS) on a 15M or 5M chart before entering a position.
This is a confirmation strategy to avoid false reactions.
Potential Retracement to 3260.00:
This may be a liquidity grab or the lowest point (swing low) before the next upward move.
Implies you're expecting a bullish reversal from that zone after an MSS.

GOLDChina's central bank is aggressively accumulating gold reserves as part of a multifaceted strategic agenda, driven by the following factors:
1. Diversification Away from US Dollar Assets
China is reducing reliance on US Treasuries, converting proceeds into gold to mitigate risks from US sanctions, trade tensions, and dollar volatility.
Gold now represents 6.5% of China’s total foreign reserves (up from 5.9% in January 2025), signaling a deliberate shift toward non-USD assets.
2. Geopolitical and Economic Hedging
Escalating US-China trade conflicts (e.g., tariffs) and Taiwan tensions have heightened the need for a "safe haven" asset to insulate China’s economy.
Gold’s role as a crisis hedge is critical amid fears of financial instability or sanctions, especially with the US targeting Chinese exports.
3. Supporting the Yuan’s Global Role
Gold reserves bolster confidence in the yuan, aiding its internationalization and positioning it as a credible alternative to the dollar in trade settlements.
The PBOC’s gold-backed digital yuan initiative aims to enhance its appeal as a global reserve currency.
4. State-Mandated Institutional Demand
Chinese insurers and pension funds are required to allocate 1% of assets to gold, absorbing ~30–40% of global annual supply.
This creates structural supply deficits, driving up prices and reinforcing gold’s value in China’s reserves.
5. Undisclosed Strategic Stockpiling
Officially reported reserves (2,292t) likely understate holdings. Analysts estimate 40,000+ tonnes when including military and state-controlled entities.
Secret stockpiling prepares China for potential crises, including wartime financing or currency stabilization.
6. Market Dynamics and Price Control
The PBOC’s sustained purchases (12.8t in Q1 2025) and Shanghai Futures Exchange activity have fueled gold’s 20% price surge in 2025, enhancing reserve values.
By dominating physical markets, China gains influence over global gold pricing, reducing dependence on Western exchanges.
Summary:
Reduce USD dependency Swap Treasuries for gold Insulates against US policy risks
Yuan internationalization Back currency with gold reserves Enhances trust in digital yuan
Geopolitical hedge Prepare for trade/currency wars Stabilizes economy during crises
Control supply/pricing Mandate institutional buying, restrict exports Tightens global supply, supports prices
China’s gold strategy is a calculated response to global instability, aiming to secure economic sovereignty and challenge the dollar’s dominance. This trend is expected to persist, with analysts forecasting gold could reach $4,500/oz by late 2025 due to China-driven demand

Gold Prediction Hits 600+ Points – Spot On!Spot-on analysis! Yesterday’s gold setup played out perfectly, delivering over 600 points. Demand zone held strong, and bulls took full control. Precision pays off – follow for more high-probability setups!
#XAUUSD #GoldAnalysis #TradingView #PriceAction #ForexSignals #TechnicalAnalysis #GoldBulls #MarketPrediction #600Points #SmartTrading

Gold Climbs on Safe-Haven DemandGold climbed to nearly $3,360 per ounce on Tuesday, marking its highest level in over a week, as renewed tariff threats from President Trump increased safe-haven demand. Trump announced a 100% tariff on foreign films and signaled upcoming measures targeting pharmaceuticals. Investors are now focused on the Federal Reserve’s policy decision, with rates expected to stay unchanged despite Trump’s push for cuts.
Resistance is expected at $3,385, then $3,450 and $3,500. Support stands at $3,300, followed by $3,265 and $3,200.
GOLD Gold buying is exceptionally high in 2025, and this surge is directly linked to geopolitical tensions-especially between China, Taiwan, and the United States-as well as broader trade and economic uncertainty.
Key Reasons for High Gold Buying
1. Geopolitical Risk: China–Taiwan–US Tensions
Investors are flocking to gold as a safe haven due to escalating tensions in the Taiwan Strait and the broader US-China relationship. Even without open conflict, the risk of confrontation or trade war is enough to drive up demand for gold.
The mere threat of a China-Taiwan conflict is seen as a potential trigger for global financial shocks, prompting investors to hedge against instability by accumulating gold.
2. Central Bank and Institutional Buying (Led by China)
Central banks, especially China’s, are buying gold at record levels. In Q1 2025, China’s central bank added 95 tonnes of gold to its reserves, part of a broader move to diversify away from US dollar assets.
This central bank accumulation is a major structural driver of gold’s price surge, providing persistent upward pressure even as other asset classes remain volatile.
3. Trade War and Tariff Uncertainty
The US has announced aggressive new tariffs on Chinese goods, and China is expected to retaliate. This has reignited fears of a global trade war, further fueling safe-haven demand for gold.
Gold is less affected by tariffs than other assets, making it particularly attractive during periods of trade friction.
4. Dollar Weakness and Portfolio Diversification
A sharp decline in the US Dollar Index (DXY) has also contributed to gold’s rise, as investors seek assets that are less exposed to dollar depreciation.
Regulatory changes in China have allowed more institutional and insurance fund investment in gold, further boosting demand.
Summary Table
Driver Gold Buying Impact
China–Taiwan–US Geopolitical Risk Strongly increases demand
Chinese Central Bank Accumulation Structural, sustained boost
Trade War/Tariff Uncertainty Safe-haven flows surge
Dollar Weakness Makes gold more attractive
In summary:
Gold buying is at record highs due to a combination of China–Taiwan–US geopolitical risk, aggressive central bank purchases (especially by China), trade war fears, and a weaker dollar. The situation in Taiwan is a major catalyst, as any escalation would have global economic consequences, making gold the preferred hedge for both institutions and individual investors.

GOLD PLAN UPDATE 06/05/2025XAUUSD: Bullish momentum confirmed
Gold just printed a strong bullish D candle after days of retracement.
Price has broken H4 resistance zone — potential retest of previous ATH ahead.
✅ Still watching for new buy opportunities.

Gold is once again affected by tariffs and rises sharplyNews: Gold rose sharply, mainly because Trump announced a 100% tariff on all films produced abroad and entering the United States, which once again triggered global trade tensions. At the same time, the conflict between Russia and Ukraine is still ongoing, and the situation in the Middle East has become tense again. For example, Israel’s missile attacks retaliated against the Houthi armed forces in Yemen and Iran. These have stimulated gold’s safe-haven properties and pushed up gold prices.
Technical aspect: Gold bulls are strong, so there is a certain risk in shorting gold. The point of concern below is the low of 3323. If gold continues to maintain its strength, it is impossible to fall below the 3323 line again.
Trading ideas: Buy gold near 3338, stop loss 3330, target 3360

GOLD → Correction before NFP. What are the chances of a decline?FX:XAUUSD strengthens amid dollar correction. The market is correcting ahead of NonFarm Payrolls, trying to accumulate potential before high volatility.
Gold recovers ahead of US employment report
On Friday, gold rebounded from a two-week low, recouping some of its losses ahead of the release of US labor market data (NFP), which could set the tone for prices going forward. Amid optimism over trade talks and a strong dollar, gold ended its worst week in two months, but geopolitical tensions and a potentially weak jobs report could boost demand for safe-haven assets again.
The correction in the dollar gives gold a small chance to strengthen. However, fundamentally, the overall trend has already set the tone and gold may continue to fall.
Resistance levels: 3268, 3285, 3295
Support levels: 3227, 3204
The correction may reach a local zone of interest (money pool) — liquidity above 3270, or the 0.7 Fibonacci zone, after which the price may continue its course along the new trend — down to 3193.
However, unpredictable and unexpected data could disrupt the structure and push the price up to 3320-3350.
Best regards, R. Linda!

GOLD GOLD ,apply cautious wait and see approach for gold ,gold is bullish and held by central banks and hedge funds .
every massive sell will be bought back.

XAAUSD GOLD (MY ANALAYS) 2025/5/11I've identified a double top pattern forming on the daily time frame for gold. If the price breaks below the neckline, there’s a key support level around 3200, where I expect a potential bounce. From there, the price could retest the neckline area (around 3235–3250), which would now act as resistance. If the price gets rejected at that level and resumes its downward move, and especially if 3200 support breaks, that would be a prime entry point for a swing trade.
I plan to enter after the break and retest of 3200 and aim to hold the position until the price reaches my target at 2980.
This setup aligns with the idea that 80% of trading is waiting so I’m staying patient and ready to act when the opportunity comes.

XAUUSD SHORT/SELL 1:4Are we ready for the drop?
1.Break of structure
2.Expanding flat formed
3. Engulfing candle in the 4 HR Timeframe
4. a, b, c correction needed for complete structure
5. FVG formed with the 4HR bearish candle needs to close
Entry:3407
Stop loss:3459
Take Profit:3186

A CLEAR SELL SET UP ON XAUUSD(GOLD)XAUUSD IS currently trending down , uptrend is clearly broken .we are patiently waiting price to retest the trend and order blog for a potential sell opportunity.

GOLDhe image you provided is a technical analysis of Gold (XAU/USD) on the 15-minute timeframe from TradingView. It clearly reflects a bearish (short) outlook for the coming weeks, potentially lasting until the end of May 2025. Here's a detailed breakdown:
🔍 Technical Context
Gold reached a high around 3,500, followed by a correction that revisited the 3,421 level, creating a strong resistance zone (likely due to liquidity grabs and profit-taking).
From there, the chart shows a potential reversal structure, with expectations of a downward move.
🔻 Bearish Scenario (Short)
The final target for this bearish move is in the 3,124–3,078 area, which represents a key liquidity zone (highlighted with dashed lines and orange horizontal levels).
Before reaching that, the price might test several intermediate support zones:
3,288
3,241
3,124
The current pattern suggests that after a strong upward impulse, the market is now likely taking a breather, possibly influenced by strength in the equity markets, which reduces gold's appeal as a safe haven in the short term.
📅 Expected Timeframe
This downward move is expected to unfold by the end of May 2025, as indicated by the vertical time markers on the chart (one marking May 15th).
📈 Additional Observations
There's a red-green box on the chart indicating the risk/reward zone for the short entry.
The previous bullish trend is marked by clear impulse and correction waves, but the current price action shows loss of momentum and possible reversal signs.

GOLD Bullish Breakout!
HI,Traders !
GOLD is trading in an uptrend
And the price made a bullish
Breakout of the key horizontal
Level of 3350.56$ and the brekaout
Is confirmed so we are bullish
Biased and we will be expecting
A further bullish continuation !
Comment and subscribe to help us grow !

Gold: Multi-cycle Liquidity & The Silent ResetThe Grand-Scale Consolidation – The Market Reckoning
The exaggerated price hike has already priced in all major factors—interest rates, geopolitics, economic shifts, and institutional positioning. Fear drove the market upwards, but now, it’s time for a long-term balance that reflects real demand, not opportunistic hype.
Right now, gold demand is opportunistic. Wealthy investors and institutions jumped in early, securing "first come, first serve" pricing at the cheap side. But the over-inflated FOMO has pushed speculative pricing beyond its actual value.
Liquidity Trap at the Top—Now What?
Liquidity is locked in a high-stakes trap, forcing major players into a cycle of cashing out and recollecting liquidity pools to break even. The initial investment isn’t profitable unless liquidity gets redistributed.
Only big players can push price higher, but now they are risking their own liquidity—they underestimated retail traders, whose excitement keeps fueling the cycle.
The Grand Consolidation Range
This trick works on a global scale—economic policies, geopolitical moves, and institutional trade positioning are primed for consolidation. If price action confirms this range-bound phase, we could be looking at a multi-cycle balancing period before the market corrects to its true value.
Swing High : 3,403 - 3,500 – The extended liquidity trap zone where institutional players exit positions.
Swing Low : 3,215 - 3,134 / 2,970 – The deeper retracement zones where liquidity pools reset before the next expansion move.
Early Warning – The Consolidation is Setting Up
This isn’t just a minor retracement—this is the early warning of an extended consolidation phase, where liquidity must cycle multiple times before any true trend shift occurs. For traders, this means selling high and buying low, but only with near-term confirmation signals to avoid liquidity traps. Key areas to watch:
Volume shifts – Exhaustion vs continuation signs.
Price reactions at swing levels – Validating liquidity absorption.
Institutional positioning – Tracking big player activity in price action.
Speculation vs Reality – Time Will Tell
While the current market behavior signals consolidation, only time will confirm whether this phase will fully materialize. There’s no absolute certainty, but the conditions are aligning toward a grand-scale liquidity rotation that could define gold’s trajectory for the foreseeable future.
I’m putting this out there first—before the rest of the market catches on. Gold is primed for grand-scale consolidation, but as always, we shall see .
