Gold (XAU/USD) Analysis – 1H
🏛 1. Current Market Structure
📈 During the Asian session open, gold showed a strong bullish reaction, confirming a resumption of upward momentum.
📐 The breakout of the trendline and reclaim of prior levels indicate a clear exit from consolidation.
🌍 2. Bigger Picture Outlook
🚀 This bullish impulse could now push gold towards new all-time highs, with targets above $3,500.
🗓 On Wednesday, Jerome Powell will speak – a potential rate cut is on the table, which could weaken the dollar, but might also hurt gold short-term if markets anticipate a rebound in growth.
🔍 3. Key Technical Observations
🟩 FVG 1H & OTE: Recently tapped, offering short-term support.
🟦 FVG 4H: A broader liquidity zone that has now been broken through.
🎯 4. Short-Term Expectations
📉 A pullback to the 1H OTE may occur to grab liquidity before continuation.
📈 If Asian market flows remain strong, gold could continue its momentum towards $3,500 and beyond ahead of the FED speech.
🔥 5. Upcoming Catalysts
🕰 Powell’s speech on Wednesday: High-impact event.
💸 Interest rate decision: If a cut is confirmed, gold may temporarily retrace despite a bullish longer-term outlook.
🌍 Asian session flows: Still favorable to gold, with visible liquidity spikes at session open.
✅ Conclusion
👉 The bullish recovery is now technically confirmed, with a clean structure and strong reactions at key zones.
📍 Levels to watch:
OTE + FVG 1H
The $3,500 mark
Powell’s speech as a primary macro catalyst
🔎 For now, gold remains well-supported during Asian hours, reflecting continued investor interest in uncertain times.
XAUUSD trade ideas

GOLD: Will Go Up! Long!
My dear friends,
Today we will analyse GOLD together☺️
The recent price action suggests a shift in mid-term momentum. A break above the current local range around 3,242.86 will confirm the new direction upwards with the target being the next key level of 3,268.10 and a reconvened placement of a stop-loss beyond the range.
❤️Sending you lots of Love and Hugs❤️


Market Context Using TPO Profile – Bearish Bias on GOLD This idea explores the market structure using TPO (Time Price Opportunity) Profiles, which show how long price has stayed at different levels over time. TPO charts help identify value areas, balance zones, and market sentiment shifts.
🧩 Key TPO Components on the Chart:
POC (Point of Control) – The price level where the most TPOs occurred (most time spent).
VAH / VAL (Value Area High/Low) – The range where ~70% of the activity happened.
Profile Blocks – Each session shows where time clustered, forming balance or imbalance.
Blue Zigzag Line – Highlights swing structure (higher highs/lows or lower highs/lows).
🔍 Analysis & Insights:
Bearish Structural Shift
Recent price action shows a clear breakdown below VAL, signaling a move away from previous acceptance zones into price discovery.
The zigzag structure confirms a series of lower highs and lower lows—classic bearish price action.
Downward-Shifting POCs
The POC has been migrating downward, showing the market is finding value at lower and lower prices—a sign that sellers are in control.
Acceptance Below Previous Value
The current session is trading well below the prior TPO value area, confirming the market is accepting lower prices.
No Signs of Responsive Buying
There's no significant TPO clustering at current lows, meaning buyers haven’t stepped in to defend any level yet—risk of further downside remains.
🔐 Key Levels:
Resistance to Watch: 3,300–3,320 USD
A re-test and rejection here would validate continuation to the downside.
Downside Target: 3,180–3,200 USD
This area could act as the next potential balance zone or support.
🧭 Bias: Bearish Until Proven Otherwise
With price breaking and accepting below key value areas, and no meaningful buyer defense yet, the short-term bias is firmly bearish.
💬 Let me know in the comments — are you playing the breakdown, or watching for a fade and failed auction?

XAUUSD TAKE RESISTANCE FROM TRADE LINEHere I Created This XAUUSD Chart Analysis
Pair : XAUUSD (Gold)
Timeframe: 1- Hour
Pattern: Resistance Level
Momentum: Bearish/ SELL
Entry Level : SELL 3327
Resistance zone : 3335
Target Will Be : 3300 / 3272
Disclaimer : This signal is based on personal analysis for learning purposes. Trade at your own risk and always use proper risk management.

gold end weekdear all my friends chart is clear.
read it and if you had any question feel free to ask.
Its just good business


Gold news dominates the market
The gold market has experienced dramatic fluctuations recently, and the market is completely dominated by news. Last Friday (May 10), after gold stopped falling and rebounded from 3202, it soared by $236 to a high of 3438 in the first two days of the week, stimulated by Trump's escalation of tariff policy. However, as market sentiment changed, it opened high and fell on Wednesday, and plummeted by $126 in a single day on Thursday. It directly broke through the 3300 mark in early trading on Friday, reaching a low of 3270, giving up nearly $200 in gains in just a few days.
Analysis of market driving factors:
Tariff policy has become the core variable that dominates the trend of gold. When Trump proposed to increase tariffs, the market was worried about the escalation of the global trade war, and safe-haven funds poured into gold crazily; and once the news showed signs of easing, bulls immediately took profits, causing the gold price to retreat sharply. In contrast, the Federal Reserve's interest rate decision and ongoing geopolitical conflicts have taken a back seat, reflecting the current market's extreme sensitivity to policy risks.
From a technical perspective, gold has entered a large shock pattern of fierce competition between bulls and bears. The daily level shows that the long upper shadow middle Yin line closed on Thursday confirmed the short-term top, and the MACD indicator showed a second dead cross, indicating further callback risks. The key resistance is at 3315 (MA10 and the middle track overlap) and 3345 (MA5), and the important support below is at 3237 (MA30) and 3192 (lower track). On the 4-hour chart, the MACD dead cross continues to increase in volume, the Bollinger Bands open downward, and the MA60 moving average 3310 constitutes a key resistance. The hourly line forms a row of top suppression at 3323-24, and 3310-15 becomes an important resistance area for short-term rebound.
Trading strategy suggestions:
In the current market environment, it is recommended to adopt a strategy that combines trend trading with key position game. On the short side, short with a light position near 3340-3350, stop loss 3360, target 3300-3270;
On the long side, focus on the 3270-65 support area. After stabilization, you can try short-term long, stop loss 3260, target 3300-3320;
If it further pulls back to the 3230-40 area (daily MA30), you can consider the layout of medium-term long orders, stop loss 3220, target 3280-3300.
It is particularly important to be vigilant that once it falls below the 3200 mark, it means that the medium-term trend turns bearish, and you need to stop loss immediately and wait and see.
Looking ahead, gold may continue to fluctuate greatly. Investors need to focus on three major focuses: first, the trend of Trump's tariff policy, which is still the core factor affecting gold prices; second, the need for technical correction. After a continuous plunge, there may be a rebound, but attention should be paid to the strong pressure zone of 3345-3370; finally, the change in market sentiment. If the demand for risk aversion continues to cool, the gold price may further test the 3200 mark.
Key operation tips:
Intraday trading uses 3330 as the long-short watershed. Keep a short-term thinking below, with a target of 3270-3240; if it breaks through 3330, it will switch to a short-term long strategy, with a target of 3345-3370. Mid-term investors can arrange long orders in batches in the 3200-3230 area to bet on the rising opportunities brought about by the policy shift again. It should be emphasized that the current market is volatile, and all transactions should strictly set stop losses to prevent sudden risks.

Waiting for FOMC news and profit taking action before that🔔🔔🔔 Gold news:
➡️ Gold prices came under heavy selling pressure early Wednesday, correcting sharply from a two-week high of $3,435. Fresh optimism over the upcoming U.S.-China trade talks and profit-taking ahead of the U.S. Federal Reserve’s policy announcements.
➡️ However, downside momentum will be limited as geopolitical tensions escalate globally, in the Middle East and Pakistan-India regions.
Personal opinion:
➡️ Investors are likely to stay on the sidelines and wait for the upcoming FOMC meeting, which will then shape the next direction. Gold prices could see a fresh rally if the Fed cuts rates in June due to concerns about the economic outlook, or vice versa. Therefore, the market today will not fluctuate too much until the news is announced
➡️ Analysis based on important resistance - support levels and Fibonacci combined with EMA to come up with a suitable strategy
Personal Plan:
🔆Price Zone Setup:
👉Buy Gold 3307- 3310
❌SL: 3303 | ✅TP: 3315- 3320 – 3325
👉 Sell Gold 3435- 3437
❌SL: 3442 | ✅TP: 3431- 3426 - 3420
FM wishes you a successful trading day 💰💰💰

Gold technical analysis and trading strategy
Affected by the hawkish stance of the Federal Reserve and the strengthening of the US dollar, gold has been under pressure and fluctuated recently, but geopolitical risks and the news of Trump's upcoming "major trade agreement" have made market sentiment cautious. Some bulls chose to take profits in the Asian session, and the price fell from the highs, showing a long-short tug-of-war pattern on the technical side.
Technical structure analysis
Although the daily level has a top and bottom structure of long-short transformation, the price still holds steady at 3300, indicating that the medium-term trend has not weakened. The current price is running near the key neckline support, and the 3320-3300 area will become an important defense line for bulls, and the upper 3380-3400 constitutes short-term resistance. The hourly chart shows that the price fell below the lower edge of the previous trading day's oscillation box at 3370, the moving average system is arranged in a short position, and the MACD runs below the zero axis, and the short-term trend is weak. The European and American sessions need to focus on the breakthrough direction of the 3310-3365 range.
Operation strategy suggestions
Short-term trading:
If the price falls back to 3310-3315, try to buy with a light position, stop loss below 3299, target 3340-3350
Rebound to 3360-3365, short under pressure, stop loss above 3375, target 3330-3320
Trend layout:
If the price falls below 3300, short orders can be followed up to 3280-3260
If the price breaks through 3380 resistance, it is expected to restart the upward trend and test above 3400
Risk warning
Focus on the content of Trump's press conference in the evening. Any unexpected details of the trade agreement may cause drastic market fluctuations. It is recommended that traders strictly control their positions and do a good job of stop loss protection. The current market sentiment is sensitive, and the game between technical and news aspects is intensifying, so we need to remain flexible.

Will gold's decline continue?A big negative line closed, covering the previous positive lines, and broke the support of the 5-day and 10-day moving averages. This wave may continue to fall to the Bollinger middle rail near 3300, but if it is a high-level shock, the Bollinger middle rail is not broken, and it may rise again to 3430. Therefore, gold has experienced big ups and downs in this cycle, and now it is possible to rise or fall. In the short cycle, pay attention to the support effect of 3355 under weakness. If it does not break, you can continue to be bullish. Investment strategy: Gold 3350 long, stop loss 3338, target 3450

With the Federal Reserve on hold, gold is ushering in a new engi
At 2 pm yesterday, the Federal Reserve announced that it would keep the benchmark interest rate unchanged at 4.25%-4.50%, in line with market expectations, and remained unchanged for the third consecutive meeting. After the announcement of the Fed's interest rate decision, the market continued to believe that the Fed would cut interest rates before July, and still expected three rate cuts this year.
Then Fed Chairman Powell downplayed any impression that the central bank would use interest rate cuts to ease the economic weakness caused by Trump's tariff policy at a press conference in the early morning.
Powell used the word "wait" 22 times to emphasize that the Fed is not in a hurry. He said: "We think the cost of waiting is quite low, so we are doing it."
Powell said: "In this case, we can't take the initiative because we don't actually know what the correct response to the data is until we see more data."
Powell hinted that the Fed will only cut interest rates after seeing evidence of a significant slowdown in the economy, and it may cut interest rates soon.
Returning to the market, first of all, from the gold daily chart, it can be seen that the current trend of gold is basically similar to that of the first half of the month.
There was a sharp retracement last week, and then the bottom daily line closed with a cross star, followed by a sharp rebound.
The current market is basically copying the previous market. If nothing unexpected happens, if it goes up in this trend, 3500 is very likely not the high point, and it is only a matter of time before a new high is reached.
In addition, from the 4-hour chart, yesterday, the bottom 3360 was tested many times, but it failed to break down. Today, the opening was stretched from 3360 to above 3400.
3360 is a intensive trading area suppression position in the early stage. After breaking through 3360 on Tuesday, it has not fallen below this position so far.
So, we can currently regard 3360 as an important support position.
So we can regard 3360 as the 618 support position, so as to infer the high point position.
As you can see in the picture, I have also marked the point, which is about 3450-60.
Finally, let's look at the hourly chart. You can see that from 3360 to the morning high of 3415, the Fibonacci position 50% position and 382 position are about 3390-85.
It is also about the lowest position of the callback.
In terms of future operations, you can basically rely on 3390-85 to enter the market and do more.
The upper target can basically see the 3440-60 range.

X1: GOLD/XAUUSD Buy Risking1% to make 3.63X1:
Risking 1% to make 3.63%
GOLD/XAUUSD Long for day trade, with my back testing of this strategy, it hits multiple possible take profits, manage your position accordingly.
Risking 1% to make 3.63%
Note: Manage your risk yourself, its risky trade, see how much your can risk yourself on this trade.
Use proper risk management
Looks like good trade.
Lets monitor.
Use proper risk management.
Disclaimer: only idea, not advice

XAUUSD – 30m Precision Buy from 79% Fib + Liquidity Grab📈 GOLD LONG CONTINUATION – May 7, 2025 | Smart Money Masterclass
Here’s a 🔥 textbook entry on XAUUSD, showing exactly how Smart Money engineered liquidity, tapped into the Fair Value Gap, and launched the price from deep Fib levels.
Let’s break this down like a true Chart Ninja:
🔍 KEY CONFLUENCES IN THIS SETUP:
🧠 FVG Respect: Perfect reaction from the imbalance zone (gray box)
💰 Liquidity Sweep: Triple low fake-out → "Buy-side Engineered Liquidity" ($ symbols)
📉 Descending Trendline Break: Acting as a final bear trap
🧲 Fib Retracement: Entry from deep golden pocket zone (between 70.5% and 79%)
📊 50% EQ Magnet Above: Price reacting towards premium inefficiency
🚀 Risk-Reward Setup: ~1:6 RR targeting imbalance fill around $3435
🏗️ Structure: Price built a base with multiple accumulation candles before break
📈 Trade Details:
🟢 Entry Zone: $3,388 – $3,393 (limit filled within FVG + Fib zone)
❌ SL: Just below 79% zone at $3,386
✅ TP: $3,435 (0% Fib level / top of the range + inefficiency)
📈 RRR: ~1:6 sniper level precision
⚙️ Execution Strategy:
Confirmation entry after inducement wick
FVG + Fib overlap = High probability zone
Optional scaling in across zone: 70.5%, 75%, 79%
First partials around $3,412, full TP at $3,435 zone
💬 Chart Ninja Quote of the Day:
"The best trades don’t chase price—they wait for price to chase them."
🔒 SETUP SUMMARY:
Timeframe: 30m
Bias: Bullish
Entry Type: Limit
Confluences: FVG + Fib + Liquidity Sweep
Trade Type: Reversal from Demand
Confirmation: Structure shift + Clean W bottom
💾 Save this setup and study it frame-by-frame.
📲 Share it with your trading crew who still think breakouts are reliable 😉

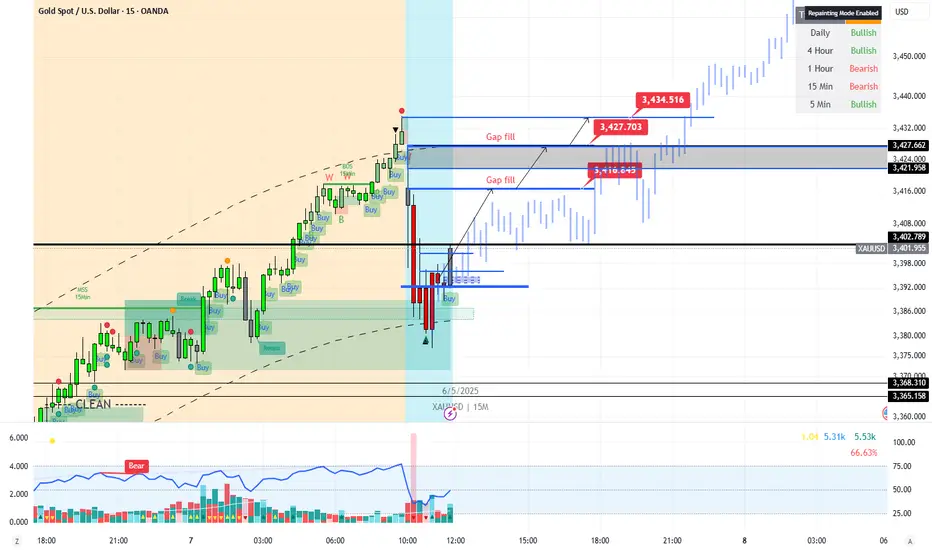
XAUUSD - Buy - A Shape Recovery - Gap fill - Strength
A Shape Recovery
Return to Previous Level imminent
Profit taking at NZ open from the massive run-up yesterday.
COT data didn’t show any buying of longs on Monday It could have driven down lower, but instead, they drove it up.
First, it should fill the gap, then continue on to 4,000… then 7,000 over time, of course.
The USA is still in hot water — Trump has ruffled a lot of feathers.
No one trusts him, no one likes him — a snake in the grass.
China is hunkering down until he’s gone.
Xi Jinping will not tolerate Trump’s snide remarks or his constant demeaning of him and China.
So, the USD will likely face 145% tariffs for quite some time.
It’s the perfect tool to help destroy Americas economy and they did it to themselves.
Weak Dollar. Strong Gold.
"China has stated it will not engage until the U.S. cancels its 145% tariffs, a condition the U.S. has not met. Despite hints of openness from both sides and China evaluating U.S. approaches, no formal agreement has been confirmed, and conflicting statements suggest the situation remains fluid. The lack of a signed deal, combined with China’s retaliatory 125% tariffs and its focus on diversifying trade partners, casts doubt on an imminent resolution"
XAUUSDHi ,
The market has consistently been rising as indicated in my yesterdays Analysis , The formation of series of HIGHER HIGHS $ HIGHER LOWS from 2nd May - 5Th May. This supports yesterdays idea on testing $3372 and infact went further up to $3380
If the fast EMA (8) is above the SLOW EMA (21) it then further supports the BULLISH COURSE.
If the RSI is hovering above 70 , this indicates the asset been OVERBROUGHT signaling a potential PULLBACK.
The PRICE consolidated before breaking out UPWARD , which indicates a CONTINUATION OF THE BULLISH TREND.
The current WAVES exhibits smooth pullbacks without DEEP CORRECTIONS , signaling STRONG BUYING PRESSURE.
The sudden SURGE in PRICE indicate INCREASING BULLISH MOMENTUM or a possible EXHAUSTION.
OVERALL we should hit $3372-85 and if the price breaks the zone and moves a little further it will signal further BUYS. If the PRICE breaks $3252 going down that should be your FALL CONFIRMATION.
Meanwhile i have a few buy positions active and waiting for further confirmation.

Gold: Multi-cycle Liquidity & The Silent ResetThe Grand-Scale Consolidation – The Market Reckoning
The exaggerated price hike has already priced in all major factors—interest rates, geopolitics, economic shifts, and institutional positioning. Fear drove the market upwards, but now, it’s time for a long-term balance that reflects real demand, not opportunistic hype.
Right now, gold demand is opportunistic. Wealthy investors and institutions jumped in early, securing "first come, first serve" pricing at the cheap side. But the over-inflated FOMO has pushed speculative pricing beyond its actual value.
Liquidity Trap at the Top—Now What?
Liquidity is locked in a high-stakes trap, forcing major players into a cycle of cashing out and recollecting liquidity pools to break even. The initial investment isn’t profitable unless liquidity gets redistributed.
Only big players can push price higher, but now they are risking their own liquidity—they underestimated retail traders, whose excitement keeps fueling the cycle.
The Grand Consolidation Range
This trick works on a global scale—economic policies, geopolitical moves, and institutional trade positioning are primed for consolidation. If price action confirms this range-bound phase, we could be looking at a multi-cycle balancing period before the market corrects to its true value.
Swing High : 3,403 - 3,500 – The extended liquidity trap zone where institutional players exit positions.
Swing Low : 3,215 - 3,134 / 2,970 – The deeper retracement zones where liquidity pools reset before the next expansion move.
Early Warning – The Consolidation is Setting Up
This isn’t just a minor retracement—this is the early warning of an extended consolidation phase, where liquidity must cycle multiple times before any true trend shift occurs. For traders, this means selling high and buying low, but only with near-term confirmation signals to avoid liquidity traps. Key areas to watch:
Volume shifts – Exhaustion vs continuation signs.
Price reactions at swing levels – Validating liquidity absorption.
Institutional positioning – Tracking big player activity in price action.
Speculation vs Reality – Time Will Tell
While the current market behavior signals consolidation, only time will confirm whether this phase will fully materialize. There’s no absolute certainty, but the conditions are aligning toward a grand-scale liquidity rotation that could define gold’s trajectory for the foreseeable future.
I’m putting this out there first—before the rest of the market catches on. Gold is primed for grand-scale consolidation, but as always, we shall see .

GOLD → Correction before NFP. What are the chances of a decline?FX:XAUUSD strengthens amid dollar correction. The market is correcting ahead of NonFarm Payrolls, trying to accumulate potential before high volatility.
Gold recovers ahead of US employment report
On Friday, gold rebounded from a two-week low, recouping some of its losses ahead of the release of US labor market data (NFP), which could set the tone for prices going forward. Amid optimism over trade talks and a strong dollar, gold ended its worst week in two months, but geopolitical tensions and a potentially weak jobs report could boost demand for safe-haven assets again.
The correction in the dollar gives gold a small chance to strengthen. However, fundamentally, the overall trend has already set the tone and gold may continue to fall.
Resistance levels: 3268, 3285, 3295
Support levels: 3227, 3204
The correction may reach a local zone of interest (money pool) — liquidity above 3270, or the 0.7 Fibonacci zone, after which the price may continue its course along the new trend — down to 3193.
However, unpredictable and unexpected data could disrupt the structure and push the price up to 3320-3350.
Best regards, R. Linda!

Markets turn their attention to US CPISafe-haven OANDA:XAUUSD fell nearly 3% on Monday (May 12) and continued to decline slightly in early trading on Tuesday (May 13), mainly due to the easing of market risk sentiment after the United States and China announced a temporary “ceasefire” in their trade war.
According to a joint statement released by the United States and China on Monday, the United States will reduce the tariffs imposed on Chinese goods in April this year from 145% to 30%, and China will reduce the tariffs imposed on American goods from 125% to 10%. The new measures will take effect in 90 days.
Gold prices fell more than 3% on Monday as risk sentiment improved after the US and China agreed to roll back tariffs for 90 days during talks over the weekend. This sent the US dollar soaring to its highest level in more than a month and global stocks rebounding strongly after the US and China reached an interim tariff deal. Meanwhile, gold sold off sharply as market sentiment began to shift back to risk assets, making the yellow metal less attractive.
China and the United States announced in Geneva, Switzerland, that they have reached an important economic and trade agreement. Both sides will also further reduce tariffs on each other's goods, with the total reduction exceeding 100%. The breakthrough marks a major turning point in the years-long tariff war between China and the United States. After implementing the measures, the two sides will establish a mechanism to continue negotiations on economic and trade relations, Xinhua News Agency reported.
Investors' attention turns to the US Consumer Price Index (CPI) report due out on Tuesday for a gauge of the Federal Reserve's policy direction. Other key US data this week include the Producer Price Index (PPI) and retail sales. Economists expect the US CPI to have risen by 2.4% year-on-year in April. Excluding volatile items, the core CPI growth rate is expected to have been unchanged at 2.8% year-on-year.
While the underlying market is under pressure from positive factors from trade to geopolitics, we (individual investors in the short term) still need to pay special attention to the erratic behavior of Do Nam Trung. A status line that brings tariff risks will push gold to increase strongly again.
Technical Outlook Analysis OANDA:XAUUSD
On the daily chart, a drop below the 0.50% Fibonacci retracement level would be a bullish signal for further downside with a target of around $3,163 in the short term, which is where the 0.618% Fibonacci retracement level is located.
In terms of momentum, gold is showing bearish signals as the RSI falls below 50 and the next target is the overbought zone, with the current RSI position, gold still has a lot of room to fall.
The most important condition for gold to be able to be assessed to increase in price again is that it needs to bring the price activity above the base price of 3,300 USD, then the target could be 3,371 USD. Otherwise, with the current market position and context, the short-term downtrend is dominant.
During the day, the possibility of a decline in gold prices will be noticed by the following technical positions.
Support: 3,228 - 3,200 - 3,163 USD
Resistance: 3,245 - 3,267 - 3,292 USD
SELL XAUUSD PRICE 3283 - 3281⚡️
↠↠ Stop Loss 3287
→Take Profit 1 3275
↨
→Take Profit 2 3369
BUY XAUUSD PRICE 3220 - 3222⚡️
↠↠ Stop Loss 3216
→Take Profit 1 3228
↨
→Take Profit 2 3234

XAUUSD DOUBLE TOP BEARISH PATTERNKey Factors to Consider:
Breakout Confirmation – If price decisively breaks below the neckline of the double top, it strengthens the bearish outlook.
Volume Analysis – A surge in selling volume at resistance or during the breakdown can validate the pattern.
Momentum Indicators – RSI, MACD, and Stochastic Oscillator can help confirm bearish momentum.
Support Levels – Watch for intermediate support zones that could slow down the decline before reaching 3203.
Resistance: 3500
Target: 3203

Gold (XAUUSD) Elliott Wave + AO Analysis (1H Chart) – 10 May 20Overview:
This 1-hour chart on XAUUSD highlights a clear 5-wave Elliott impulse, confirmed with Fibonacci extensions and the Awesome Oscillator (AO). Current structure suggests Wave (5) is in play, offering a high-probability short opportunity from the Wave (4) retracement zone.
🧠 Elliott Wave Count:
Wave (1): Initial bearish leg
Wave (2): Minor corrective pullback
Wave (3): Strong impulse confirmed by AO convergence
Wave (4): Corrective structure that respects the top of Wave (1) — valid Elliott structure
Wave (5): Now in progress, supported by AO divergence → momentum weakening
📌 Note: Wave 1 and Wave 3 are commonly measured using AO convergence, validating the strength of the impulse waves. Conversely, Wave 5 is often identified by AO divergence, signaling trend exhaustion.
📐 Fibonacci Extension Targets (Measured from Wave 4):
Expected zone for Wave (5) termination:
1.618 Fib: $3,312.17
2.618 Fib: $3,280.25 (most common)
4.236 Fib: $3,255.05
4.886 Fib: $3,241.30 (extreme extension)
📉 Wave (5) often terminates at 2.618 or 4.236 Fibonacci levels, especially when supported by AO divergence.
📊 AO (Awesome Oscillator) Insights:
✅ Wave (1) to (3): Clear convergence validates impulse
🚨 Wave (5): AO showing divergence = weakening sell momentum
Confirms Wave (5) status and end-stage trend behavior
🛠️ 🔴 Short-Only Strategy: Trade Wave (5) From Wave (4)
Entry Criteria:
Short initiated near the Wave (4) zone (~$3,330–$3,347)
Strong rejection candle (e.g., engulfing, pin bar) or breakdown confirmation
AO turning from green to red or histogram weakening
Stop Loss:
Above Wave (4) high = ~$3,347
Take Profit Levels:
🎯 TP1: $3,312 (1.618 Fib)
🎯 TP2: $3,280 (2.618 Fib)
🎯 TP3: $3,255 (4.236 Fib)
🎯 TP4 (optional final target): $3,241 (4.886 Fib)
Risk Management Tip: Adjust position sizing to align with stop above Wave (4) and TP zones at Fib targets.
🧩 Final Thoughts:
✅ High-probability bearish structure from Wave (4)
🚫 No bullish setups considered — focus is only on shorting Wave (5)
🔍 AO confirms both impulse strength and trend exhaustion via convergence/divergence
📐 Fibs align with standard Wave (5) projections
📈 Chart Context:
Gold (XAUUSD) – 1H timeframe
Indicators: Elliott Wave, AO, Fibonacci
Analysis Date: 10 May 2025
Bias: Bearish only

XAUUSD As indicated Yest , we were expecting a meltdown which started and didn't finish.
Garnish Pattern Formed in today's CHART indicating probability flying a little bit high,to confirm the flight we should look at $3325 once this level is broken with BULLISH MOMENTUM then we should target the next level @ $3435.
However if we were to confirm our FALL (MELTDOWN) then we should inspect level $3196-99 once this level is broken , then we should wait for a retest and have our ENTRIES and Target $2968 as our TAKE PROFIT zone.
Rising Wedge which we identified on 5/9 09:45. This pattern is still in the process of forming. Possible bullish price movement towards the resistance 3,333.85 within the next 1 hour.
The Bullish momentum seems to be increasing in bits.
Overall we are somehow BULLISH today , until proven otherwise , will be back with further updates as the market continue unfolding.

5.9 Gold is difficult to break through the top5.9 Gold is difficult to break through the top
Due to the increasing tension in the international situation, the overall trend and direction of gold will not change. However, due to the recent news from all sides, the price of gold has fluctuated greatly, which confuses many people and makes it difficult to judge whether the market is bullish or bearish. We must know that the market is changing rapidly and trading requires flexibility. We must remember to control positions, set stop losses strictly, do not resist orders, and wait patiently for opportunities.
The market has now fallen to the downward channel (A) and may continue to fall. However, the weekend is coming, some short positions may be closed, and the market may also enter the parallel channel (B).
Currently bearish, not bullish, the upper resistance level is 3330/3360. It is difficult to break through 3360 to form a new top in the short term.
SELL: 3320
SL: 3330
TP: 3290-3260
Thank you for your attention, I hope my analysis can help you.
