Gold Intraday Trading Plan 5/7/2025Gold has broken every possible resistance and is going towards 3500 previous ATH. I am still expecting strong bullish move today.
I will look for buying opportunity from 3387.
1st target 4430
2nd target 3500
XAUUSD trade ideas

Gold has reached the $3,400 level againThe Federal Reserve will announce the May FOMC interest rate decision and hold a press conference tomorrow.The market generally expects the interest rate to remain unchanged, but Powell's speech will be crucial. 👉👉👉The non - farm payrolls data in April was unexpectedly strong (with 177,000 new jobs added). Coupled with the Federal Reserve's concerns about inflation, Powell is likely to continue his hawkish stance and emphasize "inflation - fighting first". If he signals a delay in the timing of interest rate cuts, it may suppress the bullish sentiment in gold. Conversely, if he implies concerns about economic slowdown, gold may gain support.
Gold has recently broken through the key resistance of $3,330 and firmly stood above the $3,400 level. The daily chart shows a clear upward channel. Gold trading advice: Go long in the range of $3,380 - $3,390 on a pullback, with a stop - loss at $3,360 and a target of $3,430.
XAUUSD trading strategy
buy @ 3380-3390
sl 3270
tp 3420-3430
If you approve of my analysis, you can give it a thumbs-up as support. If you have different opinions, you can leave your thoughts in the comments.Thank you!👉👉👉

XAUUSD 3265: Bull-Bear Lifeline! Next Week's Trend PredictionFrom a daily chart perspective, overnight, the price of gold rebounded after hitting the bottom and closed with a bullish candlestick 🌞. However, on the 1-hour chart, the moving averages of gold have formed a bearish crossover pattern and are arranged in a downward trend for bears 📉. Moreover, this pattern will eventually continue to diverge downward. Currently, the price of gold has been suppressed and pulled back near the level of 3265 ⚠️. It can be seen from this that the area around 3265 will still be a crucial turning point determining the bull-bear trend of the gold price next week ⚡. Join 👉
In the latter part of the night, although the price of gold rebounded to some extent, compared with the previous decline range, the rebound strength is indeed limited 📉↗️. Looking ahead to next week, if the gold price fails to break through the resistance near 3265, then the market will most likely only maintain a volatile pattern at best, and it is less likely for the bulls in the gold market to achieve a direct reversal in the short term 📊. Investors should focus on the resistance at 3265 above and the strong support at the key level of 3195 below 🔍.
Join 👉
Accurate signals are updated every day 📈 If you encounter any problems during trading, these signals can serve as your reliable guide 🧭 Feel free to refer to them! I sincerely hope they'll be of great help to you 🌟 👇

Gold Breaks Wedge, 3270–3280 Now Key Pivot for RecoveryGold's recent retreat has slowed, forming a descending wedge pattern that has now been broken. This is a constructive setup for a potential upward reaction after falling $300 from the $3,500 high. The 3,270–3,280 zone is now the short-term pivot point. If this level breaks as well, the upward move may finally begin.
Potential targets include the 38.2% retracement level at 3,316 and the main resistance zone at 3,355–3,370.

5/12 Gold Trading SignalsGood morning everyone!
Gold opened lower and extended losses today, influenced by easing China–U.S. trade tensions and ceasefire news from India-Pakistan.
The recent rally was largely driven by safe-haven demand amid geopolitical concerns. As tensions ease, gold's retracement is a logical market reaction.
🔍 Technical Outlook:
Gold has now returned to a previous consolidation zone . While some support exists, current candlestick structure and most indicators show no clear bullish reversal yet.
Entering long positions too early may pose short-term risks, so trend trades should wait for stronger confirmation.
For flexible intraday trading, watch:
Support at 3263–3246: Holding this zone could trigger a rebound back toward 3309 resistance.
📌 Trading Recommendations:
✅ Sell Zone: 3306 – 3321
✅ Buy Zone: 3218 – 3198
🔁 Range for Scalp/Short-Term Trades: 3294 – 3263 / 3238 – 3269

Gold market analysis referenceFrom the gold hourly chart, the focus below is on the 3200 integer mark. If the market stabilizes below 3200, then this is a big double top, and the next decline will extend to the 3000 integer mark. On the contrary, if the 3200 mark is not broken, then the bulls will fight back, at least they will fill the gap again! Therefore, in terms of operation, it is not recommended to chase the short now, and it is recommended to wait for the price to stabilize in the 3200-3210 area to buy! Overall, today's short-term operation strategy for gold is to focus on rebound shorting and callback longing. The short-term focus on the upper side is 3280-3290 resistance, and the short-term focus on the lower side is 3200-3202 support.

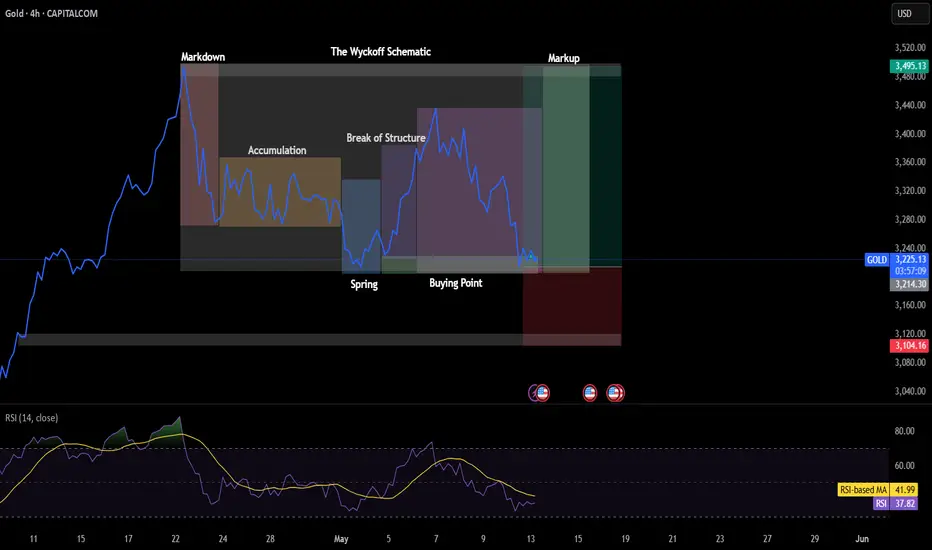
XAUUSD - The Wyckoff MethodGold is illustrating a classic Wyckoff Accumulation Schematic on 4-hour timeframe, highlighting a transition from a markdown to a markup phase. Initially, the price drops sharply in the markdown phase, falling from around $3,520, signaling strong selling pressure. This is followed by the accumulation phase, where the price consolidates between approximately $3,105 and $3,215 as institutional players quietly accumulate positions. A brief dip below this range forms the spring around $3,104.16—a false breakdown intended to trap sellers—before the price quickly recovers. The subsequent break of structure above $3,214.30 confirms a shift in market sentiment, leading to a clear buying point in anticipation of a bullish move. Price then enters the markup phase, targeting highs near $3,495.13, with a protective stop-loss ideally placed just below the spring. This structure suggests a strong bullish setup. Ideally this trend can be rode until a strong bearish divergence is observed on the Relative Strength Index
Gold plunges on tariff talks!Positive progress has been made in the Sino-US tariff negotiations, which has led to the activation of the global capital market. However, the safe-haven asset gold has been significantly sold off. The daily decline has once again exceeded $100. In the past two to three months, daily fluctuations of the hundred-dollar level have become the norm. Gold stabilized and rebounded after hitting a low of 3207 during the European trading session. During the US trading session, it further rose to a high of 3248. However, the upward momentum is relatively limited, and currently, the price is maintaining a volatile pattern within the range of 3231-3248. At present, 3250 has become a key resistance level. If it can be effectively broken through and the price can stand firm above it, the gold price is expected to further test the 3270-3288 area. Nevertheless, judging from the short-term momentum, there is still downward pressure for a pullback during the late trading session. Technically, the upper resistance is concentrated in the 3248-3252 range, and the lower support is around 3225-3217.
Trading Strategy:
sell@3245-3255
TP:3217-3222
you are currently struggling with losses, or are unsure which of the numerous trading strategies to follow, at this moment, you can choose to observe the operations within our channel.

Gold Will be Bullish from a Historic Support LevelHello Traders
In This Chart GOLD HOURLY Forex Forecast By FOREX PLANET
today Gold analysis 👆
🟢This Chart includes_ (GOLD market update)
🟢What is The Next Opportunity on GOLD Market
🟢how to Enter to the Valid Entry With Assurance Profit
This CHART is For Trader's that Want to Improve Their Technical Analysis Skills and Their Trading By Understanding How To Analyze The Market Using Multiple Timeframes and Understanding The Bigger Picture on the Charts

XAUUSD GOLD PLAN IDEA 12/05/2025XAU/USD (Gold) Trading Outlook The current price of XAU/USD around 3240 to 3235. We are anticipating a pullback towards the 3300 level, at which point we will look for long (buy) entry opportunities.
Key Resistance/Target Level:
TARGET 1: 3274
TARGET 2: 3360
TARGET 3: 3413
Key Support Levels:
SUPPORT 1:3220
SUPPORT 2: 3205
This Strategy is based on the expectation of a price retracement, providing a more favorable risk-reward setup for long positions.
SUPPORT MY IDEA

GOLD PULLBACK 3348Gold spot is down 3.5% at 3208 . by breaking 3234.567-3238, gold can go up 3325-3348 where it drop to 3208. nearest resistance is 3260-3270

Gold short Another short from 3270$.
If it closes that gap in 15min at 3275$ short position is going to be executed.

XAUMUSD Tactical Map - XAUMO ZONE INTEL — MUST KNOW LEVELS
Zone
Price Range
Purpose
Yellow Zone
3281 – 3285
Liquidity Trap / Stop Hunt / Fake Break Zone
Green Zone
3286 – 3292
Bullish Ignition Area — breakout activates longs
Red Zone
3292 – 3305
Bearish Rejection — Supply slap zone
KEY S/R ZONES
Resistance: 3285 / 3305 / 3315
Support: 3215 / 3201 / 3170
Dead Man’s Land (No Man’s Zone): 3235–3250 (fakeout noise)
FULL CAIRO SESSION BEHAVIOR MAP
BULLISH SCENARIO: Ride the Rocket
Time (Cairo)
Session
Behavior
Execution Plan
10:00 AM
London Open
Dip to 3215 sweep, fake breakdown
Buy Stop 3230, SL 3214, TP 3260
11:00–12:30
London Push
Momentum push to 3250–3260
Add on breakout + volume, trail SL to 3238
1:00–3:00 PM
Pre-NY
Sideways coil, triangle base
Wait for wedge breakout above 3265
3:30 PM
NY Open
Fakeout dip, then explosion up
Buy Stop 3286, SL 3265, TP1 3305, TP2 3315
4:30+ PM
NY Continuation
Ride trend if VWAP holds
TP at exhaustion, RSI > 60 confirms run
BEARISH SCENARIO: Slice the Floor
Time (Cairo)
Session
Behavior
Execution Plan
10:00 AM
London Open
Fake pump above 3250 to trap longs
Sell Limit 3248, SL 3260
11:00–12:30
London Fade
Breakdown, lower highs
Sell Stop 3220, SL 3235, TP1 3201
1:00–3:00 PM
Pre-NY
Dead bounce into sell again
Re-enter short at 3240 on rejection
3:30 PM
NY Open
Slam candle down
Sell Stop 3214, SL 3235, TP1 3201, TP2 3170
4:30+ PM
NY Continuation
Freefall if RSI < 40
Hold runners into 3170, tighten SL above 3210
HYPOTHETICAL STRIKE ORDERS
Primary Bearish Order (High Probability – “Execution Blade”)
Type: Sell Stop
Entry: 3214
SL: 3235
TP1: 3201
TP2: 3170
Confidence: 88%
Reason: Volume flush under Ichimoku cloud with engulfing pattern confirmation. NY volatility is the trigger.
Primary Bullish Order (Breakout Missile)
Type: Buy Stop
Entry: 3286
SL: 3265
TP1: 3305
TP2: 3315
Confidence: 65%
Reason: Break above liquidity trap with volume spike post-NY. Needs RSI > 55 and divergence confirmation.
Scalp Setup (Early Killshot)
Type: Buy Stop (Fade Reversal)
Entry: 3230
SL: 3214
TP: 3250
Confidence: 70%
Reason: London opening trap sweep and snap back.
SCALP / SWING ACTION ZONES
Scalp: 3220–3235 (Fade traps, use tight stops)
Swing: 3215 Break = DUMP into 3201/3170
Only Swing Long if 3285 flips into solid support post-NY
Strategic Checklist
When to Strike:
→ Confirmed volume + price behavior at mapped levels (3215 / 3285)
When to Defend:
→ If price chops inside 3235–3250. No entry. Let market choose.
When to Scalp:
→ During liquidity sweep or fake NY dips. Quick TP, tight SL.
When to Swing:
→ Only on confirmed session breakouts (NYO flush or pump).
FINAL WORD FROM XAUMO
The battlefield today is volatile, full of liquidity traps and engineered fakeouts. Your weapon is precision timing, not prediction. Watch volume, read rejection wicks, and strike with purpose. No mercy. No hesitation.

Gold ShortOn the one hour timeframe this is what i see. On Friday the trendline held but the bullish momentum was week and the trendline was broken during market open. Based on US-China deal that seems to be promising i believe we might see a short and since the trend line has been broken risk takers can go short and those who are afraid of risk can wait for more confirmations like a retest.


XAUUSD 15 MINUTEThe chart you've shared shows a 15-minute candlestick chart of Gold Spot (XAU/USD) with a highlighted trade setup:
Entry price: Approximately 3,282.635
Stop loss (red box): Around 3,291.729
Take profit (green box): Around 3,265.505
This appears to be a short position (sell) setup, aiming to profit from a decline in gold prices. The risk-to-reward ratio seems favorable, with a wider potential reward area compared to the risk.
Would you like an analysis of this setup or help calculating position sizing or risk?

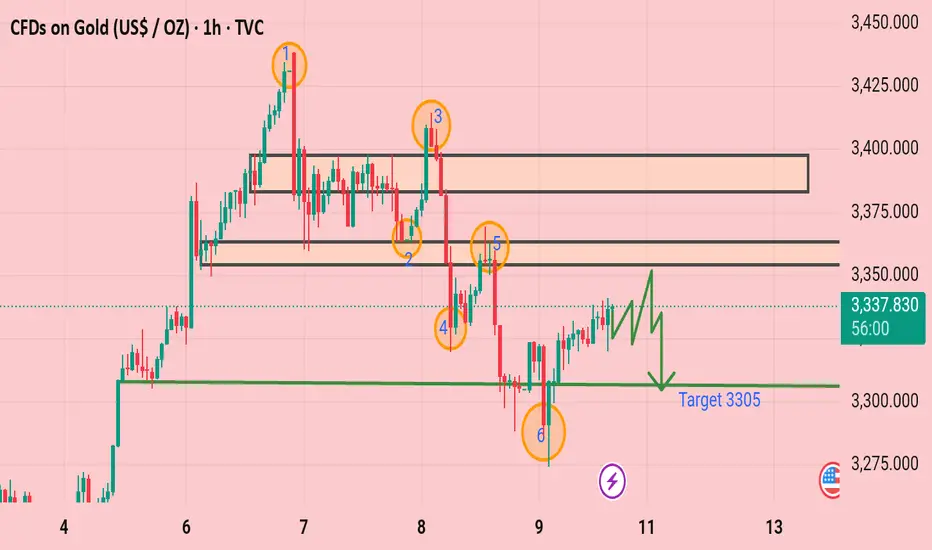
Gold Technical Analysis.The chart you uploaded shows the price movement of Gold (XAU/USD) on a 1-hour timeframe from TradingView. Here are some key observations:
1. Resistance and Support Zones:
The chart highlights two major resistance zones around 3,400 and 3,360, shown as shaded rectangles.
A support zone is marked near the 3,305 level.
2. Labeled Points (1 to 6):
These numbered points indicate significant price action events or turning points.
Point 1: A peak after an upward trend, indicating resistance.
Point 2: A pullback, showing resistance holding.
Point 3: Another attempt to break resistance, followed by a sharp drop.
Point 4 and 5: Lower highs, confirming a downtrend.
Point 6: A strong support test near 3,305, with a rebound.
3. Price Movement and Trend:
The chart suggests a downtrend after failing to sustain above the resistance zone.
The drawn arrow points downward toward the 3,305 level, indicating a possible bearish target.
Current price: 3,337.33, with a recent bounce from support.
4. Projected Target:
The chart indicates a target of around 3,305, suggesting a bearish bias.
Would you like a more detailed technical analysis or insight into trading strategies based on this chart?
Looking forward to seeing Gold respect that downfall We might not see it the same way but this what I believe Gold will be selling this week.

XAUUSD:Sharing of the Trading Strategy for Next WeekAll the trading signals this week have resulted in profits!!! Check it!!!👉👉👉
On Friday, spot gold saw a slight rebound and regained the $3,320 level during the North American trading session. However, it showed a volatile trend throughout the week. The trend for next week remains bullish. The market interprets the US - UK trade agreement as a "hollow agreement". Coupled with Trump's tariff remarks ahead of the upcoming high - level talks among major economies over the weekend, the risk - averse sentiment has heated up again, providing support for the gold price. Pay attention to the support level at $3,300 below. Wait for a pullback to go long.
Trading Strategy:
buy@3300-3320
TP:3340-3360-3400
The signals in the Signature have brought about continuous profits, and accurate signals are shared every day. Hurry up and click to get them!
👇 👇 👇 Obtain signals👉👉👉

XAU/USD H2 AnalysisPrice is moving within a triangle with support having recently been tested and rejected.
We may now see buyers take price higher to test the top of the structure again.
At that point look for a rejection or breakout.
This is a IDEA of what may happen. You should always trade with a profitable strategy and good risk management.

Its logical for Gold to touch liquidity zone.Its logical for Gold to touch liquidity zone before continuing uptrend

Will gold fall? Here comes the latest analysis.Technical analysis:
Gold fell rapidly in the morning and then bottomed out and rebounded. When the price broke through $3,324, it began to rise. The weak market will not rebound significantly. When the rebound that engulfed the decline appears, it will continue to rise. However, it should be noted that gold has been fluctuating at a high level for a week. It rose sharply on Monday and Tuesday, fell sharply on Wednesday and Thursday, and it is still fluctuating sharply today.
For the current trading market, I think the price of gold will continue to rise in the fluctuation. After the hourly cycle breaks through the $3,324 position, the market will gradually increase today, and there is room for further upward continuation. I think short-term trading is still mainly long; after the rebound high, you can choose a short strategy.
Action suggestions:
Long strategy: Go long at US$3330, stop loss at US$3320, and take profit at US$3360-3370.
Short strategy: short at $3,365, stop loss at $3,380, take profit at $3,300-3,310.

Gold rebounds despite trade optimism - levels to watchBased on the fact that equity markets have surged higher amid trade optimism, one would have expected gold to head lower. Well, it did fall in the last couple of days but it was trading near the session highs at the time of writing, up more than 1.1% on the session. The US dollar had weakened after staging a rally the day before, while the situation between India and Pakistan also probably played a role. But one has to wonder whether a rug pull is on the way soon. Keep an eye on potential resistance around 3345-50 area...support comes in at 3320 - if we break this level then a revisit of the overnight lows could be on the cards.
By Fawad Razaqzada, market analyst with FOREX.com
