Gold is bearish, don't chase the decline
There is no technology to speak of for gold at present. Basically, it is a mindless long position. After breaking the new high again today, a strategy of chasing long positions was decisively given. At present, members who entered the market early have made a profit of 40 points. This market has to be said to be too crazy.
Since gold started to rise from the low point of 2956, except for two normal adjustments in the middle, the price of gold has maintained a strong upward trend relying on the MA5 moving average for most of the time. This trend characteristic shows that in a shorter period, the MA5 moving average has become an important support line for the rise in gold prices. As long as the price runs above the MA5 moving average, the bulls will dominate.
At present, 3500 is about to arrive in a flash, it is just a matter of time. The current market depends on everyone's courage. There are more than a dozen profits when you enter the long position, which is easy, basically without callbacks, and any callback is an opportunity. In terms of operation, you can continue to do more by relying on the short-term moving average MA5.
I am Yulia, and I hope you can gain something and gain insights from my article! A small boat is drifting in the sea. If you don't set sail, you will drift in the sea forever. Only the existing value can truly protect you.
XAUUSD trade ideas

April 22, 2025 - XAUUSD GOLD Analysis and Potential OpportunitySummary:
Bullish momentum remains strong. The strategy for today continues to be: buy on pullbacks to support.
Key Levels to Watch:
3450–3455: Bullish target zone
3436: Support
3431: Support
3425: Support
3419: Support
3413: Support
👉 If my insights have been helpful to you, or if you traded based on my ideas, please consider giving a like — it’s a great encouragement for me! Thanks for your support!
Disclaimer: This is my personal opinion and not financial advice. Please manage your risk accordingly.

XAUUSD (Gold) Looks Strong Bullish .Hello Guys Here is My XAUUSD (Gold) Signal Update .
Gold Will Continue Its Bullish Trend Currently Its running at 3425-20 I can expect if its breaks 3452-53 it will Fly to 3480-3485
Gold Can Retrace From Support Area.
Boost And Comments On my ideas And Share your feedback About it.

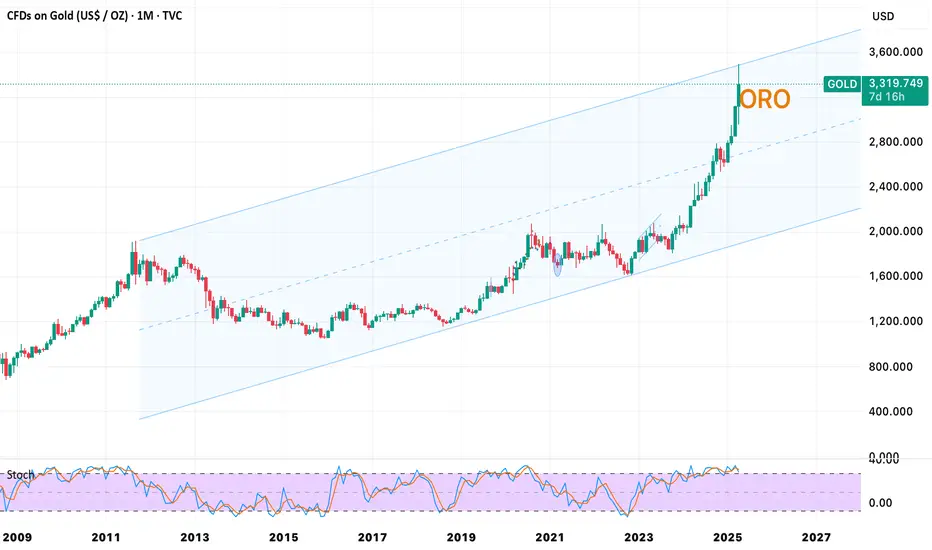
Gold Blows Past 50-Year Channel — New Supercycle Target $4200Original post + 75,000 pips see below
Intra trade idea + 46,000 pips see below
Gold has officially broken out of its long-term rising channel, confirming a macro expansion phase. With geopolitical tensions (Russia-Ukraine, Middle East, Taiwan), central bank buying at record levels, and Bitcoin showing signs of a breakdown, gold is being revalued as the ultimate safe-haven.
Fibonacci extensions from past cycles point to a third major all-time high between $4,270 and $4,600. We remain long and expect continued institutional rotation from crypto to gold as macro risks intensify. This move appears to be part of a larger historical pattern where each major gold bull market has topped at the -1.414 Fibonacci extension — a level that aligns closely with $4,270.
BTC, meanwhile, is showing early signs of correction due to extreme mining difficulty, potential miner capitulation post-halving, and rising macro uncertainty — suggesting capital is flowing back into more traditional hard assets.
We’ll monitor how the April open plays out, but with the technicals, fundamentals, and macro narratives all aligning, gold’s breakout seems far from over.
📍Gold has printed one of its most aggressive quarterly candles in history, currently trading around $3,117 — a full breakout above the long-standing macro trend channel, confirming a decisive phase shift in the market.
📍This breakout is not a wick or deviation — Gold has broken clean through the upper boundary of its decades-long rising channel, invalidating the idea of a return to mean and instead pointing to an acceleration phase.
📍Previous all-time highs in Gold have aligned closely with the -1.414 Fibonacci extensions of major bull runs. The first major top (1980) and the second (2011) respected this exact Fib level. Projecting that logic forward, the current structure suggests a third ATH around $4,270 (-1.414), with further upside possible toward $4,608 (-1.618).
📍The March 2025 candle is extremely strong — nearly a vertical move — and while a small short-term pullback is possible depending on April’s open, the longer-term picture remains undeniably bullish.
📊 Technical Outlook:
✅ Breakout above long-term macro channel = structural shift. Re-entry into the channel is highly unlikely at this point.
✅ Major Fib levels ahead: $3,582 (-1.0), $4,270 (-1.414), $4,608 (-1.618).
✅ Gold is showing repeating expansion behavior from prior cycles, with historical confluence at Fibonacci projections.
📍Key Support Levels:
❗ $2,948 – Now flipped to support (-0.618 Fib)
❗ $2,609 – Deeper support (-0.414 Fib), unlikely to be retested unless macro conditions shift
📍Key Resistance Levels:
🎯 $3,582 – Next technical barrier (-1.0 Fib)
🎯 $4,270 – Targeted 3rd ATH (-1.414)
🎯 $4,608 – Macro extension (-1.618), likely terminal point of current cycle
🌍 Fundamental & Geopolitical Context (as of March 2025):
🛑 1. Rising Global Tensions Fueling Safe-Haven Demand
The Russia-Ukraine war shows no sign of de-escalation, with new reports indicating increased mobilization on both sides.
Simultaneously, conflict between Israel and Hezbollah has intensified, spilling over into broader regional instability in the Middle East.
U.S.-China tensions have also resurfaced after Taiwan conducted military exercises and received advanced weaponry from Western allies, provoking responses from Beijing.
Trump's renewed political presence and rhetoric on “America First” policies, combined with potential NATO withdrawal, have created uncertainty about future global order.
All of this is driving institutions, central banks, and retail investors alike into hard assets like gold — the original safe haven.
📈 2. Central Banks Are Buying Gold at Record Levels
2024 saw the largest central bank gold purchases in history, led by China, Russia, and emerging markets seeking to de-dollarize.
The trend has continued into Q1 2025, with multiple central banks publicly declaring increased gold reserves.
This structural shift in reserves policy underpins gold demand even during minor pullbacks.
📉 3. Bitcoin Facing Pressure – Gold Poised to Outperform?
Bitcoin mining difficulty is at an all-time high as we approach the April 2025 halving. Margins for miners are shrinking rapidly.
Many publicly listed mining firms are capitulating or reducing operations — hash rate divergence suggests instability.
With interest rates still elevated and risk assets under pressure, Bitcoin is struggling to maintain its highs.
Technicals on BTC suggest a correction from current ~$70K levels down to $50K, potentially driven by miner distribution, ETF rotation, and lack of momentum.
This has caused a relative rotation from crypto risk assets back into traditional inflation hedges like gold.
🛢 4. Inflation, Oil, and Economic Instability
Oil has broken above $100 again amid Middle East instability, feeding back into global inflation concerns.
The U.S. economy is showing signs of stagflation: stubborn inflation with weakening job growth.
The Fed remains hawkish due to CPI persistence, making liquidity tighter — typically gold-positive.
📉 Bearish Scenario:
❌ Only a breakdown below $2,948 would indicate failed structure.
This would put gold back inside the channel, negating the breakout — but with current macro tailwinds, this appears extremely unlikely.
⚡ Summary & Alignment:
🔹 Technicals: Massive breakout above channel + historical Fib extensions imply $4,270–$4,600 targets.
🔹 Fundamentals: War, inflation, de-dollarization, and central bank demand all reinforce gold’s bullish case.
🔹 Bitcoin Weakness: Mining costs + halving + macro pressures = BTC to $50K risk, leading capital rotation into gold.
🔹 Geopolitics: Global uncertainty at multi-decade highs — gold thrives on instability.
📈 Outlook: Extremely Bullish for Gold
As fiat volatility, geopolitical instability, and crypto fragility intensify, gold continues to assert its role as the ultimate store of value. Technically and fundamentally, it is aligned for a macro push toward $4,270–$4,600 over the coming quarters.
Original idea:
Intra idea:
Tags:
gold, XAUUSD, commodities, forex, technicalanalysis, fibonacci, breakout, macro, geopolitics, safehaven, bitcoin, goldpriceforecast

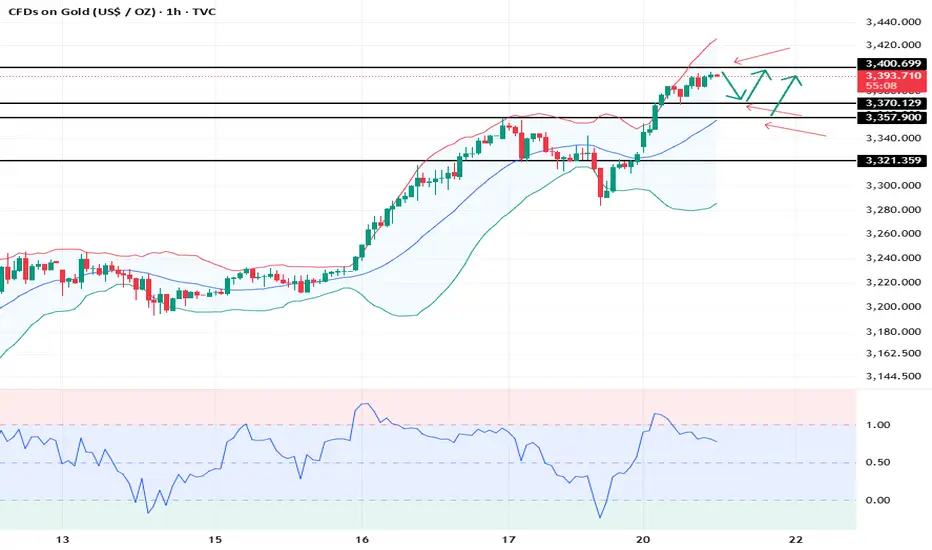
XAUUSD: 21/4 Today’s Market AnalysisGold technical analysis
Daily chart resistance 3400-3450, support 3320
Four-hour chart resistance 3400, support 3358
One-hour chart resistance 3400, support 3370
On the first trading day after the holiday, risk aversion continued to drive gold up, with a daily increase of more than 2%, and is about to reach the bull psychological target of 3400 integer mark. The Stochastic indicator is currently overbought, and if it fails to break through 3400, it may trigger a short-term correction.
If the price quickly falls below 3350, it will turn into a bearish trend. COMEX gold futures positions have reached a new high, and we need to be wary of long profits in the NY market that trigger selling.
Gold touching the 3400~3410 range may trigger a rapid correction. It has risen quickly recently, and it has also fallen quickly, and the amplitude is large. Therefore, it is not recommended to chase the high near 3400, and wait for the correction to stabilize near 3358 before buying.
Xauusd SellsGold has rallied hard on asia open. I'm anticipating a sell if London volume is low.
If 15 min candle closes below 3380 than sell with tp 1 @ 3372
Tp2 @ 3368
Tp3 @ 3356
Sl 2% risk.

Latest Gold Trading StrategyTrump's remark that "Who has the gold makes the rules" has reignited the gold market, with prices surging unidirectionally to 3370 in early trading following the opening bell. The uncertainty around international trade tariff policies, the uptick in U.S. inflation data, the heightened expectations of Federal Reserve rate cuts, and the intensified global risk-aversion sentiment collectively act as upward drivers for gold prices. Meanwhile, the continuous accumulation of gold reserves by central banks globally provides medium-to-long-term fundamental support for gold.
Strategically, it is advisable to maintain a "buy-on-dips" trading framework and seize position-building opportunities arising from market corrections. However, close monitoring of tariff-related news is critical to guard against potential price declines triggered by the easing of tariff conflicts.
Trading Strategy:
buy@3320-3330-3340
TP:3360-3370-3380
The signals resulted in continuous profits, and accurate signals were shared daily.

Gold Market Sets for $3500 SurgeAfter the breakout from 3230’s and the early weekly pullback at 3196, gold market disbursed a strong bullish surge. Now, with the bullish stance firmly held, the market sets its pace for 3500 USD/oz—marking a potential new milestone in the ongoing uptrend. follow for more insight , comment and boost idea

Volume gap on XAUUSD Market has to cover this gap before continuing its up side move towards 3400 Mark!
As Market opened with volume gap Market will must cover this gap asap .towards 3330 area.
Comments below if you are agreed

XAUUSD ProjectionUsing my GC strategy I have forecasted the Open and potentially the Sell zone for the week ahead

GOLDUSD 2H tim frame bullish continue $3.500 The next Stop? GOLD don't forget trend still is bullish.
Not financial advice

BULLISH MOMENTUM IS STILL ACTIVE ON GOLD!Price continues to trade new highs in the past trading week. The bullish momentum is still growing and we’re anticipating price to trade upto a new high of $3414 in the coming week. A buy opportunity is envisaged once we see a consolidation above the $3329.84 level.
Technically, price quickly rebounded off the bullish trendline which validated more buy opportunities once we see price consolidate above the $3329.84 level

XAUUSD-ICT conseptfollow buy is good deal because sell zone is weak don't have Stong sell but price is can breakdown u can follow sell if u want to rr high u much focus m5 when is break if u want to Shur 70percent up u much to wait strong buy or sell zone i Have EA like this LINE: arm1992-19

Gold Short from 3335 to 3235 Gold has gone up outside my band and volume off lower than what took us initially outside the band. I expect a retrace back to 3235 before we do a dead cat bounce and the proper fall begins.

Is the gold price rally over?Market news:
In early Asian trading on Thursday (April 24), spot gold rebounded sharply and is currently trading around $3,355/ounce, supported by bargain hunting. London gold prices continued to fall from record highs on Wednesday, falling nearly 3% to a low of $3,260/ounce, a stunning plunge. U.S. President Trump's remarks not only appeased investors and encouraged risky assets, but also hit international gold. Due to the possible easing of tensions between China and the United States, and U.S. President Trump's statement that he does not intend to fire Federal Reserve Chairman Powell, risk appetite has improved, the overall financial market atmosphere has improved, and the U.S. dollar has also rebounded from Trump's criticism of Powell for not cutting interest rates for several consecutive days. This has suppressed gold prices. After gold prices were blocked and fell back at the 3,500 mark, more short-term long profit-taking also dragged down international gold prices. This trading day will release the initial monthly rate of durable goods orders in the United States in March and the number of initial jobless claims in the United States as of the week ending April 19. Investors need to pay attention to them. In addition, they need to continue to pay attention to relevant news about the international trade situation and geopolitical situation.
Technical Review:
Gold Since 2025, the bull market of gold has been obvious. In just one quarter, it has reached the 3500 mark, and the increase has jumped by about 30%, which further illustrates the severe global economic situation and the risks brought by regional political turmoil, thus prompting investors to choose to buy gold to avoid inflation! After the gold white plate fell yesterday, the European plate continued to adjust widely, and the long and short battles were obvious. Subsequently, the short-term correction continued to intensify. The United States was afraid of breaking down again to 3260, the largest correction from the recent high! As time goes by, Huang is facing the closing of the monthly and weekly lines today. In the short term, we believe that the correction is likely to end soon, and there will be another pullback at any time. Pay attention to the 3380 inflection point for the pullback, and the inflection point breakthrough will be tested again at any time! At present, from the market, we can clearly see that the long-term gold bull market is not reduced. The short-term correction may be for better stretching later. Therefore, we should pay attention to the correction strength in the short term. From the 4-hour chart, the current long MACD of Huang Jin is gradually decreasing, and it is about to switch to short position. However, the KDJ indicator signal bottom divergence, and the big golden cross is expected. Obviously, the most important thing is to look at the Asian market trend and the closing of the next white market of gold!
Today fenxi:
The gold daily line fell by 240 US dollars in a row. At present, 3500 is temporarily under short-term pressure. Whether the adjustment is over or not is still uncertain. The short-term 4-hour middle track 3380 has been lost and has become a key counter-pressure point. As long as it does not stand on it again, it will maintain a downward correction. After breaking 3292 below, it is the 66-day moving average of 3260 to see the loss! The 1-hour K-line was under pressure from ma10 and ma5, and continued to fall. After last night’s consolidation and pull-up, the K-line is now running above ma10 again, and the macd is under the zero axis. This wave of 200 US dollars’ rapid decline has almost corrected most of it. If it continues to fall, or with the help of bottom divergence, it will slowly brew a short-term bottom! Today is also a critical day for gold. After the bottom of 3260, will the adjustment end and continue to rise, or will it just rebound? Then today’s strength is very important. If gold continues to rise directly today without a major correction, it means that gold may start to fluctuate and rise again.
Operation ideas:
Short-term gold 3315-3318 buy, stop loss 3306, target 3360-3380;
Short-term gold 3387-3390 sell, stop loss 3400, target 3320-3330;
Key points:
First support level: 3326, second support level: 3300, third support level: 3288
First resistance level: 3350, second resistance level: 3376, third resistance level: 3400

XAU / USD 4 Hour ChartHello traders. Looking at the 4 hour chart I have marked the area of interest. Let's see what tomorrow brings after tonight's overnight sessions. Big G gets a shout out. Be well and trade the trend.

Analysis of the latest gold market trend on April 24:
Market review and current technical analysis:
Gold hit a high of 3386 on the 23rd, and the lowest in the US session was 3260, with a single-day decline of 1260PIPS. The overall decline continued but was accompanied by multiple rebounds, showing the market's long and short divergence.
After the risk aversion sentiment subsided, the high-level selling pressure was obvious, but the low-level buying intervention caused the price to fluctuate. The daily line is expected to close with an upper shadow negative line. The shorts are still dominant but need to be vigilant against rebound corrections.
Key points:
Support level: 3260 (US session low), 3230 (next key support).
Resistance levels: 3315 (early trading high), 3350 (European trading high, if the price breaks through, short positions will be temporarily suspended).
The 1-hour chart shows that after falling below 3285, the support moved down to around 3230. If the US session rebound cannot stand at 3315, it may fall again.
Market sentiment:
Short-term bearish, but the downward momentum is weaker than the previous day, and we need to be wary of oversold rebounds. If the rebound is weak, it may further test the 3230-3260 range.
Today's operation strategy
Core idea: short-selling on rebounds as the main, short-term long on pullbacks as the auxiliary, strict stop loss, and avoid resistance.
Short order strategy:
Entry point: light position short in the 3313-3315 range, if it rebounds to 3320, you can cover the position.
Stop loss: above 3330 (to prevent false breakthroughs).
Target: 3280-3270 (first look at support), break down to 3260-3230.
Long order strategy:
Entry point: short-term long after stabilization in the 3260-3265 range.
Stop loss: below 3255 (narrow stop loss to prevent breakage).
Target: 3290-3310. If it breaks through 3320, you can hold it and expect a higher rebound.
Key points
Risk control:
Stop loss for a single transaction should not exceed 2% of the principal, and avoid heavy positions.
If the price quickly falls below 3260, long orders must strictly stop loss and cannot increase positions against the trend.
Market change signal:
Break above 3350: Short orders need to leave the market, and may turn to shock or rebound.
Breaking below 3230: opening up room for further decline, and short orders can be followed.
Time node:
Pay attention to the 3315 resistance in the Asian and European sessions, and be alert to data or news disturbances (such as geopolitical situation and US dollar trend) during the US session.
Summary
Gold is short-term technically bearish, but be alert to the rebound caused by low buying support. In terms of operation, high-altitude is preferred, and long orders are only used as short-term transactions against the trend. Pay close attention to the two key watersheds of 3260 and 3315, and adjust positions flexibly.

Gold Traders Pay AttentionA Major Buying Opportunity is Emerging for GOLD ( XAUUSD )
In this analysis, we highlight an upcoming potential buy zone on GOLD ( XAUUSD ) that could present a significant trading setup. We’ll break down recent price action, key support zones, and technical signals that traders should keep on their radar.
Whether you're focused on intraday strategies or swing trading, these insights can help you position effectively for the next major move.
Don't miss out—watch the full breakdown for complete details.
Share your GOLD trade strategy in the comments below.

GOLD Is Very Bullish! Long!
Here is our detailed technical review for GOLD.
Time Frame: 2h
Current Trend: Bullish
Sentiment: Oversold (based on 7-period RSI)
Forecast: Bullish
The market is trading around a solid horizontal structure 3,329.08.
The above observations make me that the market will inevitably achieve 3,396.74 level.
P.S
Please, note that an oversold/overbought condition can last for a long time, and therefore being oversold/overbought doesn't mean a price rally will come soon, or at all.
Disclosure: I am part of Trade Nation's Influencer program and receive a monthly fee for using their TradingView charts in my analysis.
Like and subscribe and comment my ideas if you enjoy them!

CHECK XAUUSD ANALYSIS SIGNAL UPDATE > GO AND READ THE CAPTAINBaddy dears friends 👋🏼
(XAUUSD) trading signals technical analysis satup👇🏼
I think now (XAUUSD) ready for(BUY)trade( XAUUSD ) BUY zone
( TRADE SATUP)
ENTRY POINT (3318) to (3320) 📊
FIRST TP (3325)📊
2ND TARGET (3330) 📊
LAST TARGET (3335) 📊
STOP LOOS (3310)❌
Tachincal analysis satup
Fallow risk management

GOLD doing pullback after reaching top channelAdditionally of Trump news, the technical analysis create a great opportunity to have a pullback in gold, by joining the top of the channel plus RSI and Stochastic in overbought areas in Weekly, Monthly and Daily bases.
The 3 Step Rocket Booster Strategy + Gold Price CorrectionThe rocket booster strategy is very
easy to understand.
In this video i show it to you.
Also we re using the strategy
to study the trends of
crypto market and stock market.
The video is very interesting.
Watch to see how we
compare the dollar to gold
in price performance
you will want to see this.
Also watch the video to learn more
about the Rocket Booster Strategy,
Rocket boost this content to learn more.
Disclaimer:Trading is risky please learn risk
management and profit taking strategies.
Also feel free to use a simulation trading account.

XAUUSD - BUY 🔻 Big Drive Down – After tapping -$3,500
Price tapped $3,500, triggering major profit-taking across Dubai - London and New York
Dubai started the sell-off
London piled in — aggressive push
New York confirmed the move — final slam down to fill the gap below.
📈 Now Price appears to be Pushing Back Up as it should to fill this mornings massive gap above from NZ open.
Gap below is now fully filled — technical objective met.
Buyers stepping back in from key demand zone.
Market now targeting the gap above to rebalance.
🔥 Macro Context Remains Bullish
Inflation is far from under control — expect it to rise still.
Interest rates will likely go up, not down good for Gold bad for Stocks.
Gold remains the primary safe-haven — this was a flush, not a reversal imho.
📍 Holding long bias.
Look to Elliott Wave projections on the chart for next target potentials.
: )
